INTRODUCTION
Compression garments (CGs) have traditionally and extensively been used in therapeutic medicine.1,2 These garments have primarily been used with vascular patients as a means to reduce edema by improving venous return and peripheral circulation,1,3 which may also provide an ergogenic benefit within athletic populations.4,5 The compression provided by CGs used in athletes generally ranges from 6 to 45 mmHg of pressure, and range from lower leg stockings to full body compression clothing. Higgins et al,6 found that competitive netballers wearing CGs were able to cover greater distances at faster speeds when compared to wearing their traditional netball garments (>20%), as well as when wearing placebo CGs (≥34%). The researchers speculated that the use of CGs may improve circulatory function during low-to-moderate intensity activity as well as reduce energy expenditure.6 Scanlan et al.7 examined the physiological effects of compression tights during endurance cycling. Interestingly, the results reported no improvement in time trial performance, but there was an increase in physiological efficiency.7
Research by Doan et al8 investigated the impact of compression shorts on 60 m sprint speed,and vertical jump performance amongst 10 male (age 20±0.9) Division 1 track athletes. Participants in the study experienced significant reductions in muscle oscillations (anterior to posterior) upon landing from a vertical jump and had a significantly greater jump height while wearing CGs; however, there were no significant differences in 60 m sprinting speed.8 Doan and colleagues suggested that the CGs may have acted as an ergogenic aid by providing greater joint support.8 This may, in part, explain the greater squat depth (1.8 cm) (p=0.024) achieved when compared to the control condition.8 Vercruyssen et al9 examined the effects of CGs on physiological and performance measures in highly trained trail runners following a short trail run. Results from their study suggests that CGs did not provide any significant performance enhancements in running economy.9 However, Bieuzen et al10 discovered that perceived muscle soreness was significantly lower among participants after wearing CGs, when compared to the control condition, following a fatiguing bout of off-road running in well-trained runners. These researchers also stated that another possible beneficial effect of wearing CG’s was improved muscle function (i.e, isometric peak force and countermovement jump performance) 1-hour and 24-hours post-run. These findings may have significant implications for individuals that are required to traverse various trails and uneven terrain, and are then required to perform tasks that require strength and power.
Research investigating the use of CGs for performance enhancement has been conducted in both laboratory11,12 and field13 setting with trained trail runners.9,10,14 In practice, CGs are often worn by recreational (novice) populations because of the garment’s aesthetic value, rather than its functionality16 and with the assumption that it decreases soreness and increases performance. However, these may be based on the marketing messages by companies claiming that their products will improve athletic performance and increase physiological efficiency to increase exercise capacity.17 While many studies have examined the effects of CGs on exercise performance, none have investigated these effects among recreationally trained individuals in austere conditions at relatively higher altitudes.13,14,17 Therefore, the purpose of this study was to examine the effect of CGs on physiological, performance, and perceptual measures while traversing uneven terrain at a relatively higher altitude.
METHODS
Participants
Thirteen participants were initially recruited, of which, three withdrew before data collection, and one participant was excluded because environmental conditions were not consistent between his data collection session and those of the remaining group. Nine (n=9) recreationally active males (age: 26.9±4.9 years; hight: 178.22±5.89 cm; weight: 85±13.3 kg),that participated in vigorous intensity activities at least twice per week for a minimum of one year, and currently experienced no skeletal or neurological injuries, participated in the study. None of the participants had previous experience in trail running competitions. Ethics approval was obtained from the University of Colorado, Colorado Springs Institutional Review Board (#14-219, Date: 07/28/14). Subjects were recruited via flyers and word of mouth advertising from the university, city, and surrounding communities. Prior to testing, informed consent was obtained from each participant following which they completed a medical history and physical activity readiness questionnaire.
Procedures
Participants served as their own control in a repeated-measures experimental design completing two testing trials, one in self-selected normal active wear (control), and the other wearing graduated lower-body compression garments (CGs) (treatment). Testing trials were limited to two, in order to accurately investigate the effects CGs had on the physiological, performance, and perceptual measures.18 CGs were ankle long compression tights made of a circular knit 50 Denier Lycra fabric (2XU, Melbourne, Australia) and participants were provided the correct size and fit for the individual (according to the manufacturer’s recommendations). The control garment consisted of loose-fitting conventional shorts or sweat pants selected by the participants. Both the CG’s and control garments in this study were new and had never been worn prior to testing.
Participants were instructed to complete a dietary intake record for the 24 hours prior to the first trial; avoid consuming any food, alcohol or caffeine three hours prior to testing; and encouraged to consume at least 500 mL of water two hours prior to testing.19 Participants were instructed to match these consumption patterns as closely as possible for the 24 hours prior to the second trial.
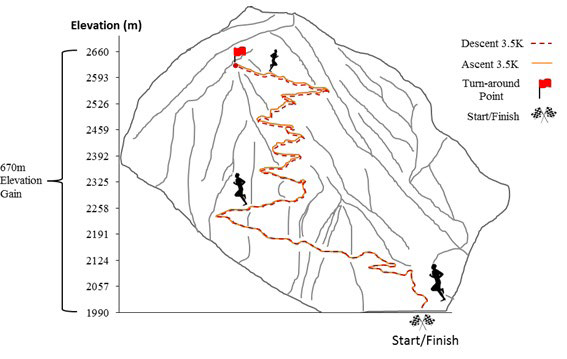
For the first testing session, subjects met at a mutually agreed upon time with the investigators at the Barr Trail trailhead in Manitou Springs, Colorado, US. The section of the Barr Trail used for testing gains over 600 m of elevation with a beginning elevation of 1990 m and a peak height of 2606 m. The out and back route was 7 kilometers (3.5 km ascent; 3.5km descent) (Figures 1 and 2). The route completed by the participants was primarily covered by loose dirt, rocks and roots. One of the investigators was positioned at the turn-around point, so the participants knew to turn around and begin the descent portion of the trial.
Figure 1. Graphical View of the Trail
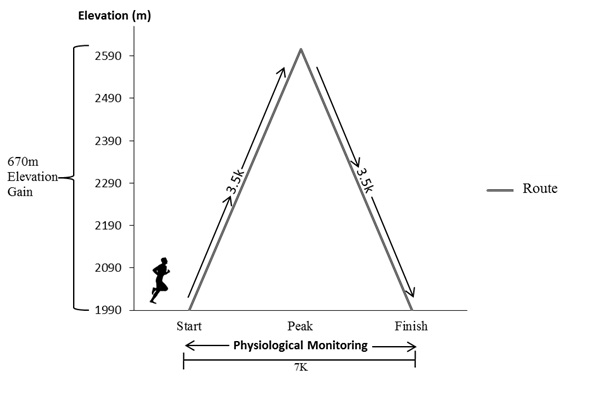
Figure 2. Outline View of the Trail
Prior to the start of each trial, ambient temperature and relative humidity were recorded using a digital psychrometer to ensure consistent environmental conditions during both trials.
Participant anthropometric data were then collected using a Tanita Body Composition Analyzer (TBF-310, Tanita Corporation, Inc., Tokyo, Japan) and a standard tape measure. Blood lactate (BLa) was analyzed by collecting a fingertip capillary blood sample and a portable lactate analyzer (Lactate Plus, Sports Resource Group, Inc.). Blood glucose was also measured at this time using a fingertip capillary blood sample and analyzed with a portable glucometer (Reli On, Ultima Blood Glucose Monitor, ArkrayInc., Kyoto, Japan).
Participants were then instructed to perform a self-selected warm-up for approximately five minutes prior to power and strength testing. Participants were provided a 5-minute familiarization session where an investigator explained and demonstrated each of the performance measures to the participants prior to actual testing. Following the explanation and demonstration, the participants were allowed three attempts at each performance measure.
Once the warm-up and familiarization session was complete, participants performed five successive countermovement jumps (CMJ), with 10 seconds rest allowed between efforts, on aswitch matt (Just Jump, Probiotics Inc., Huntsville, Alabama, US). The CMJ was performed by swinging the arms back, while flexing the knees and hips, drop to a self-selected depth, and then explode off the ground as high as possible while swinging the arms forward and up to achieve maximum height. This device utilizes a switch matt to estimate vertical flight time by measuring displacement time and utilizing an equation based on a constant gravitational force. Peak anaerobic power in watts (PAPw) was then calculated for each jump using the Sayers peak power equation.5
Upon completion of these jumps, participants were allowed 2 minutes rest, and then were asked to perform three successive isometric mid-thigh pulls using a back/leg dynamometer (Medico Inc., Phoenix, Arizona, US). A chain, which connects the scale on one end and a handle on the other, was adjusted so that the knees were bent at approximately 110 degrees. Participants were instructed to grab the handle of the dynomometer with the grip they use for the dead lift exercise. While maintaining good spinal posture, straight arms and feet flat on the base of the dynamometer, the participants explosively pulled the handle upward as hard and as fast as possible. Participants were allowed three trials to generate as much force as possible. Paricipants were given 1 minute of rest between attempts on this assessment, and each measurement was recorded to the nearest kilogram.
Participants were then fitted with a Zephyr Bioharness 3™ chest strap (Zephyr Technology Corporation; Annapolis, Maryland, US). This device was used to capture physiological data including heart rate, heart rate variability, estimated core temperature, respiration rate, posture, speed, distance and peak acceleration, physiological and mechanical load, physiological and mechanical intensity, training load, activity level, and estimated caloric expenditure. Once the Zephyr Bioharness 3™ chest strap was inplace, participants were allowed to begin their ascent up the Barr Trail. Participants were instructed to complete the trail run as fast as they could.
Immediately upon completion of the route, another fingertip capillary blood sample was collected and the same procedures for the pre-testing session were repeated. Participants were also contacted via phone or text message at 24, 48 and 72 hours after each trial in order to obtain their individual muscle soreness ratings. Participants were asked to analyze their muscle soreness on a scale of 1-10. Participants were instructed on how to exactly quantify their muscle soreness utilizing a pain scale ranging from 1 (no pain) to 10 (worst pain that the individual has ever experienced).
Participants completed the second trial on the same trail seven days after the first trial at approximately the same time of the day. The same pre- and post-test procedures were followed for each trial. However, prior to the start of the second trial, the participants were outfitted with the CG.
STATISTICAL ANALYSIS
Data were analyzed using SPSS (version 21.0; IBM Corporation, New York, USA). Descriptive data were reported as mean and standard deviations for the total sample. Due to non-normality of the data, differences in mean scores were determined via a series of Wilcoxon signed rank tests for the whole, ascent and descent portions of the test. Calculations to determine percentages of change between pre- and post-testing sessions, as well as trial one and two were also performed. A priorialpha levels were set at p≤0.05.
RESULTS
The results section is split into three separate sub-sections. The first sub-section provides the physiological outcomes for all participants. The second sub-section describes the analysis of the performance measures of all participants between both trials. The third sub-section details the statistical differences between trials for post exercise pain/recovery ratings. Only data that was found to be statistically significant, or approaching statistical significance (i.e., p=0.06 or less), are detailed within each table.
Physiological Data
All physiological data were collected via the Zephyr Bioharness 3™. Mean and standard deviations for each variable and trial are detailed in Table 1. Between the two 7 km trials, significant differences between trial 1 (control) and trial 2 (CG) were found in physiological load (p=0.04); training load (p=0.01); average physiological intensity (p=0.05); and estimated caloric expenditure (p=0.02) (Table 1).
| Table 1. Differences between Time Trials |
|
Variable Measured
|
Trial 1 (Control) (Mean ± SD) |
Trial 2 (CG) (Mean ± SD)
|
Significance
|
|
Physiological load (au)
|
496.79 ± 98.28 |
454.33 ± 70.49 |
p=0.04* |
| Training load (au) |
397.56 ± 47.15 |
374.11 ± 38.37
|
p=0.01*
|
|
Average physiological intensity (au)
|
37.53 ± 1.77 |
7.03 ± 1.59 |
p=0.05* |
| Estimated caloric expenditure (kcal) |
1157.90 ± 249.10 |
1092.70 ± 196.43
|
p=0.02*
|
| *Statistically significant at p≤0.05 |
Due to each trial consisting of an ascent and descent portion, analysis of each portion was completed separately. During the 3.5 km ascent portion of Trial 1 (control) and Trial 2 (CG), significant differences were found between trials in estimated caloric expenditure (p=0.04) (Table 2). Furthermore, during the 3.5 km descent portion of Trial 1(control) and Trial 2 (CG), significant differences were discovered between trials in estimated core temperature (p=0.04); physiological load (p=0.01); mechanical load (p=0.01); average physiological intensity (p=0.008); average mechanical intensity (p=0.02); and estimated caloric expenditure (p=0.05) (Table 3).
| Table 2. Ascent Time Trial Only (3.5 km) |
|
Variable Measured
|
Trial 1 (Control) (Mean ± SD) |
Trial 2 (CG) (Mean ± SD) |
Significance |
| Estimated caloric expenditure (kcal) |
744.78 ± 150.28 |
714.66 ± 128.79 |
p=0.04*
|
| *Statistically significant at p≤0.05 |
| Table 3. Barr Trail Time Trial: Descent Only (3.5 km) |
|
Variable Measured
|
Trial 1 (Control) (Mean ± SD) |
Trial 2 (CG) (Mean ± SD) |
Significance |
| Estimated core temperature (˚F) |
102.58 ± 1.36 |
102.01 ± 0.98
|
p=0.04*
|
|
Physiological load (au)
|
405.55 ± 105.01 |
364.00 ± 71.44 |
p=0.01** |
| Mechanical load (au) |
175 ± 43.74 |
152.11 ± 32.66
|
p=0.01**
|
|
Average physiological intensity (au)
|
187.89 ± 24.14 |
174.11 ± 20.68 |
p=0.08** |
| Average mechanical intensity (au) |
7.7 ± 1.49 |
7.0 ± 1.44
|
p=0.02**
|
|
Estimated caloric expenditure (kcal)
|
405.56± 105.01 |
364.00 ± 71.44
|
p=0.05**
|
| *Significance at p≤0.05
** Significance at p≤0.01 |
Performance Measures
Significant differences were found between average vertical jump height (p=0.04) between trials (Table 4). This was indicative of a 4.53% improvement in average vertical jump height when wearing the CG. Additionally, it was also found that the total peak anaerobic power output (PAPw) generated was significantly greater (p=0.04) during the second pretesting session in which the CG were worn.
| Table 4. Power Measures: Differences between Pre-tests |
|
Variable Measured
|
Trial 1 (Control) (Mean ± SD) |
Trial 2 (CG) (Mean ± SD) |
Significance |
| Average vertical jump height (cm) |
54.33 ± 9.73 |
56.79 ± 9.06
|
p=0.04*
|
|
PAPw (watts)
|
405.55 ± 105.01 |
364.00 ± 71.44
|
p=0.04*
|
Peak power in watts (PAPw)=total peak anaerobic power output
*Statistical significance at p≤0.05 |
Significant increase was found between the total isometric strength produced during the isometric mid-thigh pull prior to each time trial, with the CG treatment showing better performance on average (p=0.03).This represents an increase in the total amount of weight lifted by 5.37% while wearing the CGs (Table 5).Additionally, significant differences were found between the total (p=0.03) isometric strength measurements collected for Trial 1(control) and Trial 2(CG) with the average pretest scores approaching significance at (p=0.051). This represents a 7.62% increase in performance while wearing the CGs. There was also significant difference between the total isometric strength between each pretest (p=0.05). This represents an increase in the total amount of weight lifted by 5.40%.
| Table 5. Isometric Strength: Differences between Pre-tests |
|
Variable Measured
|
Trial 1 (Control) (Mean ± SD) |
Trial 2 (CG) (Mean ± SD) |
Significance |
| Average isometric strength (kg) |
187.87 ± 29.5 |
202.19 ± 31.54
|
p=0.051*
|
|
Total isometric strength (kg)
|
563.64 ± 88.48 |
606.56 ± 94.63 |
p=0.03*
|
| *Significance level at p≤0.05 |
Post Exercise Pain Scale Ratings
While no significant mean score differences were found between trials in post exercise pain scale ratings at 24 hours, significant differences were observed at 48 hours (p=0.01) and 72 hours (p=0.038) post event with significantly less pain reported after the trialsin which the CGs were worn. (Table 6).
| Table 6. Pain Scale Differences between Trials |
|
Variable Measured
|
Trial 1 (Control) (Mean ± SD) |
Trial 2 (CG) (Mean ± SD) |
Significance |
| 24 hour post event |
7.0 ± 4.6 |
6.0.± 3.3
|
p=0.06
|
|
48 hour post event
|
3.39 ± 1.3 |
1.33 ± 0.7 |
p=0.007* |
| 72 hour post event |
1.44 ± 0.5 |
0.7 ± 0.7
|
p=0.038*
|
| *Significant level at p≤0.05 |
DISCUSSION
The aim of this pilot study was to investigate the influence of lower body compression garment on selected physiological, perceptual, and performance measures while traversing extreme terrain at altitude. Few studies have examined the effects the CGs have on trained trail runners.9,14 This is the first known study to examine the effects that CGs have on physiological, performance, and perceptual measures while navigating steep off-road terrain at altitude in non-competitive trail runners. These results may be significant for those recreational and competitive athletes that participate in training and events performed over similar terrain. Furthermore, reduced levels of pain in the hours following such activity may allow athletes to train more frequently and at a higher intensity.
Our findings did not reveal any statistically significant differences in time-to-completion between Trials 1 (control) and 2 (CG). These results are similar to previous studies where CGs did not produce any performance enhancements in sub-maximal endurance runs.9,14 In the current study, however, the lack of significance may be due to a low sample size and one participant who performed significantly worse during the second trial. Interestingly, seven of the nine participants improved their completion times while wearing the CGs by an average of 3.25%. Since, all participants were familiar with this trail, it is unlikely that this improvement was due to a learning effect.
For the ascent portion, four of the nine participants improved their ascent time while five were marginally slower. Remarkably, it was found that eight of the nine participants actually improved their time during the descent portion by an average of 6.29%. Thus, the descent portion for the second time trial appears to have accounted for the improvement in completion times between trials. This difference in time to completion, despite a slightly greater average group time on the ascent portion (0.56%), may also be explained by the observed reductions in physiological and mechanical load, as well as the average physiological and mechanical intensity while wearing the CGs.
Previous authors have suggested that the descent portion of the trial can lead to greater muscle damage due to the repetitive eccentric loading while running downhill.10 This is consistent with results from a similar study where participants were required to walk downhill for 30 minutes on a treadmill.19 These researchers discovered that the CGs may have altered the inflammatory response of the working muscles allowing the muscles to repair faster.19 The CGs could lead to a reduced amount of muscle oscillations experienced by the participant while controlling the repetitive eccentric loading of the lower body during the descent portion of the trial.13 This rapid recovery from the repeated eccentric loading in the muscle could also explain the reductions in the physiological parameters since less energy would be required with improved efficiency.
Previous research has speculated that graduated CGs may improve circulatory function during low to moderate activity as well as reducing energy expenditure due to the pressure gradient which has in turn been suggested to improve both venous return and blood flow.6,15 Therefore, CGs may produce an improved ability to conserve high-energy phosphates for subsequent short bursts of energy, and increase the clearance of metabolic waste products, leading to an increased repeated performance at high speeds.3,6 However, significant differences between the first (control) and second (CG) time trials were discovered in several areas. It was observed that participants experienced significant reductions in estimated physiological and training load, average physiological intensity, and caloric expenditure while wearing the CGs. Our results showed that that there was no improvement in time to completion, but there was a significant decrease in the physiological cost and caloric expenditure while wearing CGs. These findings are in accordance with other studies that reported a decreased physiological cost while performing submaximal endurance exercise when wearing CGs.7,16 The decrease of physiological demand while exercising is extremely desirable, as this may lead to an increase in exercise capacity and muscle efficiency.6,17 In addition, previous studies have reported that CGs provided participants with increased kinesthetic and proprioceptive awareness leading to an increase in running efficiency, resulting in a decrease in the metabolic cost of exercise.16,17 The combination of the lower metabolic energy cost and the possible ergogenic effect exerted on the exercising limbs may explain the decrease in caloric expenditure during sub-maximal exercise.22
For recreational and athletic competitors, it is not only the ability to express power, but also sustaining it may ultimately determine success. In this regard, there was no statistically significant differences between Trial 1 (control) and Trial 2 (CG). This is in agreement with previous studies that also reported no performance enhancements in CMJ between CGs and classic athletic wear.11,14,22,23 However, the pre-test sessions for each time trial revealed significant differences in average jump height (4.53%) when wearing the CGs. This in in accord with other studies that also reported an increase in jump height while wearing CGs.17 Moreover, while statistically insignificant, it is interesting that six of the nine participants in the current study achieved their greatest vertical jump heights during the pre-testing trials while wearing the CGs. Additionally, analysis for the total PAPw for all countermovement jumps during the pre-testing sessions was greatest while wearing the CG. This result is in agreement with the study conducted by Kraemer et al23 where results showed that CGs increased vertical jump height in pre-test conditions.23 Although the exact mechanism that CGs use to produce optimal performance enhancements is still relatively unknown, the increase in jump height and power production could be due to a combination of the physiological recoil from the CMJ in the muscle and the elastic component in the CGs.1,6,8 This could theoretically improve proprioception and lead to an increase in power output.11
Isometric strength in this study was measured using a leg-back dynamometer. Results from the current study show that the average isometric strength between pre-test sessions was significantly greater (7.6%) while wearing the CGs. Participants also significantly improved on the total amount of isometric force produced (5.37%) during the second pre-testing session in which the CG was worn. Moreover, while not statistically significant, it is noteworthy that a greater total amount of isometric force (3.01%) was also produced in the post-testing session in which the participants wore CGs. A recent study by Vercruyssen et al14 examined the effect of CGs on off road, trail-running performance in a race setting. Following the 15.6 km off-road race, the researchers found no statistically significant difference in maximal voluntary contraction values following a 15.6 km trail run between participants who wore CGs and regular athletic apparel.18 These findings suggest that the strength levels following the fatiguing endurance protocol were well maintained.14 The primary difference between this current study and that of Vercruyssen et al14 is that the total distance covered was over 8 km shorter, and our participants were not high level runners. Also, the physiological demand was lower when the participants were wearing the CGs. This increase in physiological efficiency could have led to the non-significant increase in isometric strength following the submaximal endurance exercise. Thus, based on these results, it is evident that an overall greater magnitude of force was produced when wearing the CGs. This may have practical significance, especially during use of situations in which sustained output of force is required.
CONCLUSION
The purpose of this study was to investigate the effects that CGs on the physiological, perceptual, and performance measures following traversing austere conditions at a relatively higher altitude. The CGs in this study did not produce any significant performance improvements following a 7 km time trial over uneven terrain. However, the CGs decreased the amount of physiological load, training load, and average physiological intensity and estimated caloric expenditure when compared to loose fitting, or regular, athletic clothing. Due to the limited knowledge of the mechanisms underlying the action of CGs, more research is needed to gain deeper insights on the ergogenic effect of CGs following submaximal exercise. Further studies should also examine the use of compression garments in the tactical population, as these individuals often need to cover austere terrain over long-distances and maintain strength and power are essential to mission success.
ACKNOWLEDGEMENTS
This study was partially funded by 2XU (Melbourne, Australia)
CONFLICTS OF INTEREST
None of the authors have any conflicts of interest.


