INTRODUCTION
The concept of time passing by has always been the subject of many debates through the centuries of humanity. Aristotle pointed out that the temporal consciousness does not capture only the present but also past and immediate future. Daily, during human-computer interactions (HCI), it is not uncommon that the user has to wait in front of one’s computer: during the loading of a web page, the setup of a program or its start. In the field of ergonomics, the main part of the recommendations for the design of user experience and the usability of systems emphasizes on the importance of the feedback provided to the users on the system state,1 especially during these waiting periods.
However, existing research on the estimation of waiting times shows that when the users focus on this time-related information, the longer their impression of waiting is.2 It was thus interesting to study the impact of temporal metaphors on satisfaction and perceived wait time by users. The first step of exploratory experiments3 showed that progress bars were the temporal metaphors that satisfied most users, and gave them the feeling of having to wait for a lesser time compared to other metaphors (icon, text, counters, white page). Therefore, we wanted to continue our understanding of the perceived waiting time by studying the impact of changes in the progress behavior. While progress bars are frequently used to inform the user of an ongoing process, their speed of filling may follow an accelerating or decelerating function.
COGNITIVE MODELS OF TIME PERCEPTION
In agreement with Kum, Lee, and Yeung,4 we consider that the perception of waiting time is not a linear and stable cognitive construct, whose growth is estimated from constant and continuous flows. It relies instead on complex cognitive processes that take into account both the moment when the estimation of perceived time occurs (evaluation during or after the waiting time), but also, during a subsequent evaluation, the recovery mechanisms that are involved in memory and influenced by recency and primacy effects are considered.5
In addition, the perception of waiting time varies depending on the context in which it occurs6 and the main task during which the wait is imposed.
Prospective vs. Retrospective Duration Judgments
Research on the perception of time distinguishes two paradigms depending on when the evaluation of a perceived duration is performed by a subject. In a prospective paradigm, individuals are informed that they will have to estimate the duration of a given time interval. Conversely, if they are not aware before the experiment that they will have to estimate perceived time duration, they will be performing a retrospective judgment.7 In a meta-analysis performed in 117 experiments, Block, Hancock, and Zakay8 show that when the cognitive load is high, appraisal time decreases while the retrospective assessment increases. Prospective evaluation of time would thus be dependent on attentional processes while retrospective evaluation would be influenced by memory processes. Zakay7 adds that in a situation of waiting, a subject is automatically busy performing a prospective duration judgment because waiting time attracts one’s attention and becomes the most salient factor in its environment.
The Attentional Gate Model
One of the best known cognitive models describing the perception of time is the attentional gate model of prospective time9 (Figure 1).
Figure 1. The Attentional Gate Model of Prospective Time Evaluation10
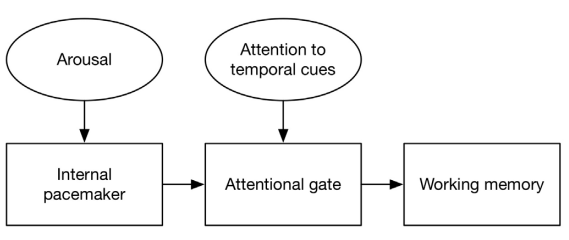
The first component of this simplified model10 is an internal pacemaker that generates pulses whose rate is only influenced by the level of arousal: the more the person is aroused, the more the pacemaker produces pulses.
The second part of the model is as a door opening to a greater or lesser extent depending on the attention to temporal signals. Open, it allows more pulses to cross the threshold of the door in order to be recorded and relayed to working memory. The more a person pays attention to temporal signals, the more the door opens, leaving thus numerous pulses crossing through it. Conversely, if the person does not pay attention to temporal stimuli or is distracted by other events, the attentional gate will therefore tend to close, thus leaving little pulses crossing through. The last component of this model, working memory will in turn create a representation of elapsed time, based primarily on the number of pulses relayed. Following this model, if one has the will to shorten the perceived time duration; one must either reduce the person’s level of arousal or divert one’s attention from time signals.10
WAITING TIME IN THE FIELD OF HUMAN-COMPUTER
INTERACTION (HCI)
Acceptable Waiting Time in HCI
The first studies in HCI on what constitutes an acceptable waiting time almost agreed on the identification of a 10-seconds threshold. Nielsen,11 for example, identified a 10-seconds limit over which the user does not focus effectively anymore on one’s task. In a study related to the tolerance of users in a waiting situation on the web, Bouch12 collected the users’ opinions on the time that they considered to be acceptable. In agreement with Nielsen,13 Bouch12 demonstrated that a delay longer than 10-seconds was considered as unsatisfactory, could be misleading for the user and could even reduce one’s effectiveness at work.
Waiting Time and Feedback
It is now widely accepted that feedback on the waiting time improves the usability of an interactive system.1,13. This feedback can take many forms: icon, progress bar, text message, etc. In a study on tolerable waiting time, Nah14 looked at the influence of the feedback on the users’ satisfaction. The author, in agreement with Geelhoed et al15 or Bouch12, showed that the presence of feedback greatly increases the time during which a user is willing to wait. Feedback not only improves the confidence of the user on the system but also results in a distraction to make the user wait better.
The temptation would, therefore, be to offer the user very detailed feedback especially by providing information on the waiting time and details regarding the ongoing process. However, if one can naturally think that very informative feedback will help the user to wait in a more efficient way, it appears that giving every detail on the progress of the ongoing process makes the wait seem longer.2 Indeed, the amount of information the user encodes during the waiting period increases the perception of waiting time. As one interprets every event as time-consuming, the user has the impression that a waiting period with more events seems longer than a waiting phase including fewer events.10 These findings are consistent with the model of the attentional gate described above10 (Figure 1), like very detailed feedback tends to focus the person’s attention on temporal signals, thus opening the attentional gate and supporting the free passage of the pulses. These pulses will later be recorded by the working memory, which will assess if the waiting time should be considered as being relatively long.
Temporal Metaphors in HCI
Progress bars16 are often used as a temporal metaphor to inform the user of the progress of an ongoing process. They are usually represented as bars filling up gradually from 0% to 100% completion of the task underway. Some studies have shown that among the different types of feedback given to the user, progress bars obtain the best performance results, both in terms of acceptability for attention and the user experience10,17,18. Myers16 showed that the presence of a progress bar during a waiting time improves the user’s self-efficacy and feeling of attractiveness. Referring to a progress bar, the user can know if the application was considered, that it was accepted and performed, and finally receive the answers generated by the system. Conversely, the lack of progress bar is a source of trouble, doubt and lack of concentration.
One of the limitations inherent in this approach is that it is often difficult to determine precisely how long the user’s wait will last. The filling process of the progress bar is often variable, which reduces the informational value of the latter.10 Eager to understand the effects of this variability on various factors involving the user, studies were conducted in order to measure the influence of progress bar behavior on the perception of waiting time.10,17
Effects of Progress Bars Behavior on Waiting Time Perception
The issue of progress bars’ behavior has been studied experimentally in the form of dichotomous comparison between progress bars with constant fill-rate or bars with variable fill-rate.10. In their experimental study, harrison, amento, kuznetsov and bell17 compare the perceived time between 9 bars of equal duration but with variation in the speed and style of filling (8 following nonlinear functions and one following a linear function). Only two bars, which followed speed-up functions, were seen as faster than a classical linear progress bar (linear constant progression). As a part of a prospective assessment, it seems that the recency-effect is an essential parameter to consider. To enhance the users experience, the authors recommend the setting up of a progress bar showing a constant behavior during the process and a rapid increase of speed at the end. However, in the view of the methodology of this study, in which subjects were asked to compare two progress bars (presented one after the other) at a very short duration (5 sec. approximately), it seems that the results reflect on the perception of the speed of a visual process rather than an estimated waiting time. The authors note that further investigation is necessary to validate the proposed hypothesis.
PROBLEMATIC AND RESEARCH HYPOTHESES
Based on studies in cognitive science and HCI on the perception of waiting time, we believe it is possible to influence the user’s perception in order to give the feeling that waiting time was shorter than it actually was in reality.3 The objective of the present study was to influence the perception of a progress bar behavior in terms of speed (acceleration versus deceleration). By combining the theories on the primacy effect in human memory and the attentional gate model of time evaluation, two assumptions are made in the present study:
- H1: the user will have the impression of having waited for a shorter duration when the progress bar follows a slow-down function than for a bar with a speed-up behavior. Indeed, in the case of retrospective judgment, the primacy effect will give the first impression of speed while the deceleration in growth will bring down the user’s level of arousal and decenter its attention from temporal signals to close the attentional gate.
- H2: the user will be more satisfied with a progress bar that slows down than by a progress bar that speeds up. Thus, the primacy effect, less ephemeral than the recency effect, is more beneficial for the user because it gives, from the first 5 seconds of waiting, feedback indicating considerable progress. Moreover, the perception of a shorter waiting duration assumed in our first hypothesis H1 should ensure greater satisfaction to the user.
METHODOLOGY
Participants
The experiment, available online, was broadcast on multiple communication channels (forums, social networks, mailing list). Eleven thousand and twenty-seven distinct subjects (controlled IP) were involved, including 105 women and 1022 men. The unequal number of men and women is due to the communication channels used for the diffusion of this experiment. Indeed, the forums and the mailing lists that have been chosen addressed rather technical jobs, as engineers or developers, that have more men than women. The mean age of the sample was 24.9-years (SD=7.11). The distribution of subjects according to the type of progress bar has been shown in Table 1.
| Table 1. Description of the Sample According to Each Type Progress Bar Behavior |
|
Female (n)
|
Male (n) |
Total (n) |
Average age (in years)
|
|
Speed up progress bar
|
37 |
355 |
392 |
24.4 |
| Slow down progress bar |
31 |
345 |
376 |
24.6
|
|
Constant progress bar
|
37 |
322 |
359 |
25.6 |
| Total |
105 |
1022 |
1127 |
24.9
|
Research Design and Independent Variable
In order to assess the perception of variation in progress bar behavior, three distinct bars were designed (Independent Variable), each of them having the same display duration of 10-seconds:
- A progress bar having a speed-up behavior, which means the filling rate and speed were accelerated during its progression. The increase was calculated on the basis of the formula: f=√time×3.16
- A progress bar having a slow-down behavior, which means the filling rate and speed were decelerated during its progression. The decrease was calculated on the basis of the formula: f=timex3⁄100
- A progress bar having a constant behavior, which means the filling rate and speed remained constant during its progression, following a linear function: f= time
Figures 2 and 3 represent the three experimental progress bar behaviors.
The screen display of the three progress bars were provided by an animated image (animated GIF), which ensures a perfect compatibility and a constant display time on all platforms (Microsoft Windows©, Mac OS©, ©Linux, etc.) and main browsers (Internet Explorer, Firefox, Safari, Chrome, Opera, etc.). In addition, before the experience was to be deployed to the users, the display time was timed and validated in 10 different configurations: Firefox, Chrome and Safari on Mac OS X, Internet Explorer, Firefox, Safari and Chrome on Windows 7, Internet Explorer and Firefox on Windows XP, Firefox on Ubuntu Linux.
Moreover, we took into account the difference between women and men, as an independent variable, in our study (Table 2).
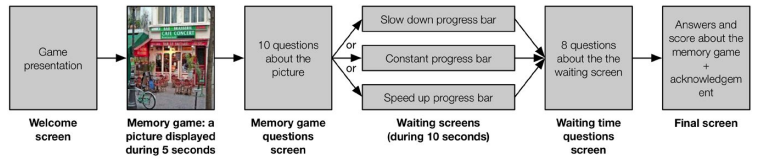
Dependent Measures
To test hypotheses H1 and H2, a website was developed that offered to the users a memory game seeking the mental exploration of an image.19 The game began with the visualization of a picture in 10-seconds (a photograph of a Parisian cafe). Then, the user was asked to answer some questions and to remember if the photograph encompassed 10 specific items (a bicycle, a person, etc.) or not. This game was a pretext to present a standby screen of 10-seconds during the step where the users’ responses were recorded. When the screen was in the standby mode, one of the three progress bars were displayed, in a random manner.
Finally, five questions adapted from the Questionnaire for User Interaction Satisfaction (QUIS)20 were presented to the user in order to ascertain a certain level of satisfaction of the user towards the website and in particular the waiting time after the game (Dependent Variable #1). For each question, a 7-point Likert scale raised an overall satisfaction score (reliability analysis confirmed the grouping of these five items to compute a global satisfaction score, with a Cronbach’s alpha α=0.823). The five items of the scale are presented in Table 2.
| Table 2. Questionnaire for User Satisfaction Adapted from the Quis20 |
| Item 1 |
System speed is
|
|
too slow
|
fast enough
|
| 1 |
2 |
3 |
4 |
5 |
6 |
7
|
| Item 2 |
System keeps you informed about what it is doing
|
| never |
always
|
|
1
|
2 |
3 |
4 |
5 |
6 |
7
|
| Item 3 |
System response time for most operations is
|
| too slow |
fast enough
|
|
1
|
2 |
3 |
4 |
5 |
6 |
7
|
| Item 4 |
System is fun to use
|
|
not at all
|
very much so
|
| 1 |
2 |
3 |
4 |
5 |
6
|
7
|
| Item 5 |
System response time just before the last window is
|
| too slow |
fast enough
|
|
1
|
2 |
3 |
4 |
5 |
6 |
7
|
A final open-ended question asked the user to evaluate, in seconds, how long one thought one had to wait during the recording of its game data: “In your opinion, how long did you have to wait before the summary window?”(Variable Dependent #2). Therefore, the evaluation of the waiting time was retrospective.4
The experimental procedure is summarized in the Figure 4.
Figure 4. Illustration of Experimental Procedure
RESULTS
Users’ Satisfaction (Dependent Variable #1)
- Gender difference and users’ satisfaction (Dependent Variable #1)
No significant difference among the answers was observed for the first 4 items of the QUIS:
- Item 1: F(1125)=2.798, p=0.095; t(1125)=0.428, p=0.668
- Item 2: F(1125)=0.097, p=0.775; t(1125)=-0.249, p=0.803
- Item 3: F(1125)=1.930, p=0.165; t(1125)=0.659, p=0.510
- Item 4: F(1125)=0.786, p=0.375; t(1125)=0.525, p=0.600
However, a significant difference among the answers was observed for the fifth item of the QUIS: F(5,1121)=0.062, p=0.803; t(1125)=3.819, p=0.000.
Moreover, as Levene’s test is not significant (F(5,1121)=1.397, p=0.223) for all the five items, we must accept the null hypothesis of equality of variances. Therefore, we present the results below without differentiating by gender.
- Overall results on users’ satisfaction (Dependent Variable #1)
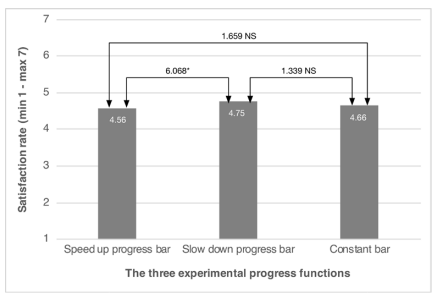
A significant difference among the three progress bars was observed in terms of satisfaction, F(2, 1124)=3.00, MSE=1.10, p=0.050, np2=0.27, and post-oc Tukey tests revealed there is no statistically significant difference between the speed-up bar (M=4.56) and the constant bar (M=4.66), neither between the slow-down bar (M=4.75) and the constant one. However, there is a significant difference between the speed-up bar and the slow-down bar (F(2, 1124)=6.068, p<.05). Thus, the slow-down bar is the one that offers the most satisfaction (Figure 5).
Figure 5. Mean and comparative mean test of users’ satisfaction according to progress bars’ behavior (NS=not significant)
More specifically, we present the post hoc comparisons using the Tukey HSD test for all items of the QUIS (Table 5).
| Table 5. Statistical Results and Comparisons Between the Five Items of the Quis, Based on the Anova (Tukey Hsd Test) Analysis (* = The Mean Difference is Significant at the 0.05 Level). |
|
Item of the QUIS
|
(I) Progress bar type |
(J) Progress bar type |
Mean Difference (I-J) |
Std. Error |
Sig. |
| Item 1 |
Speed up progress bar |
Slow down progress bar
Constant progress bar |
-.15122
-.28208* |
.10580
.10707 |
.326
.023 |
|
Slow down progress bar
|
Speed up progress bar
Constant progress bar |
.15122
-.13087 |
.10580
.10815 |
.326
.447 |
| Constant progress bar |
Speed up progress bar
Slow down progress bar |
.28208*
.13087 |
.10707
.10815 |
.023
.447
|
|
Item 2
|
Speed up progress bar
|
Slow down progress bar
Constant progress bar |
-.10763
-.06346 |
.09751
.09868 |
.512
.796 |
| Slow down progress bar |
Speed up progress bar
Constant progress bar |
.10763
.04418 |
.09751
.09968 |
.512
.897
|
|
Constant progress bar
|
Speed up progress bar
Slow down progress bar |
.06346
-.04418 |
.09868
.09968 |
.796
.897 |
| Item 3 |
Speed up progress bar |
Slow down progress bar
Constant progress bar |
-.10258
-.17215 |
.09285
.09397 |
.511
.160
|
|
Slow down progress bar
|
Speed up progress bar
Constant progress bar |
.10258
-.06957 |
.09285
.09492 |
.511
.744 |
| Constant progress bar |
Speed up progress bar
Slow down progress bar |
.17215
.06957 |
.09397
.09492 |
.160
.744
|
|
Item 4
|
Speed up progress bar
|
Slow down progress bar
Constant progress bar |
-.08446
-.16224 |
.09108
.09217 |
.623
.184 |
| Slow down progress bar |
Speed up progress bar
Constant progress bar |
.08446
-.07779 |
.09108
.09310 |
.623
.681
|
|
Constant progress bar
|
Speed up progress bar
Slow down progress bar |
.16224
.07779 |
.09217
.09310 |
.184
.681 |
| Item 5 |
Speed up progress bar |
Slow down progress bar
Constant progress bar |
-.03778
-.25744* |
.10644
.10772 |
.933
.045
|
|
Slow down progress bar
|
Speed up progress bar
Constant progress bar |
.03778
-.21966 |
.10644
.10881 |
.933
.108 |
| Constant progress bar |
Speed up progress bar
Slow down progress bar |
.25744*
.21966 |
.10772
.10881 |
.045
.108 |
Waiting Time Perception (Dependent Variable #2)
As with the satisfaction measurement, we first calculated whether there was a significant difference between the two sexes using a two way ANOVA (Table 6).
| Table 6. Mean and Standard Deviation Regarding the Gender and the Progress Bar Type for the Time Perception (in Seconds). |
|
Gender
|
Progress bar type |
Mean |
Std. Dev. |
N |
| Female |
Speed up progress bar |
9.51 |
5.02 |
37
|
|
Slow down progress bar
|
8.29 |
4.08 |
31 |
|
Constant progress bar
|
8.45 |
4.57 |
37
|
| Total |
8.78 |
4.59 |
105
|
|
Male
|
Speed up progress bar |
8.47 |
3.84 |
355 |
| Slow down progress bar |
8.81 |
4.33 |
345
|
|
Constant progress bar
|
8.36 |
3.83 |
322 |
| Total |
8.55 |
4.01 |
1022
|
|
Total
|
Speed up progress bar |
8.57 |
3.97 |
392 |
| Slow down progress bar |
8.76 |
4.31 |
376
|
|
Constant progress bar
|
8.37 |
3.90 |
359 |
| Total |
8.57 |
4.06 |
1127
|
| The results show that there is no significant difference between female and male (F(2, 1124)=0.252, p=0.616). Therefore, we have chosen to present the results without differentiating between the two genders. |
The results of the waiting time perception show that, on an average, the users rated their waiting time at 8.57 seconds (SD=4.07). Note also that 27% of them guessed the real waiting time, which was 10 seconds.
However, an ANOVA-test applied to the comparison of means for each of the progress bars shows that there is no significant difference in the perception of waiting durations The factors of the ANOVA were the 3 progress bars: slow down (M=8.37), constant (M=8.76) and speed up (M=8.57) (Figure 6).
Figure 6. Mean and Comparative Mean Test of Waiting Time Perception According to Progress Bars’ Behavior (NS=not significant).
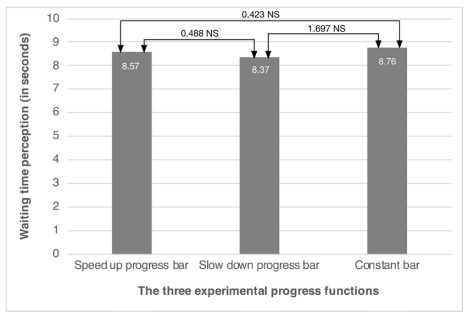
In other words, users had the feeling that they had to wait for the same duration regardless of the type of progress bar presented. There was no statistically significant difference between the evaluation of waiting time and the socio-demographic variables. Neither gender of the users have played a role in the evaluation of this duration.
DISCUSSION
Firstly, our results confirm the existence of a causal link between the perceived waiting time and the user’s satisfaction. The more the users estimate the waiting time as short, the more their satisfaction score was high, and Vice Versa. This observation supports the numerous studies in this direction.11,12,14
However, we did not measure significant differences in the perception of time between the three types of progress bars. Therefore, our first hypothesis (H1: the user will have the impression of having waited for a shorter duration in the case of a slow-down bar than in the case of a speed-up one) is not confirmed. Several reasons can be mentioned. First, the selected 10-seconds duration perhaps does not constitute a long enough waiting time. Indeed, being equal to the reasonable level of waiting set by Nielsen11 and Bouch12, it does not cause lack of concentration nor frustration for the user. In addition, the change in the acceleration or deceleration behavior of the progress bar has a less visible impact within a short duration. A study varying the waiting times as Branaghan and Sanchez’s10 would allow to see whether significant differences may appear for longer waiting times.
Secondly, our results also show that the slow-down progress bar is significantly the most appreciated by users (Figure 2). Our second hypothesis H2 on satisfaction (the user will be more satisfied by a slow-down bar than by a speed-up bar) is confirmed. Users seem therefore to truly assess the perception of time at the beginning of the ongoing waiting process, thus responding to a primacy effect.
Figure 2. Graphical Representations of the Three Experimental Progress Bar Behaviors
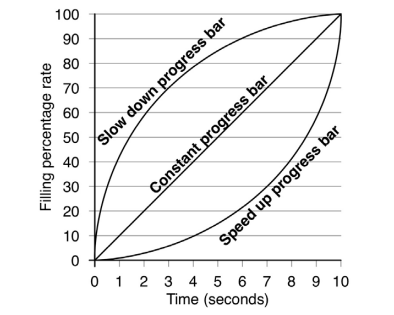
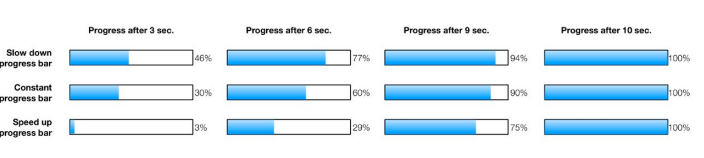
Figure 3. Screenshots of the Three Experimental Progress Bar after 3, 6, 9 and 10 Seconds
These results corroborate the initial intuitions of Kum, Lee, and Yeung,4 who offered to fully reconcile perceptual and memory processes by displaying progress bars with a “fast-slow-fast” behavior, that is to say, that their speed accelerates in the first progression, decelerates in their second, and then accelerate again in their third progression. Having said this, if this paradigm would combine both the positive effects of primacy and recency, it could also focus the users’ attention on the waiting process by giving them the feeling of attending three distinct and successive “events”.10
Regarding waiting time, results show that there are no significant differences between the three type of bars, even though the constant bar was evaluated closer in duration to the real 10-seconds waiting time than the other bars. These results can be explained not only by the difficulty faced by users in assessing the time they waited but also by the nature of the main task. Leclerc, Schmidt , and Dubé6 showed that time evaluation depends largely on the context and characteristics of the situation in which subjects were asked to assess it. If users in the experiment of Leclerc et al6 were placed in conditions where they could win or lose money while they wait (which influenced their perception of passing time), their results showed more generally the importance of context and the nature of the task in perceptual processes.
The knowledge that time evaluation is closer to reality in the case of a constant progress bar, and the confirmation of this trend in subsequent studies, can be explained with the model of the attentional gate of prospective time evaluation.10 Indeed, a constant progress bar would have a relatively neutral effect on both the process of arousal and the attention to temporal signals. As this bar is likely to be consistently interpreted as a single expected event, the internal pacemaker pulses may thus be transmitted to working memory at a rate that is constant and close to the reality.
Note also, for our experiment, the estimated time was always lower by about 1.5 seconds compared to the real waiting time (M=8.57 for the speed-up bar, M=8.76 for the constant bar, M=8.37 for the slow-down bar), which suggests that our context, that is to say, the memorization game, favored a more “optimistic” assessment of waiting time. In contrast to Harrison et al17 who asked each subject to compare two progress bars, we have preferred an experimental design in which each bar was integrated into the context of a primary task, as is often the case in reality. However, it is likely that subjects did not give their full attention to the waiting imposed on them. This finding is consistent with the model of the attentional gate.10 The less attention is paid to cognitive signals, the less temporal impulses reach the memory, giving the user the impression of having waited less than they actually did.
In this regard, some authors18 propose, beyond the improvement of progress bars in themselves, to reflect on how we could help the user make the best use of this waiting time. “Active progress bars” as they describe in their recent study conducted in 2011, provide the user with features enabling one to carry out temporary activities during the wait (e.g. consultation of their calendar or mail, reading their to-do lists or even information on the news or weather). Although careful attention should be paid to the control of actions by the user in this context, we truly believe that such studies open new perspectives in the field of HCI and the design of user experience.
CONCLUSION
Our results show in our context of experimentation that a progress bar with a decelerating filling rate provides greater satisfaction than a constant progress bar or a speed-up bar. As noted above, the findings of this study should first be balanced by the nature of the main task during which the waiting time is imposed. A further study could be conducted to measure the influence of different perceptual contexts. The relatively short and acceptable waiting duration could explain the lack of significant differences observed between our three progress bars regarding the perception of waiting time. In agreement with the cognitive theory of perception’s thresholds, the acceleration and deceleration behaviors of our progress bars may not be sufficiently distinguished when the waiting duration is too short (less than 10 sec.).
Further work may be considered, particularly to clarify the role of the components of the model of the attentional gate, which could support the understanding of the phenomena related to the perception of waiting time in the field of HCI. Thus, beyond varying waiting time duration, different levels of users’ arousal could be introduced as well as the user feedback with information relevant to the ongoing processes (more or less focusing the attention of the user on time signals). In this state of mind, Harrison et al17 conducted a study on animation effects applied to progress bars. They showed for example that progress bars with animated ribbing ─ moving backward in a decelerating manner – have reduced the perceived waiting time by 11% in their sample.
Many perspectives remain to be explored but one can remember that any activity in the field of ergonomics, the design of progress bars and other metaphors of waiting time in HCI, is associated with the object of trade-offs. It is once again the context of use that will be able to determine decisions governing the design in order to ensure the user the best experience of an interactive system.
ACKNOWLEDGMENT
The authors acknowledge and congratulate the students of the “Institut Supérieur Franco-Allemand de Techniques, d’Economie et de Sciences” (ISFATES) who were involved in the experiment: C. Anthony, T. Billet, S. El Hadri, F. Klauss, G. Marillier, N. Mathieu, J. Meiser, A. Nkome, Ndjebayi, S. Piedoux, R. Plasse, A. Tauraatua, A. Tavan, X. Vare, B.A. Yongueng Dihewou, A. Youmsi Waffo, M. Zéler. This paper is dedicated to the memory of Marion Zéler.
CONFLICTS OF INTEREST
The authors declare that they have no conflicts of interest.


