INTRODUCTION
Physical activity is known to exert many positive effects on body composition and therefore it is strongly recommended to children and adolescents. Sports require many physical, technical and mental abilities, and different physical activities may have an important role in body growth, metabolism regulation and bone architecture. In particular, one the most successful measure to prevent osteopenia in old age is building bones as strong as possible during adolescence when bone growth is high. Within competitive sports, studies support the greater beneficial effects on bone mass and bone geometric of disciplines that include impact activities, in which body weight plays a significant role, in comparison to non impact activities, such as swimming. Following regular training, i.e. more than two hours three times a week, a beneficial influence can be observed on the lipid profile, insulin sensitivity, cardiovascular system, muscle, bone mass and density.1,2,3 To our knowledge, however, it is not known which is the most healthiest sport and furthermore how each sport influences the different parameters. On the other hand contact sports which imply tackles such as rugby or hockey expose the athlete to the risk of brain trauma which may cause different hypothalamic and pituitary hormonal deficits.4,5,6 Hypopituitarism following Traumatic Brain Injury (TBI) was described almost one century ago. The most common cause of TBI being motor vehicle accidents falls, child abuse, violence and sports injuries. The association of hypopituitarism due to TBI with the presence of Anti-hypothalamus antibodies (AHA) and Anti-pituitary antibodies (APA) was found after long-term follow up.7,8
The aim of this study was therefore to investigate the effects of four different sports; ski, swimming, rugby and hockey in a group of young athletes training intensively. We evaluated in particular about the lipid profile, insulin sensitivity, bone health and mineralization, the cardiovascular risk factors and the presence of anti-hypothalamus and anti-pituitary antibodies.
STUDY PROTOCOL
We evaluated 80 athletes practicing alpine skiing (#19), ice-hockey (#21), rugby (#20) and swimming (#20) after an appropriate approval by the Ethics Committee of the hospital institutional board was obtained together with an informed written consent from the parents. Mean chronological age was 12.7±0.9, 11.2±0.8, 12.9±0.6 and 12.7±1.03 years respectively. The clinical characteristics of the subjects are reported in Table 1. The children were admitted to the ward in the morning following an overnight fast of more than 11 hours. The auxological data was recorded and a detailed history was obtained concerning the duration (years) and the intensity of training (hours/week). A positive history for migraine was considered as an exclusion factor, because it might influence the evaluation of vascular reactivity,9 however none of the subjects were affected. A blood sample was obtained between 08.30 and 09.00 by venipuncture, for assessment of glucose, insulin, total and HDL cholesterol, triglycerides and Cartilage Oligomeric Matrix Protein (COMP).
Table 1. Clinical data in the four groups of athletes
|
Number
|
Chronological age (years)
|
h-SDS
|
BMI-SDS
|
W/Ht
|
Years of Training
|
hrs/week
|
Fat%
|
Lean%
|
| Ski |
19
|
12.7±0.9§
|
0.8±0.8
|
-0.1±0.7
|
0.4±0.0
|
5.2±2.1
|
7.7±2.2§
|
20.4±5.98
|
76.1±5,74
|
| Hockey |
21
|
11.2±0.8
|
0.6±1.0
|
-0.4±0.7
|
0.4±0.7
|
5.5±1.2
|
5
|
19.9±5.12
|
77.6±4.9
|
| Rugby |
20
|
12.9±0.6ß
|
1.3±0.8
|
-0.2±0.7
|
–
|
5.6±1.0
|
7.3±1.0ß
|
18.3±5.19
|
76.9±6.8
|
| Swimming |
20
|
12.7±1.0&
|
1.1±1.2
|
-0.2±0.6
|
0.4±0.0
|
4.6±1.7
|
8.6±1.8&#
|
18.9±5.06
|
77.7±4.9
|
&=for the differences between swimmers and hockey players
#=for the differences between swimmers and rugby players
§=for the differences between skiers and hockey players
ß=for the differences between rugby players and hockey players
p<0.05 for all differences |
COMP is a glycoprotein found in articular cartilage that helps to stabilize and align type II collagen molecules10 and used as marker of cartilage degeneration.10,11 Serum samples were stored at -80 ºC until being assayed for parathormone (PTH 1–84), 25-hydroxyvitamin D (25OHD), serum carboxyterminal telopeptide of collagen-1 (CTX) as a marker of bone resorption, intact procollagen-1 N-terminal propeptide (P1NP) and Bone-specific alkaline phosphatase (BAP) as markers of bone formation, sclerostin and Dickkopf-1 (DKK1) as inhibitors of Wnt/β-catenin signalling. At the same time also the presence of antibodies against the pituitary and the hypothalamus were assessed.
The endothelial function was evaluated as Flow Mediated Dilation of the brachial artery (FMD) and the Intimamedia thickness (IMT) by B-mode ultrasound at the level of the common carotid artery. On the same day, after blood sample collection, bone health [SOS (Speed-of-sound) and BTT (Bone-transmission-time)] was determined by bone ultrasound, while bone mass and mineralization were assessed by DEXA.
METHODS
For reasons of homogeneity, height and Body Mass Index (BMI) were expressed as Standard Deviation Scores (SDS), according to Cacciari.12 Pubertal status was also recorded according to Tanner.13 Waist circumference was measured midway between the lowest rib and the top of the iliac crest after gentle expiration and the waist to height ratio (WHtR), which is also considered as an index of cardiovascular risk14 was calculated. Insulin sensitivity was evaluated with QUICKI ((Quantitativeinsulin-sensitivity-check-index)=1/[log(I0)+log(G0)], where I0 is the fasting insulin and G0 the fasting glucose.15 Insulin resistance was also calculated with the HOMA-r (Homeostasismodel-assessment-for-insulin-resistance)=(fasting insulin mIU/L X fasting glucose mg/dl) / 405.16 The Atherogenic Index (AI), an index of severe cardiovascular risk, was calculated by the ratio Total/HDL-C.17
Laboratory
Serum glucose was measured with automatic analyzers, using a hexokinase catalyzed-glucose oxidase method. Serum insulin was measured with an immunoradiometric assay (Immulite 2000 Insulin, DPC, LA, CA), with an intra- and inter-assay C.V. of 8.3% and 8.6% respectively. Total and highdensity-lipoprotein cholesterol and triglycerides were measured enzymatically by an automatic photometric method (Olympus Diagnostica Gmbh, Lismeehan, O’Callaghan’s Mills Co. Clare, Ireland). P1NP, PTH, 25OHD, BAP and CTX were measured using the IDS-iSYS Multi Discipline automated analyser (IDS iSYS, Immunodiagnostics System, Boldon, UK). All assays are based on chemiluminescence immunoassay technology except for the spectrophotometric IDS-iSYS Ostase BAP assay. Intraassay Coefficients of variation (CVs) in our laboratory were 3% for P1NP, 8%, for 25OHD, 2% for BAP, 3% for CTX and 4.5% for PTH. Inter-assay CVs were 5% for P1NP, 12% for 25OHD and 7% for BAP, CTX and PTH.
For the detection of serum COMP an ELISA kit was used (EuroDiagnostica Wieslab, Sweden), with an intra-assay CV of 7% and an inter-assay CV of 8%. Serum DKK1 and sclerostin were measured by ELISA (Biomedica Medizinprodukte GmbH and Co. KG, Wien, Austria) with sensitivities of 0.38 pmol/L and 2.6 pmol/L respectively, intra-assay CVs of 8 and 5% and inter-assay CVs of 10 and 4%, respectively.
Anti-pituitary (APA) and anti-hypothalamus antibody (AHA) were evaluated in sera of the athletes and in 20 sex/agematched normal controls. APA and AHA were detected by simple indirect immunofluorescence method on cryostat sections of young baboon pituitary gland and young baboon hypothalamus supplied by Halifax spa (Polverara, Pordenone, Italy) and Biomedis srl (Roma, Italy), respectively, as previously described.18 In particular, Fluorescein isothiocyanate (FITC) conjugated goat antihuman Ig was used to detect the presence of APA and AHA; they were considered positive starting at dilution >1:8.
Endothelial Function and Intima Media Thickness
Endothelial function was assessed in a non-invasive way, by the same operator, using high-resolution ultrasound to measure brachial artery responses to reactive hyperaemia, according to the recently published guidelines.19 The dilatation of the artery caused by the increased blood flow is known as flow-mediated dilatation (FMD). A 12 MHz linear phased array transducer and a high-resolution ultrasonic vessel wall tracking system were used to image the dominant arm brachial artery longitudinally, just above the antecubital fossa. Brachial artery diameter was measured using electronic calipers from the anterior to the posterior m-line at a fixed distance from an anatomic marker. Images were acquired at baseline, during hand hyperaemia, i.e. 90 sec after deflation of a wrist cuff inflated to suprasystolic pressure (at least 50 mm Hg above systolic pressure) for 5 min for measurement of FMD. FMD was calculated as there was as an increase in arterial diameter during hyperaemia compared with the diameter at rest.
IMT was assessed by the same operator, using high resolution-mode real time ultrasound with a 12 MHz linear array transducer. IMT was defined by the lumen-intima and mediaadventitia interfaces of the far wall. Three measurements were taken on each side and the mean of right and left taken as the overall average IMT.
Bone mineralization and body composition were determined by Dual Energy X-ray Absorptiometry (DEXA) (GE-Lunar, Madison, WI, USA). From the whole body scan, fat mass, lean tissue and Bone Mineral Content (BMC) were determined. Bone Mineral Density (BMD) total (BMD tot), BMD at the L2-L4 level (BMD L2-L4) and BMD at the femoral neck (BMD FN) were also calculated.
Quantitative bone ultrasound: The device used (DBM Sonic Bone Profiler, IGEA, Carpi, Italy) is based on the transmission of an ultrasound wave through the distal end of the first phalangeal diaphysis of the last four fingers of the not dominant hand. Two 12 mm diameter transducers on a high precision (0.02 mm) caliper, which measures the distance between the two probes, are positioned on the lateral and medial surface of each finger. The device calculates the Amplitude Dependent Speed of Sound (Ad-SOS, in m/s) through the phalanx by measuring the width of the finger divided by the time of flight, defined as the time from emitted pulse to received signal considering the signal which reaches a predetermined minimum amplitude value (2 mV) for the first time. Moreover, the device calculates the bone transmission time (BTT, in m/s) as the difference between the time when the first peak of the signal received attains its maximum and the time that would be measured if no bone but only soft tissue were present between the transducers. The results were expressed as SDS according to Baroncelli.20 The intra- and inter-coefficient of variation were calculated to be 0.55% and 0.83% for Ad-SoS, and 0.81% and 1.47% for BTT, respectively.20 Quantitative bone ultrasound, which is influenced by bone density, architecture and elasticity has been previously shown to be a non invasive method of estimating bone quality.20,21,22
Health score: In an attempt to summarize in a unique score the results of the different findings we assigned, according to the results of the ANOVA evaluation, a plus or a minus for each parameter resulted significantly positive or negative compared to the other groups. Then an arithmetic sum was calculated and a “health score” was obtained for each group. To our knowledge a similar score has not been previously obtained and therefore there was no data for comparison.
STATISTICAL ANALYSIS
Quantitative data was normally distributed and is expressed as mean±SD. All DEXA measures, which strongly depend from bone size, were corrected by the height of the subjects. Differences among groups were evaluated by ANOVA with the Bonferroni correction as post-hoc test. Simple correlation analysis was used to investigate the association between cardiovascular, bone markers and insulin sensitivity/ resistance with the auxological and clinical parameters and a logistic regression was used to verify differences in anti-pituitary and anti-hypothalamus antibodies among groups. A P value of less than 0.05 indicates statistical significance. The StatView® statistical software (SAS Institute Inc. Cary, NC, 27513, USA) was used for these analyses.
RESULTS
Clinical Data
The groups of hockey players were significantly younger compared to the other groups; they trained less frequently during the week but the duration of training (years) was similar to the other groups. Height SDS, BMI SDS and the WHtR were not different among groups. There was also no difference in body composition among groups (Table 1). Biochemical Data No difference was observed among groups regarding total-cholesterol, HDL-cholesterol and atherogenic index. Rugby players had significantly higher triglycerides serum levels compared to skiers (p<0.05) while swimmers had significantly higher triglycerides (p<0.05) compared to skiers and hockey players. Glucose was mildly more elevated in the rugby players (p<0.05) compared to skiers and swimmers and insulin was significantly higher in swimmers (p<0.05) than in rugby and hockey players. Homa-r and QUICKI were significantly higher and lower respectively in swimmers (p<0.5) compared to the hockey players (Table 2). PTH, 25OHD and Bone Markers These could be evaluated in only three groups. There was no difference in the 25OHD3 and PTH serum levels. Bone neoformation (P1NP) and bone resorbtion (ctx) markers were also similar. Sclerostin was not different while DKK1 was significantly higher in the hockey players (p<0.05) compared to skiers and swimmers. COMB was also similar in the three groups (Table 3). Cardiovascular Function IMT was not different between skiers, hockey players and swimmers, while FMD was significantly higher in hockey (p<0.05) and rugby players (p<0.05) compared to swimmers.
Table 2. Biochemical data in the four groups of athletes.
|
Total Cholesterol (mg/dL)
|
HDL Cholesterol (mg/dL)
|
AI
|
Tryglicerides (mg/dL)
|
Glycaemia (mg/dL)
|
Insulin (µU/ml)
|
HOMA-r
|
QUICKI
|
| Ski |
169±26
|
65±12
|
0.39±0.07
|
53±15
|
76±7
|
9.6±3.4
|
1.8±0.7
|
0.35±0.02
|
| Hockey |
168±30
|
59±15
|
0.35±0.07
|
60±28
|
80±5
|
7.7±3.5
|
1.5±0.7
|
0.37±0.03&
|
| Rugby |
171±16
|
65±12
|
0.38±0.07
|
80±18$
|
83±6$#
|
8.5±4.4
|
2.0±0.1
|
0.35±0.05
|
| Swimming |
179±22
|
64±12
|
0.36±0.06
|
88±42*&
|
76±8
|
12.7±4.3&#
|
2.3±0.7&
|
0.34±0.02
|
*= for the differences between swimmers and skiers
&= for the differences between swimmers and hockey players
$= for the differences between rugby players and skiers
#= for the differences between swimmers and rugby players
p<0.05 for all differences |
Table 3. Bone and cartilage markers
|
25OHD3 ng/ml
|
P1NP ng/ml
|
PTH pg/ml
|
CTX ng/ml
|
DKK1 pmol/L
|
Sclerostin pmol/L
|
COMP µg/ml
|
| Ski |
33±6.67
|
792.95±283.92
|
28.35±15.71
|
0.57±0.37
|
26.75±9.84
|
39.31±26.89
|
1.88±0.45
|
| Hockey |
30.79±11.67
|
828.16±290.47
|
25.38±15.14
|
0.51±0.32
|
33.36±6.36&§
|
40.79±11.10
|
1.95±0.39
|
| Rugby |
–
|
–
|
–
|
–
|
–
|
–
|
–
|
| Swimming |
35.88±9.63
|
692.12±433.07
|
18.05±7.40
|
0.57±0.36
|
25.35±7.06
|
45.68±75.18
|
1.72±0.40
|
&= for the differences between swimmers and hockey players
§= for the differences between skiers and hockey players
p<0.05 for all differences |
Bone Assessment
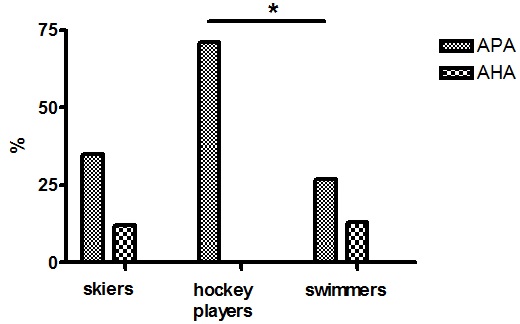
Total bone area was significantly smaller in the group of hockey players (p<0.05) compared to swimmers and rugby players. However, this parameter strongly depends from the size of the subject and even if we tried to normalize the data for the height of the subjects, we think that the younger age and the pubertal status of the hockey players might have played a role. The same was found also for the spine area (p<0.05) and the leg area (p<0.05). On the contrary, total BMD and leg BMD were not different among groups but spine BMD was again lower in the hockey player (p<0.05), reflecting a reduced size. Bone quality, evaluate as BTT, which is a more reliable parameter since it is independent from the soft tissue surrounding the bone and the size of the bone, could be assessed in the skiers and hockey players only; it was significantly better in the formers (p<0.05) (Table 4). Anti-pituitary and Anti-hypothalamus Antibody As can be seen in Figure 1 no difference was found among skiers, hockey players and swimmers regarding the anti-hypothalamus antibody while anti-pituitary antibody were found significantly more frequent in the hockey players than in swimmers (p<0.05).
Table 4. Vascular structure and function, bone mineralization and bone quality in the four groups of athletes
|
IMT mm
|
FMD
%
|
Area
tot/h
|
BMD
tot/h
|
Spine
area/h
|
Spine
BMD/h
|
Leg
area/h
|
BMD
leg/h
|
SOS
SDS
|
BTT
SDS
|
| Ski |
0.48±0.12
|
13.63±3.5
|
11.38±1.01§
|
0.01±0
|
0.57±0.06§
|
0.03±0.01§
|
2.15±0.19§
|
0.01±0
|
1.14±1.02
|
0.55±0.85§
|
| Hockey |
0.48±0.05
|
15.35±4.91&
|
9.97±0.82
|
0.01±0
|
0.48±0.06
|
0.02±0.01
|
1.76±0.28
|
0.01±0
|
0.63±0.89
|
-0.28±0.60
|
| Rugby |
–
|
14.44±2.19#
|
10.95±0.99ß
|
0.01±0
|
0.54±0.05ß
|
–
|
2.01±0.31ß
|
0.01±0
|
–
|
–
|
| Swimming |
0.45±0.05
|
11.24±2.47
|
10.80±0.96&
|
0.01±0
|
0.53±0.09
|
0.03±0.01&
|
1.99±0.21&
|
0.01±0
|
–
|
–
|
&= for the differences between swimmers and hockey players
#= for the differences between swimmers and rugby players
§= for the differences between skiers and hockey players
ß= for the differences between rugby players and hockey players
p<0.05 for all differences |
Figure 1. Anti-pituitary (APA) and anti-hypothalamus antibody (AHA) in the three groups of athletes
Health Score
Alpine skiers seem to perform better in particular because of the positive effect on bone status and cardiovascular function.
Correlations
A significant positive correlation was found between the intensity of training (hrs/week) with BTT (r=0.37; p<0.05), percentage of lean mass with SOS (r=0.45; p<0.001) and percentage of fat with SOS (r= -0.47; p<0.001) and BTT (r= -0.32; p<0.05) (Figure 1).
DISCUSSION
The aim of this study was to verify the influence of 4 different sports on several parameters including anthropometric measurements, biochemical indices, bone metabolism, mineralization and bone quality, cardiovascular function and the presence of anti-pituitary and anti-hypothalamus antibody. Altogether we found several differences between groups; however we could not identify a unifying trend which would identify the healthiest sports.
As to the specific findings, no difference was found in auxological parameters and body composition, while some dissimilarity were present in the lipid profile and in the glucose metabolism, swimmers showing in particular, significantly decreased insulin sensitivity. Bone markers were also not different, apart from DKK1 which was more elevated in the hockey players. An increased DDK1, which negatively influences bone metabolism by inhibiting the Wnt/β-catenin signaling, might underpin the less favorable ultrasound finding in the hockey players.
As to the vascular function, hockey and rugby players showed a greater FMD compared to swimmers, suggesting that in our athletes a combination of aerobic and resistance training results in an even better endothelial function than with aerobic activity only.
Bone mass and mineralization was significantly lower in hockey player compared to the other groups, even after correction for the height of the subjects. This sounds quite unexpected, however we think that the results are biased by the fact that these athletes were younger in comparison with the other and therefore differences in the pubertal status surely have played a role. It is well known in fact that testosterone stimulates bone expansion together with growth hormone leading eventually to an increased bone size. Nevertheless BTT, which reflects bone quality and which is independent from bone size, was also significantly reduced compared to skiers.
Athletes are more likely to sustain joint injuries compared with the average individual. Such joint injuries may cause joint instability and degeneration of the articular cartilage.20,23 We wondered therefore whether an initial derangement of the cartilage might be detected already at this early age by a serum marker. We evaluated COMP therefore. When articular cartilage is broken down, COMP is released into the circulation, which makes it a useful marker of cartilage degeneration.10,11 Circulating levels of COMP are elevated in patients with radiographically apparent OA and increase as the OA burden increases.18,24 COMP was also shown useful in evaluation and monitoring the impact of joint tissue damage as joint bleed,25 as femoroacetabular impingement in athletes.26
In this study work we could not find any differences among groups in serum COMP. In particular, we did not find any differences, even between skiers, hockey and rugby players, who frequently suffer from knee injuries, and swimmers, who never have physical contact and furthermore exercise in absence of gravity. However there are several limitations to the COMP evaluation in current study. No specific reference values for COMP are available for younger subject, so we can only compare different populations. We evaluated only a single time point in our subjects and did not assess whether COMP levels change over time or immediately after a single sport event. Finally a limitation in the use of any circulating biomarker of cartilage breakdown is the inability to identify specific joints where they originated.
At the end, we tried to evaluate cumulatively the results for each sport creating a health score. As reported in Table 5, it seems that ski should be considered the healthiest sport, mostly due to its positive effects on lipid profile and bone status.
Table 5. Health score. A plus is assigned for every parameters positively different from the other groups and a minus when negatively different (ANOVA+Bonferroni)
|
Ski
|
Hockey
|
Rugby
|
Swimming
|
| Auxology |
0
|
0
|
0
|
0
|
| Lipid profile |
+
|
+
|
–
|
–
|
| Glucose homeostasis |
0
|
+ + +
|
– +
|
– – –
|
| Bone metabolism |
+
|
–
|
0
|
+
|
| Bone mineralization |
+
|
–
|
0
|
+
|
| Bone quality |
+
|
–
|
0
|
0
|
| Cardiovascular function |
0
|
+
|
+
|
–
|
| Anti pituitary/hypothalamus Abs |
0
|
–
|
0
|
+
|
| Total score |
+4
|
+1
|
0
|
-2
|
| The total score represents the arithmetic sum of the single points. |
One of the most interesting finding of the study however is the high level of anti-pituitary antibodies in the groups of hockey players who obviously are more at risk for chronic repetitive head trauma. No difference was found instead regarding the anti-hypothalamus antibodies. These findings are strongly in agreement with those of a recently published paper reporting, in a five years prospective investigation, a significant increase of anti-pituitary antibodies even after mild brain trauma.8 The appearance of these antibodies has been suggested to be the consequence of the head trauma triggering an ongoing cascade of vascular and histopathological alterations involving mediators of inflammatory process, thus favoring the immune system activation which can contribute to late pituitary dysfunction.7,8 The presence of these antibodies is in fact considered a reliable prognostic factor for future pituitary dysfunction even in subjects with mild brain trauma;8 these antibodies therefore might identify those athletes at risk of developing pituitary dysfunction in the future. The evaluation of the pituitary function was out of the scope of the study and therefore we have no data concerning this point. Our athletes were actually in optimal physical condition, having passed through a regular medical investigation in order to obtain the license to compete, however we cannot exclude that in the future they might suffer from some endocrine disorder. It is our intention therefore to follow them up regularly in order to detect promptly any abnormalities.
CONFLICTS OF INTEREST
The authors have no conflicts of interest to disclose.
ACKNOWLEDGMENT
We are indebted with Dr. Antonio Fanolla for his help in the statistical analysis and we thank Caterina Fraccarollo for the biochemical assays.


