INTRODUCTION
Cake is one of the most popular food items to be eaten all over the world. Cake is available in various sizes, shapes, and categories. The ingredients such as flour, sugar, eggs, oil, leavening agents and conditions employed for cake preparation during mixing and baking are generally responsible for its quality. Besides cake color and aroma contribution, eggs also give soft texture and provide moistness to the final product because of its better foaming, gelation and emulsifying properties.1
Yellow layer cake and Madeira-type are examples of cakes containing fats; the egg proteins, specially lipoproteins, help to emulsify fats during the mixing stage of ingredients. In sponge cakes or angel food (fats-free cakes), aerations help in an entrapping of large air quantity and gelation/coagulation functions are done by egg protein during preparation.1
An egg has an important role in the formation and maintenance of foam in the batter because it incorporates air in the batter during mixing and helps in gel formation, which is important to provide specific volume, texture qualities, and flavor.2 Egg white protein also gives good emulsification, elasticity, stabilizing and many other properties.3
The demand of eggless cake has increased due to egg allergy in people, heart diseases, vegetarians increasing ratio, eggs high price, religious reasons or personal lifestyle, and cold weather limitation in some countries. As a result, many studies suggested protein from different sources including soya protein,4 whey proteins5 and pea protein,6 have the potential to substitute egg. Arozarena et al7 used lupine protein and baking additives (xanthan gum, soya lecithin baking powder, mono, and diglycerides,) to find the possibility of eggless cake production, while Hussain et al8 investigated the possibility of whey protein concentrate and lupine proteins in the cake recipe to substitute egg. A big difference was found between the control and the egg substituted cake volume. Lupine protein isolate and its flour partial substitution were investigated by Salem et al.9 The report revealed that the cake prepared by substituting 25% eggs with 5% lupine flour or 2% protein isolate has high acceptability. Furthermore, the use of whey protein for making angel food cake comparing to egg white, the foams showed that the whey protein used as an egg substitute in angel food cake batter might result in a low volume and coarse structure cake.10 Whey protein isolate (WPI) cake batters showed lack of stability during the transformation stage from a wet foam to dry form, but large bubbles were even observed at 22 °C (i.e., before heating). While egg white foam cake batter showed stable foaming property when the temperature rises from 25 to 85 °C.11 Though, partial or total replacement of egg can produce undesirable changes related to cake texture, volume, and flavor.
To achieve a desirable quality, significant modifications in the recipe, i.e., use of protein from various sources or some additives, are required. Regarding this study, bovine blood plasma gave a satisfactory result when used to replace egg white or whole egg at different levels.12 Currently, some eggless cake with similar physical properties to the cake which contain eggs has been developed, which recommends that mostly multi-components are egg substitutes. Thus protein application in combination with emulsifiers and hydrocolloids is better to use for developing egg substitutes. Furthermore, by using plant protein and emulsifiers can give extra nutrients and enhance nutrient supply to the consumers.13 Several additives like guargum, arabicgum, xanthangum, hydroxyl propyl methyl cellulose, carrageenan, in combination with sodium stearoyl-2-lactylate (SSL), and glycerol monostearate (GMS) were used by Ashwini et al14 to describe their effect on the microstructural, rheological, and quality features of eggless cakes.
Hydroxy propyl methyl cellulose (HPMC) showed the best emulsion results among all the emulsifiers when it is added to prepare better quality eggless cakes whether alone or in combination with SSL and GMS. This project aims to use animal-based proteins and additives to develop egg substitutes for cakes preparation. To achieve this goal fish protein concentrate (FPC) was used in combination with additives and its properties were compared with batter and cake prepared with egg protein. For this purpose, we used fish protein isolate (FPI) together with additives. The properties of these ingredients were evaluated and compared with egg proteins by measuring the batter and cake properties.
MATERIALS AND METHODS
Ingredients
Grass carp fish of about 40 cm length and 4 kg weight, sugar, flour, vegetable oil, baking soda, and baking powder were bought from the local market in Wuxi, Jiangsu, China, while vanilla essence, HPMC and GMS were obtained from Jiangnan University Food Science Laboratory.
Fish Sample Collection and Preparation of FPC
Grass carp fish was brought in an ice-filled insulated box to the laboratory. The fish was immediately gutted, headed, deboned and skinned on arrival to obtain fillets. The grass carp fish fillets (GCFF) were washed using tap water, weight, and cooked for an hour in boiling water according to the described procedure by Goes et al.15 The slurry was poured-off and the solid mass was pressed to squeeze out the remaining water by a muslin cloth. The solid mass was then put at 65 °C for 24-hours in hot air oven (Airblast dryer, Box Model: DHG-9070A, Shanghai, China) for drying. The dried mass was ground in kitchen blinder for 4-minutes to make it powder and then sieved to remove the big particle with 0.4 mm mesh size. The protein powder concentrate was then put at 4 °C in plastic bags until further use and analysis.
Preparation of Emulsifier Gel
Hydroxy propyl methyl cellulose (an emulsifier) and water were used at the ratio of 1:4 for gel preparation. A dispersion was made first, and then the temperature of dispersion was raised to 65 °C under continuous agitation for GMS. The gel was obtained on cooling. For each experiment, 0.5% of the emulsifier gel was added based on wheat flour value.
Preparation of Batter and Baking
The standard recipe of cake proposed by Ratnayake et al5 with a slight modification was used for eggless cake preparation. The traditional cake formula contains flour (27.88%), sugar (32.26%), milk (16.73%), eggs (13.93%), oil (8.36%) and baking powder (0.84%), while in eggless cake recipe FPC (5%, 8%, 12%)and other additives were used to replace eggs. Mostly the dry ingredients used in cake preparation such as FPC, wheat flour, baking soda, and baking powder were thoroughly mixed while, the sugar, milk, vegetable oil, and vanilla essence were whipped in an electric kitchen mixer (25 °C) for 4-minutes to make it cream for mixing dry ingredients. The dry ingredients were added to the cream gradually under continuous mixing to avoid the formation of lumps. Finally, the prepared batter was put in 4 ceramic cake moulds (3 cm height×6.5 cm) size and baked at 170 °C for 30-minutes. The cakes were removed from moulds after baking and put at room temperature for 1-hour for cooling. Then wrapped in a transparent plastic bag to avoid moisture loss and store for 24-hours at room temperature for further analysis. All kinds of batters were prepared to make at least 3 sets of cakes. Whenever HPMC was included in cake formulation, it could be put in fats-sugar mixing or flour addition step and its concentration was 0.5% based on wheat flour. The formulations and materials of the eggless (FPC) and control cakes (C.C) are given in Table 1).
| Table 1. The Formulations for Control and Eggless Cakes |
|
Ingredients
|
Batter Composition in Percentage (%) |
| Control |
5% FPC |
8% FPC |
12% FPC
|
|
Wheat flour
|
30 |
30 |
27 |
23
|
|
Sugar
|
30 |
30 |
30 |
30 |
| Milk |
16.73 |
16.73 |
16.73 |
16.73
|
|
Oil
|
8.4 |
8.4 |
8.4 |
8.4 |
| Egg |
13.93 |
0 |
0 |
0
|
|
FPC
|
0 |
5 |
2 |
12 |
| Water |
0 |
6.88 |
6.88 |
6.88
|
|
Baking soda
|
0.84 |
0.84 |
0.84 |
0.84 |
| Essence |
0 |
0.5 |
0.5 |
0.5
|
Determination of Cake Batter Properties
Batter specific gravity: The specific gravity of the eggless cake batter was determined by dividing the weight of a certain volume of batter by the same volume of distilled water.16
Batter viscosity: The eggless cake batter viscosity was determined by using an NJD-5S viscometer (Model NJD-S5, S/N:LD15010057, Shanghai Weichuan, China), according to Kim et al17 with slight modifications. A 100 ml beaker was filled with batter to the edges and the spindle speed was set at 6 rpm, spindle no. 4 was used to perform all the experiments at room temperature of about 25 °C.
Proximate Composition Analyses
Proximate composition analyses of wheat flour (WF), grass carp protein concentrate (FPC), whole grass carp fish (WGF), and FPC supplemented cakes formulations were carried out. Moisture content, crude protein, and ash were determined by following Honikel et al18 methods. To convert the total nitrogen to total protein, the nitrogen converting factor 5.7 was used for wheat flour while 6.25 for the rest of the samples. Lipids were determined by Bligh and Dyer,19 with the use of a Soxhlet extractor (Hua ye, SZC101, Shanghai, China). The difference between 100% and the sum of protein, lipids, ash, and moisture content is used to estimate the carbohydrate amount. The caloric content of the cake samples were calculated according to the National Research Council (NRC)20 using the equation below.
Energy Value (Kcal/100g)=4×protein(%)+9×lipid(%)+4×carbohydrate(%)
Measurement of Physical and Sensory Characteristics of Eggless Cake
Baking Loss: The baking (%) loss was determined by using the equation below
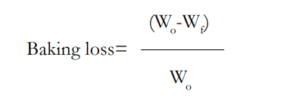
Where Wo is the weight of cake batter transferred in to each cake mould and Wf is the weight of baked cake after 30-minutes cooling at room temperature.
Eggless cake volume: The cake volume was found out by Stable Micro System Volscan profiler (Model Volscan 300, serial No VSP 3000249). The door of the scanner was open, and the arm was moved up to allow the space for the sample. The cake samples of different formulation were then put on the spikes on the base to support it and run the machine that gave us values.
Color analysis: The color of three different formulations cakes were determined by using Ultra Scan PRO (Hunter Lab, Reston, VA, USA). During tests, each cake sample was held in a clear polyethylene transparent bag. Then the white and black tile of Hunter Lab color standards were used for equipment standardization, and the lightness (L*), redness (a*) and yellowness (b*) of every individual sample was evaluated.
Eggless cake texture: The Brook field texture analyzer (Model CT310K, S/N 8563277, USA) was used to determine the texture (Hardness, cohesiveness, chewiness, gumminess, elasticity) of FPC supplemented cakes. The samples were put on the probe, set all the parameters, and run the machine which gave us the values. All the experiments were performed three times, and results were expressed as mean±SD values.
Sensory analysis: Sensory analysis was performed to find out the consumer acceptability. An untrained 36 panelists were randomly selected (20 males and 16 females) of age between 20-35 and asked them to give their scores on the FPC supplemented cakes appearance, texture, flavor, color, and overall acceptability.
Drinking water is given to the panelists to wash their mouths after testing each cake. They gave their score on the 9-point Hedonic scale base. The 9 points show “extremely like” while 1 point to “extremely dislike”.
Statistical Analysis
Triplicate results obtained for every parameter analysis (except for sensory analyses) of each sample were used for statistical analysis. Means were compared by Duncan’s test for significant differences using one-way analysis of variance (ANOVA) at a level of significance 0.05, using the statistical package for Social Sciences Software, IBM SPSS Statistics 20.0 for Windows (SPSS, Inc., Chicago, IL, USA). Results are presented as “mean±standard deviation (SD).”
RESULTS AND DISCUSSION
Chemical Composition and Quality Criteria of Produced Cakes
FPC obtained through the drying process has an exceptionally low moisture content of (4.13%), which is extremely low as compared to that of GCFF (76.83%). Moreover, drying method also increase the concentration of fats (4.89%), protein (85.99%) and ash (3.90%) content of FPC quite significantly as compared to GCFF (Table 2), similarly drying process followed by Wu et al21 showed the same increasing patterned of grass carp proximate composition. His report showed protein (69.5%), fats (5.13%), and ash (1.5%) while the moisture content decreased the same as our report. The variation in the values reported in the present study and figures presented by Wu et al21 may be due to applying different drying methods and the techniques used for analysis. Likewise, the fish protein nutrients concentration was also reported by Abraha et al.22 Wheat flour proximate composition was found to be quite lower as compared to FPC and GCFF, but high in carbohydrate (74.21%) and moisture (12.25%) contents.
| Table 2. Proximate Composition of WF, GCFF, FPC, and FPC Supplemented Cakes |
|
Ingredients
|
Parameters |
| Moisture (%) |
Protein (%) |
Fat (%) |
Ash (%)
|
Carbohydrates (%)
|
Energy (kcal/100 g)
|
|
WF
|
12.25±0.173d |
12.33±0.116d |
0.71±0.019f |
0.49±0.003f
|
74.21±0.185e |
352.58±0.797d
|
|
GCFF
|
76.83±0.114a |
18.97±0.280b |
1.91±0.058e |
1.17±0.021e |
|
|
| FPC |
4.13±0.111e |
85.99±0.565a |
4.89±0.083d |
3.9±0.028a
|
|
|
|
Control Cake
|
21.01±1.283b |
6.71±0.463f |
12.13±1.108a |
1.21±0.006d |
58.94±0.715c |
371.82±1.485a |
| 5% FPC |
18.91±0.062c |
9.1±0.182e |
10.39±0.401c |
1.22±0.013d
|
60.37±0.438e |
371.41±1.819a
|
|
8% FPC
|
18.4±0.261c |
12.37±0.307d |
11.1±0.011b |
1.29±0.017c |
56.84±0.211b |
376.73±0.954b |
| 12% FPC |
18.16±1.347c |
16.75±0.220c |
12.3±0.096a |
1.35±0.003b
|
51.44±1.553a
|
383.48±5.3062c
|
| Values reported are “mean±SD”; values followed by different superscript letters in the same column are significantly different at p≤0.05. |
A report on the composition of wheat flour by Wu et al23 on a variety of commercial wheat flour having 13.5% moisture content showed that starch is found in the highest quantity, making up 63.7-80.7% of the total mass. While proteins range from 9.6-19.4% and ash 0.4-0.8%, according to the same report. In the present study, the protein, fats, and ash composition of WF reported is 12.33%, 0.71% and 0.49 respectively. Abraha et al22 also displayed a similar result on the composition of wheat flour as 12.47% protein, 0.75% fat and 0.49% ash to the present study. However, the deviation in the values may be raised due to raw material differences. The proximate composition of egg cake (control) and cakes fortified with 5%, 8%, and 12% FPC are also given in Table 2. The cake fortified with FPC reveals an increase in protein (9.10-16.75%), fat (10.39-12.30%), and ash (1.22-1.35%) contents which promote the nutritional value of the cake, that is quite different from the figures obtained from control cake samples 6.71%, 12.13%, and 1.21% respectively. A significant difference in protein content between control and cake fortified with FPC was observed. Desai et al,24 reported in his findings on salmon powder range of 0% to 20% by fortifying pasta, that also showed an increase in proximate chemical composition, protein (12.60-22.70%), fats (1.15-9.16%) and ash (0.60-1.22%). A complex interaction between protein and starch molecules in WF has been promoted by the supplemented FPC as proposed by Desai et al24 and Zhang et al25 cause a low free water network. The cake fortified with pea protein isolate presented by Lin et al,26 also show dececrease in moisture content with the increase of protein content related to the current study, While many authors presented the increasing proximate composition except for carbohydrates in many cereal products fortified with a variety of proteins.22,27,28
Effects of Different FPC on the Viscosity, Specific Gravity and pH of Batters
Specific gravity measures and gives an idea of the total air holding capacity. It is inversely proportional to air holding capacity i.e. high values indicate less air incorporation into the batter and vice versa. The control batter specific gravity was 0.9463, which is followed by 5% FPC incorporation, which is slightly higher (0.9619). When the liquid egg was replaced by 12% FPC, it gave the highest specific gravity value (1.0073) which indicates a heavier batter that lacks proper aeration. Preparing a batter entrapping a large number of air bubbles is desirable for a better cake structure. The first stage of cake preparation produced air bubbles, i.e. mixing of ingredients to obtain a properly aerated dispersion system where water constituting the continuous phase in which the flour and the fats are dispersed. The entrapped bubbles start to act as nuclei then it enters into the water phase where they get bigger size due to the gas generated by leavening action of the baking powder and increase the vapor pressure with the temperature inside the trapped bubbles.
According to Paraskevopoulou et al2 all the air is held in the fats phase at the initial stage of cake preparation. The subsequent bubble stabilization and air entrapment against coalescence, disproportionation and drainage functions mostly executed by the egg white proteins, while contributing in foaming and aeration (low-density lipovitellenins) as well the retention of trapped air the system is the function performed by egg yolk protein.2
The present report shows as the quantity of FPC was increased (5%, 8%, 12%), the eggless cake batter specific gravity of was also increased (0.9619, 0.9672, 1.0073), respectively, the increase in 12% FPC is obvious compared to control cake batter. A report on egg replaced by soybean protein isolate (SPI)29 WPI2 report in cake formulation showed the same decreasing order of specific gravity. The dependence of volume on the amount of air incorporated while mixing was noticed as expected (Table 3) i.e. the higher the specific gravity, the lower will be cake volume. After the control cake (94.986 ml) the higher volume was noticed in the cake supplemented with 5% GCPC (91.186 ml), while cake containing 12% protein concentrate showed lower figures regarding volume. While batter specific gravity, bubble distribution, and some other properties which affect the movement and incorporation of air can be described by batter viscosity.30 It is important to measure because it holds the incorporated air in cake batter which in turn increases the cake volume. Hydrocolloids reduce the gas diffusion rate and retain it during the early backing stage due to its batter viscosity increasing property that affects the final cake volume.31 Control cake batter viscosity was more than eggless cake batter having FPC. When the quantity of FPC was increased (5%, 8%, 12%) the viscosity started falling (106.415, 106.3519, 106.004%) respectively, which is comparatively less than control cake batter (106.712%).
A report on the replacement of egg with soya bean protein isolate29 in yellow cake shows the same decreasing result in viscosity to the present study. Regarding baking losses, the FPC replacement with egg in pound cakes has affected water retention ability (Table 3). The baking loss of control cake (12.37) was quite higher compared to loss (10.28%) of cake having 5% FPC. The baking loss increased from (10.28-11.13) as the percentage of FPC to replace egg increased (5% to 12%). However, baking loss of 8% and 12% supplemented cake was 11.03% and 11.135% respectively which is not a significant difference. The higher foaming capacity of FPC can explain the increase in baking loss in the case of eggless cake.32 A variety of material like extra virgin olive oil with margarine,33 soya protein isolate (SPI),29 WPI2 were used to replace egg but they show reverse data regarding to the present study. This could be due to the different nature and functional properties.
| Table 3. Eggless Cakes and Batter Physical Characteristics |
|
Ingredients
|
Parameters |
| Viscosity (mpa.s) |
Specific Gravity |
Volume (ml)
|
Baking Loss (%w/w)
|
pH
|
|
Control Cake
|
106.712±0.016 a |
0.9463±0.003 c |
94.986±0.469a |
12.37±0.297a |
7.8±0.03±0.035a |
| 5% FPC |
106.415±0.011 ab |
0.9619±0.004 b |
91.186±1.561b |
10.28±0.122c
|
7.23±0.02±0.032d |
|
8% FPC
|
106.351±0.012 ab |
0.9672±0.002b |
89.644±0.927b |
11.03±0.210b |
7.51±0.02±0.050c |
| 12% FPC |
106.004±0.657b |
1.0073±0.013a |
84.9±1.297c |
11.13±0.137b
|
7.63±0.04±0.040b |
| Values reported are “mean±SD”; values followed by different superscript letters in the same column are significantly different at p≤0.05. |
For fish freshness, pH is an important factor. The control cake batter pH was found to be 7.8 and supplemented cakebatter with 5%, 8%, and 8% FPC was 7.23, 7.91 and 7.63, respectively. Shaviklo et al34 stated that fish powder with neutral pH could be obtained from fresh fish, but it impossible to prepare fish protein powder from fresh meat with ideal alkaline or acidic pH functionality.
Texture Analysis
The effect of FPC on hardness, springiness, cohesiveness, and chewiness of egg replaced cake is reported in (Table 4). The hardness of all FPC supplemented cakes is much higher than the control one, but maximum hardness value was shown by cake having only 5% FPC. An increase of FPC concentration also increases hardness, as the concentration increase to 8% and 12% the hardness increased to (3835) and (4337) respectively, thus the level depends on protein content. The air cell surrounding the crumb wall and protein particles that strengthen the crumb is probably the reason for its hardness. This report supports the result presented by Gómez et al,35 who noticed that the initial firmness in cake is increased by the incorporation of chickpea flour. An increase in sponge cake firmness was also encountered in Majzoobi et al36 study. The crumb firmness is influenced by starch gel, so it was assumed that the fish protein water binding activity reduced free water, decreased amylase content and increased the cake softness.37 The textural profile showed that the cakes replaced with 12% protein concentrate exhibited the lowest cohesiveness of (0.44) and elasticity 4.34 compared to the control (0.61 and 4.48) respectively. While the addition of 5% and 8% FPC does not bring a significant variation in values especially in elasticity. In general, both parameters give the cake structure resistance against compression, show the internal bonding development in a three-dimensional protein network, and completely related with consumer acceptance. Mostly no big difference was found in elasticity and cohesiveness of any cake with the addition of lower FPC concentration, but a significant change was noticed as the quantity of FPC was increased to 12%. Moreover, FPC supplemented cake show higher gumminess and chewiness values compared to whole egg cake, as the concentration of FPC concentrate increased from (5-12%) the gumminess (1839-2052) and chewiness increased from (69.7-82.3) compared to the control (1249 and 54.93) respectively, but 12% FPC supplementation showed more prominent difference. When the level of protein concentrate in the cakes was decreased, the gumminess and chewiness values were also decreased significantly but did not concide to the values shown by control cake. These both values follow hardness tendency because of being dependent on hardness.
| Table 4. The Texture of Eggless Cake Containing Different Concentrations of FPC |
|
Sample
|
Parameters |
| Hardness |
Cohesiveness |
Elasticity |
Gumminess
|
Chewiness
|
|
Control Cake
|
2036±0.169c |
0.61±0.006a |
4.48±0.064a |
1249±0.991d
|
54.93±0.303c |
| 5% FPC |
5186±0.841a |
0.52±0.010b |
4.48±0.104a |
1839±0.530c
|
69.7±0.856c
|
|
8% FPC
|
3885±0.569b |
0.52±0.032b |
4.35±0.057 a |
1978±0.490b |
80.8±0.163b |
| 12% FPC |
4337±0.190b |
0.44±0.032c |
4.34±0.097 a |
2052±0.454a
|
82.3±0.161a
|
| Values reported are “mean±SD”; values followed by different superscript letters in the same column are significantly different at p≤0.05. |
Color Analysis
Color attributes of a food product are investigated as one of the most important criteria which affect the over all quality and consumer acceptability. Color assessment for control and FPC fortified cake were accomplished by UltraScan PRO. The L*, a*, and b* values were observed in the evaluation of the prepared cakes and are given in Table 5. The cake fortified with 5% protein powder showed maximum brightness (L*). The brightness (L*) of the cakes were decreased with the increase of protein powder concentration but the redness (a*) and yellowness (b*) were increased. Our findings reveal that the maximum brightness (L*) was noticed in cake fortified with 5% and 8% FPC respectively. Thus, the FPC substitution levels affected the color of the finished product.
| Table 5. Color Analysis of FPC Supplemented Cakes |
|
Sample
|
Parameters |
| L* |
a* |
b*
|
|
Control Cake
|
61.84±0.995b |
10.57±0.316b |
28.2±1.065c |
| 5% FPC |
59.56±0.658a |
10.85±0.135b |
29.23±0.322bc
|
|
8% FPC
|
59.24±0.730a |
11.62±0.329ab |
30.51±0.122ab |
| 12% FPC |
57.15±1.186a |
12.75±0.461a |
31.24±0.837a
|
Cake fortified with 12% of FPC reduces the color attributes but, at the same time, enhances the redness and yellowness characteristics of cakes.The findings of this study are in accordance with Mamat et al.38Another study also reveals that the increasing tapioca flour and fish meat ratio reduce the brightness, while redness and yellowness tend to increase with the low-level of fish meat.39 Similarly Martin et al40 observed a significant reduction in brightness (L*), where an increase was observed in redness (a*) and yellowness (b*) by increasing protein level in prepared cake, with accordance to the present findings.
Sensory Analysis
Sensory evaluations of cake were done in order to asses and determined the acceptability of different mixed ratio cake by consumers. The control and fortified cake with (5%, 8%, and 12%) of FPC were evaluated for organoleptic attributes such as appearance, texture, color, taste, flavor, and overall acceptability by a panel of 36 judges. The mean score of control and fortified samples were given in (Table 6). The panelists were asked to rank the produced samples of cake for their liking by using a descriptive analysis of 9 points hedonic scale. No significant differences were observed by panelists between control and FPC fortified samples except sample fortified with 12% of FPC. However, 8% of FPC fortified cakes obtained the highest mean score for the most liked amongst all the treatments and have the maximum overall acceptability. Cakes prepared with 8% FPC got the best results for all sensory attributes, as noticed in (Table 6).
| Table 6. Sensory Analysis of Control and FPS Supplemented Cakes |
|
Sample
|
Parameters |
| Appearance |
Colour |
Texture |
Flavor |
Taste |
Overall Acceptability
|
|
Control Cake
|
7.63b |
7.29bc |
7.43bc |
6.86 |
6.58bc |
7.158bc |
| 5% FPC |
7.49a |
7.17b |
7.32b |
6.74b |
6.41b
|
7.027b
|
|
8% FPC
|
7.54ab |
7.21b |
7.48c |
6.79bc |
6.52bc |
7.108bc |
| 12% FPC |
6.81c |
6.93a |
7.03a |
6.19a |
5.81a |
6.554a
|
| Values reported are “mean±SD”; values followed by different superscript letters in the same column are significantly different at p≤0.05. |
Cakes prepared with 12% FPC content were detected to be the least acceptable formulation despite the fact of the highest nutritional content. The slightly darker color, hard texture, and fish flavor were most likely could be the reason to get a low score. Thus, the result suggests that the incorporation of 8% FPC is best for enhancing the nutritional quality of the cake without affecting the organoleptic evaluation of the cake.
CONCLUSION
The outcomes of this study suggested that the FPC supplementation increased the nutritional properties of cake. FPC enhanced the nutritious properties of cake, in terms of protein, fat, and ash contents. Moreover, the fortification of FPC at 12% protein content reduced sensory quality attributes and overall acceptability. This study also says that more than 8% of FPC fortification could affect dough rheological properties and sensory attributes of the cake. It is apparent that the fortification of protein content up to 8% in cakes will not affect the individual as well as the overall acceptability sense of the consumers and increase its nutritional value. Furthermore, this study conclusively provides significant information regarding effective fish utilization and malnutrition problems.
ACKNOWLEDGMENTS
This research was financially supported by the Ear Marked Fund for China Agriculture Research System (CARS-45), and Collaborative innovation center of food safety and quality control. IN Jiangsu province and 2014GB2C100297, and national firstclass discipline program of Food Science and Technology (JUFSTR20180201).
ETHICAL STATEMENT
The sensory analysis was performed by 36 panelists (20 male and 16 female). Among 36 panelists 29 members approved the product.
CONFLICTS OF INTEREST
The authors declare that they have no conflicts of interest.


