INTRODUCTION
Rational
The COVID-19 virus with a rapid human-to-human transmission makes patients experience a variety of symptoms and causes a significant risk to patients who are suffering from weak immune systems.1,2 In this case, the elderly people or those who are suffering from underlying diseases may experience more severely symptoms than the others3 followed by receiving particular healthcare at the intensive care unit (ICU).4 This situation leads health authorities to manage medical operations, according to a rough estimation of admitted patients’ mortality rate. There is a specific statistical method, called probit regression, to estimate the rate of mortality based on data collected for the patients, those have received medical treatment and invention resulted into death or recovered. Therefore, developing a probit regression model would support health authorities to provide a rough estimation of the mortality chance prior to admission process.
Scientific Background
By definition, the mortality rate is a measure defined as the number of deaths in a particular population, scaled to the size of that, per unit of time.5 There is another term of case fatality6in which the chance of death is estimated based on the patients’ personal individuality such as gender and age. The case fatality can be also interpreted by a mortality rate where the particular population is set as the number of patients who were contracted to a specific disease, accordingly.
In statistics, there are many techniques to investigate and formulate the relationships between predictors and desired output measures. Regression analysis is one of the most prominent ones where a mathematical equation is formulated by a linear or non-linear form to interpret the relation between dependent and independent variables.7 Among the existing techniques, the probit regression modelling is specifically utilized when the independent variable represents binary values such as zero and one, true or false, yes and no, etc. In this case, the probit regression model predicts the chance of occurrence for the dependent variable in which the mathematical formulation is developed by equation (1), where X1 , X2 , … , Xk and Y are independent and dependent variables, respectively, β1 , β2 , … , βk are parameters (coefficients), and eventually Φ is the cumulative distribution function of the standard normal distribution.8
P(Y=1|X1 , X2 , … , Xk )=Φ(β0 +β1 X1 +β2 X2 +…+βk Xk ) ——–(1)
To estimate coefficients, a more developed statistical method of maximum likelihood is utilized. To estimate the coefficients of the above structure, the likelihood function is given by equation (2) where n is sample size. The coefficients are estimated through maximizing the likelihood function in mathematical or analytical approaches.
n
L(Y, X, β)=Σyilog(Φ(β0+ β1 X1i+β2 X2i+…+βkXki))+
i=1
n
Σ(1−yi) log(1−Φ(β0+ β1 X1i+β2 X2i+…+βkXki)) –(2)
i=1
In terms of validation, the suitability of an estimated binary model can be evaluated by counting the number of true observations equaling 1 for the predicted probability above 0.5, and the number equaling zero for the predicted probability below 0.5.9 In a non-parametric discrete choice model, semi-parametric or non-parametric approaches are more practical in use, like local-likelihood ratio, which avoids considering assumptions on a parametric form for the index function and are robust to the choice of the link function of probit.10 The process follows by calculating the stat (LR) that is obtained by equation (3) and compared to the Chi-Square (χ2 ) distribution where Lur is the maximum log likelihood for the unrestricted model, Lr is the maximum log likelihood for the restricted model, and Pr(χ2 >LR) represents the p value under the null hypothesis. The null hypothesis is defined as the under study variation does not have a significant effect on modeling.
LR=2×(Lur-Lr ) ————————–(3)
Relevant Studies
In the last decades, many studies have been conducted to utilizing forecasting methods in which data have been analyzed by utilizing data mining techniques and multiple linear regressions to improve the accuracy of estimations.11 For example, a study on predicting the cost of public healthcare in Tsuyama Hospital, Japan, concluded that the forecasting models are capable of predicting more accurately costs for healthcare operations in which a linear regression has been developed.12 Studies on estimating patients’ mortality rate or other medical measurements have been also observed in the literature in which regression analysis techniques have been widely utilized over the populations under study.13 Comparing situations is another research field, where for example the study of the healthcare system forecast and its impact on health costs through linear regression in Colombia showed that long-term treatments are costly for insurers and patients.14
Among the recent studies, the Johns Hopkins University has predicted the prevalence of COVID-19 based on regression analysis and found out effective contributing factors in disease outbreak in short-term15 to manage healthcare operations during the COVID-19 pandemic. Modeling the mortality rate based on the patients’ individuals such as age and gender is also observed in the literature,6 where the mortality rate is formulated by a regression model to weekly estimate it. The statistical analysis of the aforementioned study additionally showed that persons aged 65-years or older had higher mortality rates compared to younger persons,and men demonstrated a higher risk of death than women if they are infected to COVID-19. Studies show that many Iranian had been infected to COVID-19 before the outbreak was announced by the health authorities in particular in the northern provinces of Guilan, Mazandaran, Qom, and Golestan.16 While the Iranian big cities are currently receiving many travelers from other countries mainly from United Arab Emirates (UAE), Chian, Oman, Iraq, so the case-studies on COVID-19 are required to focus more on managing the healthcare system because there is no evidence of stopping the virus outbreak when its new variants appear in termittently.
Following the above, developing a model to estimate the chance of mortality of the COVID-19 patients would support healthcare authorities to manage their heath operations and nursing capabilities. The model would be more practical if it can predict the chance of mortality prior to admission process which is easily to measure or data are available in the health information system. Therefore, the study is to design a probit regression model to formulate the association between the chance of mortality, and personal characteristics of the patients infected to COVID-19.
COMMITTED VARIABLES AND DATA COLLECTION
Study Design
To develop the Probit regression model, the dependent variable is the clearance type of death, and the independent variables (predictors) include symptoms, age, gender and underlying diseases which patient maybe suffered from them in day-to-day life. The patient symptoms naturally require being under control and are regularly measured and recorded17 while there are many underlying diseases18 committed to the patients.
According to the previous studies,19 in addition to underlying diseases that weaken the human immune system and make the patient be more committed to viruses, elderliness is also one of the risk factors for increasing the death of COVID-19. Therefore, the “Age” is getting under investigation as one of the most important contributing factors studied in this research work. Following the above consideration, the chance of death is estimated based on the symptoms, general conditions, and underlying disease as well. The probit regression model is developed for all patients resulted into recovered, transferred, and death, which all indicate the type of clearance in hospitality terminology.
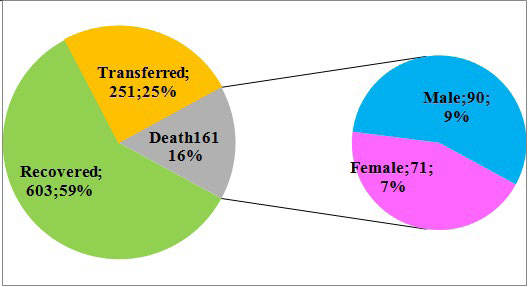
Data including age, gender, symptoms, and underlying disease, for 1015 patients have been collected from February 18 to August 20, 2020, in the northern Iranian province of Guilan for six months. Age is represented by year, but symptoms and underlying disease are indicated by a binary value of (0 and 1) where 1 represents the patient is suffering from underlying disease, otherwise 0. The similarity values are also denoted for symptoms where at least one symptom is observed during the treatment or prior to admission. Data composed of 603 (59%) recovered, 251 (25%) transferred or cleared according to personal satisfaction and 161 (16%) deaths, including 90 (9%) males and 71 (7%) females depicted (Figure 1). For more clarification, it should be noted that patients under the study had received healthcare treatments in hospitals and registered as the patients needs to receive healthcare and do not include those were taken care at home or had not been transferred to medical centers.
Figure 1. Proportions of Clearance Type and Deaths by Gender
Demographic analysis has been carried out to find out more about data and the results (Table 1).
| Table 1. Demographic Analysis of Patients Contracted to COVID-19 |
|
Variable
|
Group |
Recovered |
Dead |
Transferred |
Total |
Mortality Rate |
| Female |
Male |
Female |
Male |
Female |
Male
|
| Age |
01-20
|
5 |
13 |
0 |
1 |
0 |
2 |
21 |
4.76%
|
|
21-40
|
44 |
68 |
5 |
5 |
15 |
25 |
162 |
6.17% |
|
41-60
|
89 |
120 |
15 |
21 |
24 |
35 |
304 |
11.84%
|
| 61-80 |
81 |
124 |
30 |
43 |
50 |
62 |
390 |
18.72%
|
|
81-100
|
30 |
29 |
21 |
20 |
18 |
20 |
138 |
29.71%
|
|
Symptoms
|
At least one
|
91 |
114 |
46 |
47 |
31 |
44 |
373 |
24.93% |
|
No Symptoms
|
158
|
240 |
25 |
43 |
76 |
100 |
642 |
10.59%
|
|
Underlying Disease
|
At least one |
170 |
248 |
33 |
53 |
81 |
102 |
687 |
12.52% |
| No Disease |
79 |
106 |
38 |
37 |
26 |
42 |
328 |
22.87%
|
|
Total
|
249 |
354 |
71 |
90 |
107 |
144 |
1015 |
15.86%
|
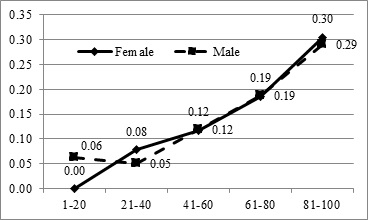
Age is divided into five groups with the number of patients in each group and mortality rates in the last two columns. All groups have been also indicated by gender shown in the middle of the table. The aggregate numbers of females and males are 427 and 588, respectively. The demographic analysis briefly shows that the mortality rate increases based on the age, suffering from underlying diseases and symptoms that prove the model can be fitted according to the nominated predictors. A quick look at the last column shows that the mortality rate is visibly increasing according to the patient’s age. For example, it is less than 10% for the patients under 40-years-old, but it is likely to be around 30% for elderly people presented in Figure 2 as well. As shown in Figure 2, in which the horizontal axis represents the age group and the vertical axis represents the mortality rate, the mortality rates for females and males are some how the same but they have smoothly increased by the age. In addition, the sudden look at the other rows also shows that the patients, who were suffering from at least one symptom, are more likely to death comparing to those who have been admitted to receive healthcare treatments without symptoms.
Figure 2. Mortality Rate for Registered Patients by Age and Gender
MODELING PROCEDURES AND ANALYSIS
In order to utilize the analytical procedures, the probit regression model is developed for all patients. The committed variables “Age”, patient symptom shown as “Sym”, and being suffered from underlying diseases, indicated by “Dise” are considered in the modeling process. Age is scaled in year, and Sym is indicated by 1 if the patient experienced at least on symptom, otherwise 0, and Dise is also indicated as 1 if the patient was suffering from at least one underlying disease, otherwise 0. To obtain the coefficients, a non-linear mathematical model has been developed and solved by an optimization software.
The mathematical formulation between predictors and dependent variable is obtained by equation (4) with the maximum log likelihood of -175.128 estimated by in equation (5) where yi is the final situation of the ith patient (1 for death, 0 for recovered or transferred clearance type).
P(Y=1; Deatℎ)=Φ(−2.978+ 0.018Age+1.062Sym+0.606Dise) ———-(4)
To validate the probit regression model, the log likelihood ratio technique is utilized, and the obtained results are displayed in Table 2.
| Table 2. Statistical Measures for the Probit Models (Significant level=0.95) |
|
Contributing Factor
|
Log (Likelihood) |
Statistical Measures |
| Unrestricted |
Restricted |
LR |
p value |
Conclusion
|
|
Model
|
-175.128 |
-305.545 |
260.834 |
≈0.000 |
Significant |
|
Constant
|
-175.128 |
-197.356 |
44.456 |
≈0.000 |
Significant |
|
Age
|
-175.128 |
-184.122 |
17.988 |
≈0.000 |
Significant
|
| Sym |
-175.128 |
-180.490 |
10.724 |
0.0011 |
Significant
|
| Dise |
-175.128 |
-176.848 |
3.440 |
0.0636 |
Not significant
|
The first column represents the contributing factors studied in the modeling process, the second column represents the unrestricted maximum log likelihood driven by the model where all contributing factors are employed in the modeling process followed by the third column where the contributing factor is extracted from the model. For example, if “Age” is extracted from the modeling, the restricted log (likelihood) represent the maximum likelihood obtained without “Age”. The attractive significance level of regression modeling sets to 95%, so if the p value is less than 0.05, means that regression modeling is significant,20 otherwise, the regression model cannot interpret the relation between mortality rate and age, symptoms or underlying disease.
The LR stats for the nominated contributing factors have been calculated using equation (3) followed by the p value of the Chi-Square (χ2 ) distribution function using the degree of freedom 1 (χ2 =3.8415|α=0.05). As shown, the LR stat for the full-variable model is 260.834 means that the Probit model significantly fits to interpret the association between variables with the significance level of 95%. In addition, the stats obtained form the constant, age, and symptoms are less than 0.05, approves that they have significant effects on mortality rate. The stat which is more than 0.05 for underlying diseases shows that data doesnot support any existing significant effect so Funderlying diseases on mortality rate. In brief, statistical procedure approved that the age and symptoms cause significant effects on both females and males mortality rates but data does not support the effects of underlying diseases on the studied mortalities. Therefore, the final model is finally formulated by equation (6), where age and symptoms have significant effects on the rate of mortality for the patients infected to COVID-19.
P(Y=1; Deatℎ)=Φ(-2.3308+0.01757Age+0.5348Sym) ———(6)
SUMMARY AND CONCLUSION
Since the estimation of patients’ mortality rate is an crucial issue for health authorities, a probit regression model has been developed to predict it based on the patients’ personal characteristic of gender, age, symptoms, and underlying diseases of those were infected to COVID-19. The research has been conducted in the Iranian northern province of Guilan, where data for 1015 patients were available. After developing a probit regression model and validating their parameters, the model revealed the chance of mortality depends on patients’ age and symptoms but not necessarily on underlying diseases.
In terms of application, the results support health authorities to provide an estimation on the rate of mortality before admiration process in hospital. Researchers interested in working in this field are recommended to focus more on the other factors contributing to the immunity of the human system resulted to death or recovery.
CONFLICTS OF INTEREST
The author declares that no research funding or scholarship has been gained for conducting this study. The author has no competing has no competing interests regarding this study.


