Diabetes pedigree function (DPF) estimates diabetes likelihood depending on the subject’s age and his/her diabetic family history, which are considered as the primary risk factors of the diabetes disease. Family clinical history reveals important genomic information, which characterizes the joint interactions between behavioral, environmental, and genetic factors.1,2,3 Practically, it is found in the society that a type 2 diabetic patient has some of her/his family members such as at least a sibling, or a parent, may have type 2 diabetes (T2D).3,4 But there is no standard proof that T2D can be recognized as an inherited disease.5 Recently, an article shows the impact of the clinical history of diseases on cardiovascular risk factors.6
The risk factors identification and early detection of diabetes are the principal steps of reducing diabetes complications.7,8 and global economic burden9 that are beneficial for both the public health perspectives and clinical practice.10 The primary risk factors of diabetes are unhealthy diet, family history, aging, ethnic groups, sedentary lifestyle, obesity and previous history of gestational diabetes mellitus (GDM).5,9,10,11 Some earlier articles have also pointed that body mass index (BMI), sex, metabolic status, and pregnancy are associated with diabetes.8,12 Recently, some articles have pointed out the diabetes risk factors using logistic regression adopting machine learning algorithms.13,14
Most of the previous articles have focused on diabetes risk factors based on the logistic regression analysis, where the response is a dichotomous discrete variable, which loses a lot of information. On the other hand, very few articles have focused on the validity of DPF, which includes only two factors such as age and the history of diabetes status. The following research queries naturally arise, which are
• Is it true that DPF has only two explanatory factors such as age and history of diabetes status?
• If it is negative, what are the additional DPF explanatory factors?
• What is the probabilistic model of DPF?
• What are the roles of the explanatory factors on DPF?
All the above issues are examined herein using a real data set that is described in the materials section. The statistical method that is used herein is described in the method section. The derived DPF explanatory factors are presented in the results section, while the roles of the explanatory factors are reported in the discussion section. Final judgment of the article is revealed in the conclusion section.
MATERIALS AND METHODS
Materials
The manuscript is promoted from a real data set that was originally collected by the National Institute of Diabetes and Digestive and Kidney Diseases, which is connected to Pima Indian heritage 768 women with at least 21-years-old. This data set can be viewed in the University of California Irvine (UCI) Machine Learning Repository. It counts on 9 important study characteristics such as diastolic blood pressure (DBP) (mm Hg), age (in years), number of pregnancies (NOPs), 2-hours serum insulin (µU/ml) (Insulin), triceps skin fold thickness (TSFT) (mm), plasma glucose concentration over 2-hours in an oral glucose tolerance test (Glucose), diabetes pedigree function (DPF), study unit type (SUT) (1=non- diabetic, 2=diabetic), and body mass index (BMI). Only SUT is an attribute character, and the rest 8 characters are continuous variables. In the current study, DPF is the interested response variable, which is a function that estimates the likelihood of diabetes depending on family history and age.
Statistical Methods
The undertaken GDM covariates information are physiological, so most of the responses are heteroscedastic. The response DPF is a positive, continuous, and unequal variance that can be modeled by applying a suitable transformation if the variance is stabilized under that transformation. Generally, in most of the cases, variance is not stabilized under the variable transformation.15 Under those cases, such responses are modeled by using joint generalized linear models (JGLMs), which is clearly illustrated in the books by Lee et al16 and Das17 JGLMs are derived under the log-normal or gamma distribution, which is clearly described in the article by Das et al.18 For the present study response DPF, the gamma model gives a better fit, which is shortly reproduced herein.
JGLMs under gamma distribution:
The interested response variable DPF is modeled using the remaining variables. Let us consider DPF=yi as the random dependent variable with mean µi =E(DPF=yi) and non-constant variance (σi2), satisfying Var(DPF=yi)=σi2 µi2 =σi2 V(µi ) say, where V(.) is termed as the variance function that identifies GLM family distribution. For example, if V(µ)=µ, it is Poisson, and it is Normal, or gamma as V(µ)=1, or V(µ)=µ2 etc.
Mean and dispersion JGLMs of DPF under gamma distribution are shown as
ηi =g(µi)=xi t β and ξi =h(σi2)=witγ
where g(.) and h(.) are the GLM link functions for the mean and dispersion linear predictors respectively, and xit, wit are the related independent variables vectors linked to the mean and dispersion parameters respectively. Maximum likelihood (ML) method is adopted to estimate mean parameters, while the restricted ML (REML) method is used to estimate dispersion parameters.18
Statistical and Graphical Analysis
The response variable DPF is modeled on the remaining independent (or explanatory) factors/ variables using JGLMs under gamma distribution only, as it gives better results than the Log-normal fit. Here DBP, glucose, age, TSFT, insulin, NOP, SUT, BMI are considered as the independent variables/ factors. Response variable DPF is identified as heteroscedastic, so it is modeled applying JGLMs assuming gamma distribution. The best DPF fitted joint model is accepted based on the lowest Akaike information criterion (AIC=9.084) value that minimizes both the predicted additive errors and squared error loss (Please see the book by Hastie et al.19 The best DPF joint gamma model analysis findings are presented in Table 1. Based on the marginality rule by Nelder,20 lower order effects (here in the mean model BMI, and dispersion model DBP) (even insignificant) are included in the model if their higher order interaction effects are significant, or partially significant. For better fitting, some partially significant effects (Glucose×BMI (p=0.0624) and DBP×pregnancy’s number (p=0.1304)) are included in the model.19 These partially significant effects are termed as confounders in epidemiology.
Table 1. Joint γ Predegree Gitting Mean and Dispersion Models
|
Model
|
Covariate
|
Estimate
|
Standard Error
|
t(759)
|
p-value
|
| Mean |
Constant |
-0.44741
|
0.40363
|
-1.108
|
0.2682
|
| Pregnancy no.(x1) |
-0.01813
|
0.00788
|
-2.300
|
0.0217
|
| Glucose (x2) |
-0.00626
|
0.00348
|
-1.799
|
0.0724
|
| Skin Thickness (x4) |
0.00446
|
0.00169
|
2.647
|
0.0083
|
| Insulin (x5) |
0.00068
|
0.00023
|
2.960
|
0.0032
|
| BMI (x6) |
-0.01946
|
0.01241
|
-1.568
|
0.1173
|
| Glucose×BMI (x2.x6) |
0.00019
|
0.00010
|
1.866
|
0.0624
|
| Age (x8) |
0.00507
|
0.00238
|
2.131
|
0.0334
|
| Study unit type (SUT) (F×10)2 |
0.19382
|
0.05587
|
3.469
|
0.0006
|
| Dispersion |
Constant |
-0.7882
|
0.27649
|
-2.851
|
0.0045
|
| Pregnancy no. (x1) |
-0.0904
|
0.05744
|
-1.574
|
0.1159
|
| DBP(x3) |
-0.0029
|
0.00393
|
-0.745
|
0.4565
|
| DBP×Pregnancy No. (x1.x3) |
0.0012
|
0.00078
|
1.514
|
0.1304
|
| AIC |
9.084
|
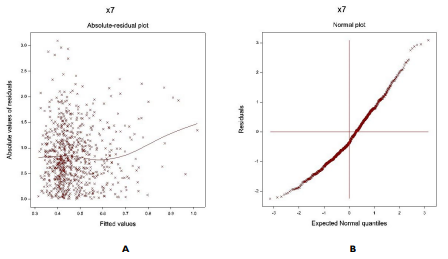
The gamma fitted DPF joint JGL mean and dispersion models (Table 1) are verified by Figure 1. Figure 1(a) presents the absolute DPF joint gamma fitted residuals plot against its predicted values that is almost a flat straight line, except the right tail, interpreting that variance is equal with the running means. The right tail is increasing due to a larger absolute residual located at the right boundary. Figure 1(b) shows the DPF joint gamma fitted mean model (Table 1) normal probability plot that does not present any lack of fitting discrepancy. These two plots imply that the DPF joint gamma fitted models are close to unknown true models.
RESULTS
The summarized results of the joint gamma DPF analysis results are shown in Table 1. From Table 1, it is observed that mean DPF is directly linked to age (p=0.0334), subject’s type (p=0.0006), TSFT (p=0.0083), insulin level (p=0.0032), the joint interaction effect of BMI×Glucose (p=0.0624), while it is inversely linked to pregnancy’s number (p=0.0217), glucose level (p=0.0724) and BMI (p=0.1173). Also, the variance of DPF is partially inversely linked to pregnancy’s number (p=0.1159) and directly to the joint interaction effect of DBP×pregnancy’s number (p=0.1304).
JGL gamma fitted DPF mean (û) model is û=exp(-0.44741-0.01813 Pregnancy Nos. -0.00626 Glucose+0.00446 TSFT+0.00068 Insulin -0.01946 BMI+0.00019 Glucose×BMI+0.00507 Age +0.19382 SUT), and the JGL gamma fitted DPF dispersion ( ) ) model is
=exp(-0.7882-0.0904 Pregnancy Nos. -0.0029 DBP+0.0012 Pregnancy Nos.×Glucose).
Table 1. Joint γ Predegree Gitting Mean and Dispersion Models
Figure 1. For the JGL gamma DPF fit (Table 1), the (a) Absolute Residuals Plot Against the DPF Fitted Values, and (b) the Normal Probability Plot for the DPF Mean Model
DISCUSSION
From the above derived results and models, it is clear that mean DPF is directly linked to age (p=0.0334), implying that DPF value rises as the age increases. This derived relation between age and DPF supports the principle of computing DPF. Mean DPF is directly linked to the subject’s type (p=0.0006) (1=non-diabetic, 2= diabetic), indicating that mean DPF value is higher for diabetic patients than normal. This also supports the principle of computing DPF. Note that the DPF is computed based on age and subject’s type only. The present results support the principle of computing DPF. Below some more factors are derived that explain DPF, which are not considered in computing DPF.
In the DPF mean model, it is derived herein that mean DPF is linked to insulin level (p=0.0032), implying that DPF value increases as the insulin level rises. This factor is not considered in computing DPF. Note that the insulin level should be negative ly associated with DPF, but it is positively associated with DPF. It shows some discrepancy when considering DPF function. On the other hand, mean DPF is negatively linked to glucose level (p=0.0724), while it is positively linked to the joint interaction effect BMI×Glucose (p=0.0624). These indicate that the joint effect of BMI and glucose level increases DPF value, while the marginal effect of glucose level decreases the DPF value. This type of association of DPF with glucose and BMI can be accepted.
Also mean DPF is directly linked to TSFT (p=0.0083), indicating that the mean DPF value increases as TSFT rises. Mean DPF is inversely linked to the pregnancy’s number (p=0.0217), interpreting that DPF value increases as the pregnancy’s number reduces. Furthermore, mean DPF is partially inversely linked to BMI (p=0.1173), concluding that DPF value increases as BMI rises. But note that mean DPF is directly linked to BMI along with glucose level, which is almost significant. Due to the marginality rule by Nelder,20 BMI is included in the mean model, even though it is partially significant. In epidemiology, a partially significant effect is known as a confounder.
In the variance model, it is derived herein that the variance of DPF is partially inversely linked to pregnancy’s number (p=0.1159), concluding that DPF values are highly scattered for the women with lower number of pregnancies. Also, the variance of DPF is partially directly linked to the joint interaction effect of DBP×pregnancy’s number (p=0.1304), indicating that DPF values are highly scattered for the subjects with higher DBP along with more pregnancies.
A recent article by Joshi et al14 predicted T2D based on logistic regression and machine learning approaches and concluded that the proposed prediction accuracy of 78.26% with a cross-validation error rate of 22.86%. For computing DPF, only the age and subject’s type whether diabetic or not are considered. In the above, it has been derived that there are many explanatory factors for computing DPF. Best of our knowledge, a few articles have discussed about the DPF and its explanatory factors. The previous articles could not focus on the explanatory factors that are derived herein. So, the present findings for the DPF explanatory factors can not be compared.
CONCLUSION
The explanatory factors of DPF have been derived herein adopting a probabilistic JGL gamma model. The best selected model is accepted depending on the lowest AIC value (here it is 9.084), graphical verifications, and the small standard error of the estimates. Based on the selected final model (Table 1), all the explanatory factors of DPF are derived herein. Best of our knowledge, the DPF explanatory factors such as age, subject’s type, insulin level, glucose level, pregnancy’s number, BMI, DBP, TSFT are not pointed out in any previous article. Anyone can examine these above reported results using the data set as stated in the materials section. It may help the researchers and practitioners. It concludes that DPF is not only based on age and subject’s diabetic family history, while it depends on many factors as stated above. So, for computing DPF, the above factors should be included in it.
ACKNOWLEDGEMENTS
The authors are very grateful to the principal data investigator, who provided the data in UCI Machine Learning Repository freely for scientific study, and also the authors are very much indebted to referees who have provided valuable comments to improve this paper.
CONFLICT OF INTEREST
No potential conflict of interest related to this article was reported.


