INTRODUCTION
Obesity is recognized as one of the most significant public health problems in the world.1,2,3 It is a risk factor for chronic disease, such as heart disease, cancer, stroke and diabetes.4,5,6,7 Conversely, weight loss is associated with reduction of risk for Cardiovascular disease (CVD) and diabetes mellitus.4,5,8 To study this relationship, we assessed the impact of a dietary calcium intervention on the effectiveness of a weight loss program for obese people.
Recent findings indicate that calcium metabolism and perhaps other components of dairy products may contribute to shifting the energy balance, and thus play a role in weight regulation.5,9,10,11,12 It has recently been shown that overweight people with low calcium and dairy consumption were at much greater risk of developing metabolic syndrome over a ten-year follow-up period than were overweight people who had high calcium and dairy consumption.13 This finding suggests that adequate calcium intake could exert a significant effect on the predisposition to a healthier metabolic profile, similar to that of a macronutrient-balanced diet and regular physical activity.14
Increased dietary calcium without energy restriction is associated with decreased fat mass in both animals and humans15,16 and thus may play a role in the attenuation of obesity and its related health complications. The inverse association between calcium and body mass was established twenty years ago by McCarron.17 One possible factor to explain the relationship between calcium intake and BMI is the fatty acid binding capacity of calcium.18 An alternative hypothesis for explaining the anti-obesity effect of calcium links dietary calcium intake, serum 1,25-dihydroxy vitamin D concentration and adipocyte intracellular calcium concentration. A low calcium diet leads to an increase in 1,25-(OH)2-D which in turn stimulates calcium influx into adipocytes, resulting in stimulation of lipogenesis, inhibition of lipolysis and expansion of adipocyte triglyceride stores. Suppressing 1,25-(OH)2-D levels by increasing dietary calcium may consequently be predicted to inhibit adiposity and promote weight loss10,12,19 Calcium in the form of dairy products may be more effective than elemental calcium,20,21,22 and high concentrations of branched chain amino acids in dairy products23 are responsible for this effect. The objective of the current study was to investigate the relationship between calcium intake and body composition, body fat distribution and serum lipid profile in overweight or obese subjects.
MATERIALS AND METHODS
Subjects
This study was proposed and conducted at Taipei Medical University. We recruited a total of 42 volunteer participants prior to the experiment start date. There were no significant differences between those who completed the study and those who did not on any parameters. Baseline participant characteristics are described in Table 1. Subjects were recruited via a flyer advertisement in Taipei Medical University. The subjects had to meet the following criteria: age 18-64 years; Body Mass Index (BMI) higher than 24; calcium consumption <500 mg/day (according to three-day food records); no history of chronic disease, including history of cardiovascular disease, kidney disease, liver disease, endocrine disorders, and diabetes mellitus; women were included only if they were not pregnant or breast-feeding; and no participation in another clinical trial (within six months) was permitted. Sample-size calculations were based on results from a randomized, parallel-design study, we estimated that a sample size of 20 subjects/grout in the current would yield 80% power (2-tailed α=0.05) to detect a similar group difference. At the beginning of study, 70 volunteer subjects were assessed for eligibility, 28 were excluded (26 not meeting inclusion criteria, 2 declined to participate). The Research Ethics Committee, Taipei Medical University, Taiwan, approved the study and all subjects gave written informed consent before their participation.
| Table 1: Physical characteristics and nutrient intake of study subjects.1 |
|
Characteristics
|
Hi Ca group (n=21) |
Control group (n=21)
|
| male : female |
5:16
|
5:16
|
| Age (years) |
43.0±12.0
|
35.2±11.6
|
| Height (cm) |
158.7±7.7
|
164.0±6.6
|
| Weight (kg) |
76.2±16.2
|
80.2±10.7
|
| BMI2 (kg/m2) |
30.0±4.4
|
29.7±2.0
|
| Waist circumference (cm) |
96.4±12.0
|
99.0±8.1
|
| Energy intake (kcal/d) |
1997.0±35.6
|
2001.8±73.2
|
| Calcium intake (mg/d) |
320.2±93.7
|
328.2±87.7
|
1Each value represents the mean ± SD. There were no significant differences between groups based on independent-samples t-test.
2BMI: Body Mass Index. |
Dietary Supplementation
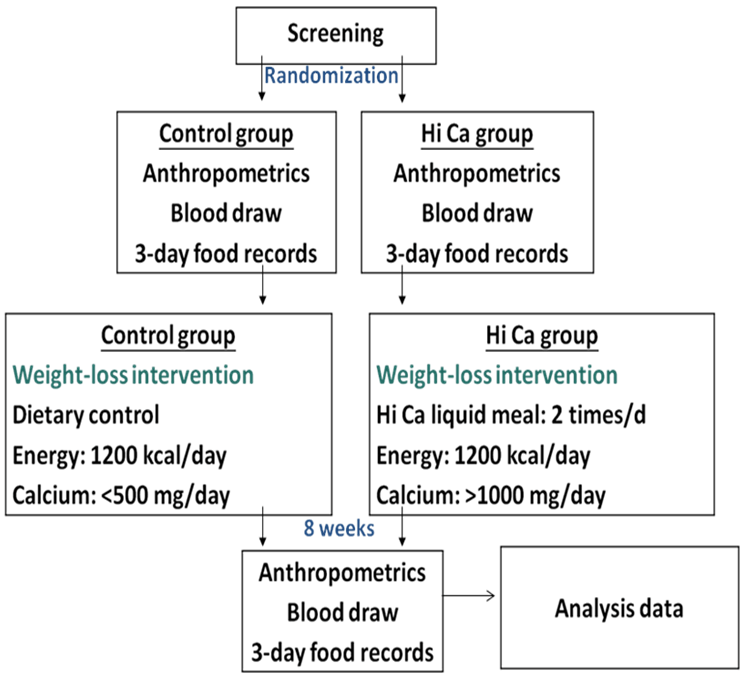
All subjects were randomly divided into two singleblind groups: subjects in Hi-Ca group were provided Hi calcium drinks (calcium 300 mg/pack) every breakfast and dinner for eight weeks and prescribed a low-caloric diet providing 5.2 MJ/d (1200 kcal/d) during the intervention.
Experimental Design
For the control group, we provided only a low energy diet for eight weeks. The diets for the two groups were designed to provide comparable levels of macronutrients as follows: 55% carbohydrate, 20% protein, and 25% fat. Lectures about nutrition and weight management were provided to both groups on every visit. Anthropometric measurements were taken including height, weight, and the percentage of body fat during each weekly visit. Biochemical parameters were analyzed at beginning and end of the intervention. Dietary records and counseling were used to estimate dietary intake. We educated the participants about guidelines for 1200 kcal diets and gave instruction on protein sources and food portion sizes.
Figure1: Experimental flow diagram.
Analyses of Anthropometry and Serum Lipid Profiles
Anthropometry: Height, bodyweight, and waist circumference were measured, and the BMI was then calculated (screening, 0, 8 weeks). Body composition was measured using the In Body 3.0 Body Composition Analyzer. Systolic and diastolic blood pressures were measured in the right or the left arm supported at heart level of seated participants.
Biochemical analysis: At screening, 0, and 8 weeks, blood samples were obtained following a twelve-hour fast and serum was stored at -80 °C until analysis. PTH level was determined using a commercial immunoradiometric assay. Cholesterol and triglyceride concentrations were determined enzymatically in plasma and lipoprotein fractions with an automatic immunoanalyzer. Plasma lipoprotein fractions (LDL and HDL) were isolated by ultracentrifugation.
Determination of Serum and Urinary Mineral Status
To monitor minerals in serum, the following laboratory parameters were determined at 0, 4, and 8 weeks: urinary calcium and serum calcium status. Serum calcium and urinary calcium were measured by the O-cresolphthalein complex colorimetric method using a Hitachi 7170S auto analyzer.
Assessment by Nutritional Survey
Nutrition was assessed from a 3-day diet record for two weekdays and one weekend day in weeks 0, 8, and information was collected on the day the subject returned. We mainly assessed the dietary intake of total energy, carbohydrates, protein, and fat to confirm that subjects did not change their eating habits. Dietary record data was measured by the Nutritional Chamberlain Line, Nutritionist Edition, version 2002, E-Kitchen Business Corp., Taiwan, which is referred to in the 1998 year database of the Department of Health, Taiwan.
Statistical Analysis
All data are expressed as the mean±SD. Differences between the beginning and end of treatment were tested by paired t-test. Differences between the Hi-Ca group and control group were tested with the independent-samples t-test. We used the SAS, version 9.1 (SAS Institute, Cary, NC, USA) for Windows to analyze all data. Simple Pearson correlations between calcium intakes were computed in the total sample of subjects as an indication of the relation between the degree of metabolic deterioration and calcium intake. A value of P<0.05 was used to indicate statistical significance.><0.05 was used to indicate statistical significance.
RESULTS
Anthropometric Characteristics and Dietary Intake
Baseline characteristics of participants are shown in Table 1. Baseline physical characteristics were similar in the Hi-Ca group and control group. All subjects were asked to keep regular physical activity and life style. Estimates of the energy, macronutrients, and calcium intake during the study period based on food records are shown in Table 2. These indicate no differences in energy, macronutrient, and fiber intake, and were very close to the recommended amounts of 55%, 20%, and 25%, respectively. After eight weeks, results showed that the calcium intake was 964.5±75.5 mg in the Hi-Ca group and was 353.7±96.6 mg in the control group (p<0.05).
| Table 2: Dietary intake of energy and macronutrients.1 |
|
week
|
Hi Ca group |
Control group
|
| Energy (kcal) |
0
|
1227.9±52.6 |
1224.5±63.4
|
|
8
|
1232.4±68.4 |
1221.5±66.3
|
| Carbohydrate percentage (%E) |
0
|
55.0±4.3 |
54.2±5.1
|
|
8
|
55.2± 4.9 |
55.2±4.9
|
| Fat percentage (%E) |
0
|
23.4±4.0 |
24.8±3.1
|
|
8
|
23.5±5.3 |
24.2±3.0
|
| Protein percentage (%E) |
0
|
19.3±1.9 |
19.2±2.0
|
|
8
|
19.8±1.8 |
19.6±2.0
|
| Dietary Fiber (g) |
0
|
27.9±4.8 |
25.4±5.9
|
|
8
|
29.9±4.0 |
26.9±4.8
|
| Calcium (mg) |
0
|
920.2±93.7* |
328.2±87.7
|
|
8
|
964.5±75.5* |
353.7±96.6
|
1Each value represents the mean±SD. There were no significant differences between groups based on independent-samples t-test.
%E, percentage of energy.
*Values are significantly different with control group at Weeks 0 and 8, p<0.05. |
As shown in Table 3, body weight, body mass index, body fat mass, body fat mass percentage, waist circumference and waist-hip ratio of the two groups decreased significantly after eight weeks of weight loss intervention (p<0.05 for all). Moreover, the loss of body weight (-6.9±3.3 kg, p<0.05), BMI (-2.7±1.1 kg/m2 , p<0.01), body fat mass (-5.7±2.7 kg, p<0.05), body fat percentage (-4.4±1.9 %, p<0.002) in the Hi-Ca group differed significantly from those of control group after eight weeks.
| Table 3: Anthropometric measurements before and after weight-loss intervention and change in variables between measurement periods1. |
|
Hi-Ca group
(n=21)
|
Control group
(n=21)
|
|
Week 0
|
Week 8 |
Change |
Week 0
|
Week 8
|
Change
|
| Weight (kg) |
76.2±16.2
|
69.3±13.9a |
-6.9±3.3b |
80.2±10.7
|
75.1±9.5a
|
-5.1±2.6
|
| BMI2 (kg/m2) |
30.3 ±4.4
|
27.3±3.8a |
-2.7±1.1b |
29.7 ±2.0a
|
27.8±1.8a
|
-1.9±0.9
|
| Body fat mass (kg) |
28.7±7.3
|
23.0±5.6a |
-5.7±2.7b |
29.1±4.6
|
25.2±4.2a
|
-3.9±1.4
|
| Body fat percentage (%) |
37.5±3.6
|
33.1±4.0a |
-4.4±1.9b |
36.5±5.1
|
33.8±5.2a
|
-2.7±0.9
|
| Muscle (kg) |
44.2±9.4
|
43.5±9.4a |
-0.7±1.1 |
47.8±9.1
|
46.6±8.5a
|
-1.2±1.3
|
| BMR3 (kcal) |
1348.0±226.2
|
1321.8±215.5a |
-26.2±30.7 |
1500.4±231.3
|
1472.6±216.9a
|
-27.8±29.9
|
| Waist circumference (cm) |
96.4±12.0
|
86.5±12.1a |
-9.9±4.2 |
99.0±8.1
|
88.0±6.9a
|
-11.0±4.6
|
| Waist-Hip ratio |
0.96±0.06
|
0.91±0.05a |
-0.05±0.02 |
0.96±0.04
|
0.92±0.04a
|
-0.04±0.02
|
| Systolic pressure (mmHg) |
125.3±12.7
|
118.8 ±8.8a |
-6.6±12.6 |
134.0±14.4
|
114.6±10.6a
|
-19.5±17.3c
|
| Diastolic pressure (mmHg) |
73.1±8.2
|
70.5±11.2 |
-1.1±7.9 |
83.1±9.4
|
73.4 ±7.8a
|
-9.7±11.2c
|
1Each value represents the mean ± SD.
2BMI: Body Mass Index
3BMR: Basal Metabolic Rate
aThe Week 8 values are significantly different from Week 0, p<0.05.
bValues are significantly different from control group, p<0.05.
cValues are significantly different from Hi-Ca group, p<0.05. |
Blood Glucose and Serum Lipids
As for lipid profiles, serum cholesterol, triglyceride and LDL-C concentration at Week 8 were significantly lower compared with Week 0. TC/HDL-C ratio was significantly lower in the Hi-Ca group than in the control group (p<0.05). There was no statistically significant difference in blood glucose levels and blood pressure between the two groups (Table 4).
| Table 4: Serum lipid and glucose profiles before and after the weight-loss intervention and change in variables between measurement periods1. |
|
Hi-Ca group
(n=21)
|
Control group
(n=21)
|
|
Week 0
|
Week 8 |
Change |
Week 0 |
Week 8 |
Change
|
| TG2 (mg/dL) |
115.1±48.1
|
84.8±24.0a |
-20.6±53.6 |
127.7±60.1
|
109.2±58.3a
|
-18.5±70.9
|
| TC2 (mg/dL) |
183.1±24.5
|
157.2±25.3a |
-25.9±20.8 |
200.6±31.6
|
178.0±32.7a
|
-22.6±22.0
|
| LDL-C2 (mg/dL) |
115.2±21.9
|
97.4±20.7a |
-18.0±19.4 |
121.1±27.6
|
109.5±30.0a
|
-11.6±17.4
|
| HDL-C2 (mg/dL) |
40.9±12.9
|
37.6±9.9a |
-3.3±5.7 |
53.4±10.1
|
46.6±8.2a
|
-6.8±6.6c
|
| TC/ HDL-C |
4.8±1.2
|
4.4±1.0a |
-0.4±0.6b |
3.9±1.9
|
3.9±1.0
|
-0.1±0.6
|
| Glucose3 (mg/dL) |
102.3±20.1
|
96.7±11.4 |
-5.6 ±16.4 |
94.9±9.9
|
91.0±8.9
|
-3.8 ± 9.0
|
1Each value represents the mean±SD.
2TC: total cholesterol, TG: triglyceride, LDL-C: low density lipoprotein-cholesterol, HDL-C: high density lipoprotein-cholesterol.
3Glucose: fasting plasma glucose (normal range for Glucose=80-105 mg/dL)
aThe Week 8 values are significantly different from Week 0, p<0.05.
bValues are significantly different with control group, p<0.05.
cValues are significantly different with Hi-Ca group, p<0.05 |
Calcium Intake and Body Composition
The Hi-Ca group was significantly lower in serum PTH (parathyroid hormone) compared with baseline (-5.3±10.4 pg/ mL, p<0.05) at Week 0, which showed that the concentration of PTH and calcium intake were negatively correlated, indicating that using a high calcium low energy diet for weight loss produced more significant decrease in body weight, BMI, body fat mass, and body fat percentage. Significant negative correlations were observed between calcium intake changes and PTH levels, as shown in Table 5. (p<0.001).Significant negative correlations were also observed between calcium intake changes and body weight change (p<0.0001), body mass index (p<0.0001), body fat mass (p><0.0001), body fat mass percentage (p<0.001), and waist circumference (p<0.027).
DISCUSSION
This study demonstrates that an energy restricted diet (1200 kcal/day) for eight weeks can lead to a significant reduction in weight, BMI, body fat mass and body fat percentage. Modest weight loss in obese individuals (5-10% of initial body weight) is likely to improve their health in the short term by reducing the severity of comorbidities associated with obesity.15,24
Our findings also indicate that a high calcium diet can lead to greater reduction in weight, BMI, body fat mass, and body fat mass percentage. Zemel, et al. showed the effect of an energy-restricted diet on weight and fat loss (providing either 400-500 mg/day from dairy products, or 1200-1300 mg/day from an additional 800 mg of calcium carbonate, or from an additional three servings of dairy products) in 32 obese or overweight women. Their results indicated that increasing dietary calcium significantly augmented weight and fat loss secondary to caloric restriction.9
To date, numerous observational studies have identified a strong inverse relationship between body weight and dietary calcium and dairy product intake.25 A low calcium diet leads to an increase in 1,25(OH)2-D3, which in turn stimulates calcium influx into adipocytes, resulting in stimulation of adipocyte triglyceride stores. Suppressing 1,25(OH)2-D3 levels by increasing dietary calcium could thus be predicted to inhibit adiposity and promote weight loss. High dietary calcium intake is associated with reduced 1,25(OH)2-D3 levels which in turn act to decrease calcium influx into the cell. These modifications eventually stimulate lipolysis and inhibit lipogenesis in the adipocytes.21,22,26 Increased intracellular calcium stimulates Fatty Acid Synthase (FAS), and inhibits lipolysis in adipocytes.27,28 Further, FAS is inhibited by calcium antagonism.27,28,29 Another mechanism that might explain the relationship of calcium consumption and adiposity is the effect of calcium on triglyceride absorption from the intestinal tract. Large amounts of calcium in the gastrointestinal tract may reduce absorption by precipitating insoluble fatty acid calcium soaps.18,30,31,32,33
The decrease in TC/HDL-C ratio observed in this study could be due to several effects attributed to calcium intake, such as a reduction in fatty acid absorption and increase in fecal fatty acid content, probably resulting from the formation of insoluble calcium-fatty soaps in the gut.18,30,31,34 Other properties attributed to calcium are the mineral’s ability to bind bile acids, increase the conversion of cholesterol to bile acids, and thus increase cholesterol excretion.35,36 In this regard, it has been shown that increasing dietary calcium suppresses the stimulation of calcium influx into adipocytes and stimulates lipolysis.16 In this study, HDL-C levels significantly decreased compared with Week 0. The HDL-C levels are clinical findings commonly associated with smoking, visceral obesity, hypertriglyceridemia, use of certain drugs, and very low-fat diets.37
We did not observe a significant difference between groups in terms of a decrease in fasting plasma glucose and blood pressure in response to the intervention. Indeed, the Coronary Artery Risk Development in Young Adults Study showed that abnormal glucose homeostasis incidence decreased with increasing dairy intake in overweight persons.13 Therefore, better understanding is still needed to determine whether the benefit of the calcium-induced improvement in glucose levels and blood pressure can be attributed to dairy products.
Consumption of a dairy calcium rich diet confers protection against loss of lean body mass during energy restriction (Hi-Ca group: -0.7±1.1 kg; Control group: -1.2±1.3 kg). This outcome may be attributable to the high proportion of BCAA (branched chain amino acid, including leucine, isolucine and valine), found in dairy proteins. They play a specific metabolic role as energy substrates and in the regulation of muscle protein synthesis.9,38,39,40
Low calcium intake increases PTH, resulting in increased cellular calcium. Supporting the role of PTH in obesity, a positive correlation between serum intact PTH and both BMI and fat mass has been observed.10,41,42,43 In this study, negative correlations with PTH levels did reflect the differences in the Hi-Ca group (Hi-Ca group: -5.3±10.4 pg/mL; Control group: +11.5±14.3 pg/mL). Significant negative correlations were observed between PTH level and calcium intake changes. Significant negative correlations were likewise observed between calcium intake changes and body weight change, body mass index, body fat mass, body fat percentage, and waist circumference. For instance, in a study on 302 healthy volunteers, Parikh et al. found significantly lower plasma 1,25(OH)2-D3 levels in obese than in non-obese subjects.44 In addition, PTH has also been shown to regulate adipocyte intracellular calcium,16,45 and it has been proposed as a potential mediator of the anti-obesity effect of dietary calcium.46,47 In support of the role of PTH in obesity, positive correlations between serum PTH and BMI and fat mass have been reported by several studies.41,42,43,44,48
In conclusion, we suggest that a high calcium diet increases the effectiveness of calorie-restriction for weight loss in overweight and obese people, while also improving cardiovascular disease risk profile. Further research could examine possible mechanisms on calcium and adipose tissue accumulation.
STRENGTHS AND LIMITATIONS
The strengths of this study include the objectively investigated the relationship between calcium intake and body composition, body fat distribution and serum lipid profile in overweight or obese subjects. We found a high calcium diet increases the effectiveness of an energy-restricted diet for weight loss in overweight people resulted in more significant decreases in body weight, BMI, body fat mass, and body fat percentage. However, physical activity were based on self-reported data, baseline physical characteristics were similar in the Hi-Ca group and control group. All subjects were asked to keep regular physical activity and life style. We did not tract physical activity during intervention. Future research could examine their physical activity levels during study.
CONFLICTS OF INTEREST
The authors declare that they have no conflicts of interest.
ACKNOWLEDGMENTS
We would like to thank all subjects for participating in this study. This study was provided by grant SKH-TMU-99-12.


