INTRODUCTION
Hepatocellular carcinoma (HCC) is a leading cause of cancer death in the United States1 and considered the second leading cause of cancer death in East Asia and sub-Saharan Africa and the sixth most common in western countries.2-4 The HCC occurred after chronic affection with hepatitis C, B, liver cirrhosis, Aflatoxin B1 exposure, hemochromatosis, fatty liver disease, alpha-1 antitrypsin deficiency, pesticides and chemical exposure.4,5 The survival rate of HCC harboring patients is still low after using different protocols of treatment in the presence or absence of cirrhosis to the percentage of liver tumor tissue to non-tumor tissue based on therapy by positron emission tomography/computed tomography (PET/CT) imaging modalities.6
The correlation of 18F-Fluorodeoxyglucose (FDG) glucose uptake and large volume of liver with tumor tissue in c-myc transgenic mice treated with diethyl-nitrosamine was reported by micro CT/PET imaging.7 Genomics, radiogenomics or imaging, has new advanced tools in correlation science of different imaging modality data with genomic data. Radiogenomics science revealed detailed information about intratumor, intertumoral and peritumor tissue.8 The relationship of maximum standard glucose uptake with glucose transporter 1 (GLUT1) expression and the inverse correlation with glypican-3 (GPC3) expression was seen in patients with harboring liver tumors.9 Additionally, Li et al found that the 18F-FDG uptake of in hepatoma G2 (Hep G2) cells-expressed GPC3 significantly lower than that of RH7777 cells which has not expressed GPC3.9 Moreover, 18F-FDG uptake of the tumor to the non-tumor ratio of the EGF transgenic model of liver cancer was recorded to be dependent on lesion size and correlated with the upregulation of gene expression of glucose transporters and hexokinase isoenzymes.10
To develop effective treatments of liver tumors, the preclinical models are necessary to evaluate novel therapeutic agents and approach with consideration to their mechanism against liver tumors.11 The c-myc transgenic mouse, a genetic model, developed a multiple highly malignant liver cancers promoted by c-myc oncogene mimic what happened in patients suffering from liver cancer.12,13 The rationale of this study to investigatethe correlation of 18F-FDG uptake and the gene expression related to glucose metabolism in different stages of liver cancer progression.
MATERIALS AND METHODS
Tumor Model and Animal Handling
All animal studies were approved by the Ethics Committee and the Local Governmental Authorities and were in accordance with national guidelines (Tier-Versuchs-Vorhaben 33.9-42502-04-08/1619). The c-myc transgenic mouse model is a well-identified model of hepatocellular carcinoma. Transgenic mice were generated by the method described by Dalemans et al.14 In transgenic mice, the protooncogene c-myc is over-expressed under the promoter α1-antitrypsin, so that animals develop hepatocellular carcinoma at the age of about 12-months. Altogether 96 transgenic (c-myc) and 48 non-transgenic CABL6 mice were examined. Mice were kept in cages with 1-4 mice per cage on sawdust on a 12-hours light-dark cycle, and 50% relative humidity, in a temperature-controlled (22 °C) room. Mice received a standard diet (Zucht, Specifications GmbH, DE, Germany, www.ssniff.de) 15 and drinking water ad libitum.
The 120 mice were divided into 6 groups, each group contained 12 mice of both sexes. DEN (Diethylnitrosamine) was injected intraperitoneally once a week during a period of 6-weeks while BHT was injected twice a week for 8-weeks at the age of 2-months, as explained earlier.7
In vivo microCT and microPET imaging were performed at four different time points (4, 5.5, 7 and 8.5-months) and all rats were sacrificed immediately after the end of imaging. All imaging procedures were carried out under inhalation anesthesia with isoflurane (Isoba vet., Essex Pharma, Germany) at a concentration of 4% for anesthesia induction and 1-2% for maintenance. Animals breathed spontaneously via nose cone (Summit Anesthesia Solutions, Bend, OR, USA). The breathing rate was continuously monitored using a small pressure transducer (Biovet, m2m imaging, Newark, NJ, USA) and kept between 80 and 100 per minute the mice were placed in a temperature-controlled bed for warming (T/Pump, Gaymar, Orchard Park, NY, USA). Recovery time was usually less than five-minutes after the imaging procedure.
MicroPET Imaging
All animals were starved for at least 6-hours before the imaging procedure. The anesthetized mice were injected intraperitoneally with 10 MBq of (18F)-2-Fluoro-2-deoxyglucose (18F-FDG in a total volume of 50-100 μl sterile isotonic saline solution was obtained from the Department of Nuclear Medicine, Hannover Medical School, Hanover). After the injection, the CT scan was done and mice were kept in an anesthetic state and in the same position on the imaging bed until PET scan was carried out in order to minimize unspecific tracer enhancement in the muscles.7,16,17
Image Analysis
For microPET analysis, rigid registration of joint PET/CT datasets based on anatomical landmarks was used to generate fused datasets. Regions-of-interest (ROI) were manually detected in all focal liver and lung lesions with a diameter above and down 5 mm as detected in microCT and/or 18F-FDG microPET. Exemplarily, FDG-uptake was estimated in 10 lesions below and up 5 mm as well. The background (non-tumor) signal was detected by placing an ROI in the tumor-free liver and lung parenchyma. The maximum count rate per volume was determined for each ROI and tumor-to-non-tumor ratios were calculated.18
Exon array expression:
After animal imaging, all mice were sacrificed, the liver separated, weighted and [cryopreserved at-80 °C for ribonucleic acid (RNA) isolation later. The RNA extraction was carried out by using the RNeasy Micro Kit (Qiagen, Santa Clarita, CA, USA). The extracted 47 RNA samples (3 males and 3 females per each 1st and 4th sacrifice of treated or non-treated groups) were tested for quality on the Agilent 2100 Bioanalyzer (Agilent Technologies, Palo Alto, USA). The RNA samples of RNA integrity number (RIN) above 2 were selected for exon array (Affymetrix). One mg of total RNA from individual animals of n=4 livers of treated or control transgenic either harbored tumor or normal control non-transgenic was used for Ribosomal RNA ( rRNA) reduction and RNA labeling using the Invitrogen and Affymetrix kits, respectively, as we follow the manufacturer’s instructions. Hybridization cocktails containing 4.5-5 mg of fragmented and end-labeled single-stranded sense target cDNA were previously prepared and hybridized to GeneChip Mouse Exon 1.0 ST arrays.19,20 All processed arrays were scanned by using the GeneChip Scanner 3000 7G. Affymetrix Expression Console Software (version 1.0) was used to check the quality assessment and normalization NB. All steps of exon array experiment and analysis were done in Fraunhofer item for toxicology and experimental medicine, Hannover Germany 2010 and the analysis done in pharmacotoxico-genomics institute, MHH, Hannover Germany.
Statistical Analysis
Differential gene expression for exon array was analyzed by using two different software’s, Array Track (v. 3.4.5) and Biotique X-RAY (v. 3.2). The following criteria were used for exon array differential gene expression study using the Biotique X-RAY software. One-way analysis of variance (ANOVA) was used for the glucose uptake difference between groups.
RESULTS:
Transgenic ATT-MYC and non-transgenic mice at 2-months of age did not show any tumor growth or FDG uptake proved by CT and pet scans. Immediately after end the treatment, only one mouse out of 24 treated by diethylnitrosamine (DEN) had a gross tumor in the liver as confirmed by microCT and glucose uptake (pet scanning). The second, third and fourth sacrifices after the end of DEN treatment, all mice displayed liver tumor validated by histopathology (data not shown) and microCT and PET scanning.7
The 18F-FDG uptake was ranged from 1 mm and up to 10 mm, strong or homogenous or weak in corresponding to the size of the tumor. The largest tumor size of above 10 mm was the highest glucose uptake. Also, glucose uptake was time-dependent as a fourth-time point of sacrifice >3rd>2nd>1st. Notably, the central tissue necrosis of the tumor was the weakest point of glucose uptake.
Interestingly, all non-transgenic or transgenic control groups didn’t show any positive intensity for 18F-FDG as well as non-genotoxic butylated hydroxytoluene (BHT).
The validation of PET versus CT accuracy revealed that pet scan is better tools for diagnosis of liver and lung cancer without any false positive echo that was seen in BHT treated mice and confirmed by previously by histopathological examination as big nodules encircle by lining endothelial cells.7,16,17
Additionally, primary lung cancer or liver cancer metastasis to lung, as reported in mice treated with DEN, has shown a correlation between glucose uptake and the tumor size as indicted by the strong signal intensity (Figures 1, 2 and 3).7
Figure 1. 18F-FDG Uptake was Ranged from Low to High Intestacy in Liver Tissue Harbor Cancer Cells in c-myc Treated by DEN at Age of 8.5-Months
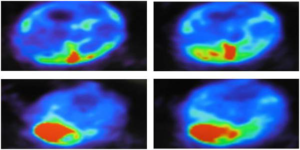
Figure 2. The Depicted Figure Shown The Evidence of Glucose Uptake in Primary Lung Cancer Tissue and Also Correlated with Size Dependent in c-myc Treated by DEN at Age of 8.5-months or After 4.5-Monthes After End of Treatment
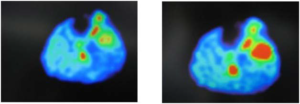
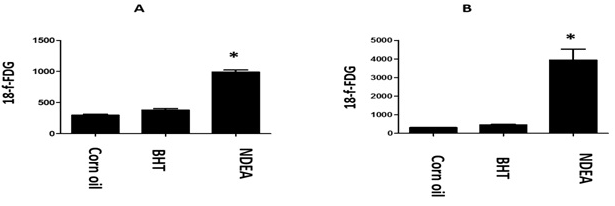
Figure 3. The Depicted Figure Shown the Highest Glucose Uptake (means±se) in Liver Harbor HCC in the Last Sacrifice after DEN Treatment at Age of 8.5-months (B). Notably, DEN Treated Transgenic Mice of Both First (A) and Last Sacrifice (B) Displayed a Significant Increase of Glucose Uptake when Compared with Transgenic Mice Treated by BHT or Corn Oil as Vehicle Groups
Gene Expression Related to Glucose Metabolism Analyzed by Biotiqe System
We studied 12 hybridizations comparison of 1st sacrifice of DEN genotoxic carcinogens versus non-genotoxic one were analyzed by the biotique system, it was found that among the top 10-fold changes in genes with significant differential gene expression was Slc38a2 and no ultra-splicing in glut1 or 2. Fold change is in terms of the normalized untransformed data.
In the present, we study the biotiqe analysis of 9 hybridizations of the Mouse Exon 10-ST array using mixed model analysis of variance. We found that there is no genes or alternative splicing between top 10 significant genes expressed in the groups DEN_1 sacrifice _mf when compared to ntr_4s_mf related to glucose metabolism (Table 1).
| Table 1. Shows the slc38a2 gene Expression Related to Glucose Metabol as with Significant Differential Gene Expression in Liver Tissue of 1st Sacrifice After DEN when Compared with BHT and Related to Glucose Metabolism. Fold Change was in Terms of the Normalized Untransformed Data |
|
Gene Symbol
|
T Cluster ID
|
Description
|
Fold Change
|
Differential Expression p value
|
|
Slc38a2
|
6838257
|
solute carrier family 38 member 2 (among its pathway glucose transport)
|
2.31
|
0.02
|
Here in Table 2, the genes responsible of glucose transport such as of glut1, 3, 4, hk1, slc1a5, slc5a1, slc1a4, slc1a2, gp6cand gpc-1-3-4 were shown a significant regulation at p-value≤0.05 while glut2 (fold change 0.9503, p-value 0.4385) and hk2 (fold change 3.0589, p-value 0.0565) were shown a non-significant increase at age of 4-months or at the end of treatment.
| Table 2. The Gene Expression of glut1, 3, 4, hk1, slc1a5, slc5a1, slc1a4, slc1a2, gp6c and gpc-1-3-4 at p-value≤0.05 while glut2 and hk2 were Shown a Non-significant Expression Immediately after DEN Treatment at 4-months Aged Mice when Compared to BHT Treatment and Control Group |
|
Gene Symbol
|
T Cluster ID
|
Description |
Fold Change
|
p value
|
|
Hk1
|
15275
|
Hexokinase-1
|
4.0457
|
0.0243
|
|
Slc1a5
|
20514 |
Solute carrier family 1 member 5
|
12.8096
|
0.0001
|
|
Slc5a1
|
20537
|
Solute carrier family 5 (sodium/glucose cotransporter), member 1
|
5.7203
|
0.0068
|
|
Slc1a4
|
55963
|
Solute carrier family 1 (glutamate/neutral amino acid transporter), member 4
|
3.2237
|
0.0488
|
|
Slc1a2
|
20511
|
Solute carrier family 1 (glial high affinity glutamate transporter), member 2
|
4.442
|
0.0177
|
|
Slc38a2
|
67760
|
Solute carrier family 38 member 2 (among its pathway glucose transport)
|
17.2678
|
0
|
|
Slc2a1
|
20525
|
Glut1
|
11.2042
|
0.0003
|
|
Slc2a2
|
2056
|
Glut2
|
0.9503
|
0.4385
|
|
Slc2a3
|
20527
|
Glut3
|
10.5845
|
0.0004
|
|
Slc2a4
|
20528
|
Glut4
|
4.5084
|
0.0168
|
|
HK2
|
15277
|
Hexokinase-2
|
3.0589
|
0.0565
|
|
Gpc1
|
14733
|
Glypican-1
|
25.5662
|
0
|
|
Gpc3
|
14734
|
Glypican-3
|
5.6451 |
0.0072 |
|
Gpc4
|
14735
|
Glypican-4
|
5.5982
|
0.0074
|
|
G6pc
|
14377
|
Glucose 6 phosphatase
|
4.823
|
0.0131
|
|
ALDOA
|
11674
|
Aldolase A
|
9.6925
|
0.0006
|
|
PKM2
|
18746
|
Pyruvate kinase M2v
|
2.3168
|
0.0668
|
|
LDHB
|
16832
|
Lactate dehydrogenase wasoform
|
2.874
|
0.4593
|
|
Six1
|
427402
|
SIX Homeobox 1
|
0.7143
|
0.0191
|
|
HIF1a
|
432128
|
Hypoxemia inducing factor 1a
|
4.343
|
0.0001
|
|
c-myc
|
424405
|
Myelocytomatoswas
|
14.0755
|
0.5274
|
|
Pfkl
|
427329
|
Phosphofructokinase
|
0.7684
|
–
|
|
Pgk1
|
427956
|
Phosphoglycerate kinase-1
|
Not found
|
–
|
|
Pgam1
|
424483
|
Phosphoglycerate Mutase 1 |
Not found
|
–
|
|
Trp53
|
424011
|
Tumor suppressor p53
|
10.8355
|
2.60
|
Notably, in Table 3, the genes responsible of glucose transport of slc1a5, slc38a2, glut1, glut4 and gpc-3,4 displayed significant fold changes in tumor tissue of DEN treated mice when compared to BHT or control transgenic or non-transgenic one. While hk1, 2, slc5a1, slc1a4, glut2, glut3, g6pc and gpc-1 genes were shown a non-significant increase when compared to the control group.
| Table 3. The Gene Expression of slc1a5, slc38a2, glut1, glut4 and gpc-3,4 Genes were Expressed Significantly with Fold Changes in Liver Tissue of DEN Treated Mice at the Age of 8.5 when Compared to BHT or Control Transgenic or Non-transgenic One. While hk, 2, slc5a1, slc1a4, glut2, gut3, g6pc and gpc-1 were Expressed in a Non-significant State when Compared to BHT or Control Transgenic or Non-transgenic One |
|
Gene Symbol
|
T Cluster ID
|
Description
|
Fold Change
|
Differential Expression p value
|
|
Hk1
|
15275
|
Hexokinase-1
|
0.8593
|
0.2513
|
|
Slc1a5
|
20514
|
Solute carrier family 1 member 5
|
0.4737
|
0.0046
|
|
Slc5a1
|
20537
|
Solute carrier family 5 (sodium/glucose cotransporter), member 1
|
2.0376
|
0.14672
|
|
Slc1a4
|
55963 |
Solute carrier family 1 (glutamate/neutral amino acid transporter), member 4
|
0.64070
|
0.5992
|
|
Slc1a2
|
20511
|
Solute carrier family 1 (glial high affinity glutamate transporter), member 2
|
2.5437
|
0.0905
|
|
Slc38a2
|
67760 |
Solute carrier family 38 member 2 (among its pathway glucose transport)
|
3.2134
|
0.0493
|
|
Slc2a1
|
20525
|
Glut1
|
3.849
|
0.0286
|
|
Slc2a2
|
2056
|
Glut2
|
3.0446
|
0.0572
|
|
Slc2a3
|
20527
|
Glut3
|
2.0203
|
0.1493
|
|
Slc2a4
|
20528
|
Glut4
|
3.4199
|
0.0411
|
|
HK2
|
15277
|
Hexokinase-2
|
2.1573
|
0.1307
|
|
Gpc1
|
14733
|
Glypican-1
|
2.3751
|
0.1061
|
|
Gpc3
|
14734
|
Glypican-3
|
6.4366
|
0.0041
|
|
Gpc4
|
14735
|
Glypican-4
|
2.5828
|
0.0873
|
|
G6pc
|
14377
|
Glucose 6 phosphatase
|
2.9161
|
0.0643
|
|
ALDOA
|
11674
|
Aldolase A
|
4.0709
|
0.0238
|
|
PKM2
|
18746
|
Pyruvate kinase M2v
|
1.5475
|
0.2387
|
|
LDHB
|
16832
|
Lactate dehydrogenase wasoform
|
2.7194
|
0.0769
|
|
Six1
|
427402
|
SIX Homeobox 1
|
0.488
|
0.6951
|
|
HIF1a
|
432128
|
Hypoxemia inducing factor 1a
|
0.7197
|
0.5539
|
|
c-myc
|
424405
|
Myelocytomatoswas
|
8.3895
|
0.0012
|
|
Pfkl
|
427329
|
Phosphofructokinase
|
6.0835
|
0.0053
|
|
Pgk1
|
427956
|
Phosphoglycerate kinase-1
|
Not found
|
–
|
|
Pgam1
|
424483
|
Phosphoglycerate Mutase 1
|
Not found
|
–
|
|
Trp53
|
424011
|
Tumor suppressor p53
|
5.9049
|
0.0059
|
Regarding the glycolytic gene pathways, c-myc, hif-1a and aldolase-a (aldoa) were expressed both at time point of 4 and 8.5 months while lactate dehydrogenase, hexokinase-2 and pyruvate kinase M2 (PKM2) increased non significantly in DEN treatment when compared to BHT or control non-transgenic animals see Tables 3 and 4.
| Table 4. Shows the Microarray Analyses of the Whole Liver Genome of att-myc at 12-months Without Treatment of Up-regulation of hk1,slc1a5, slc5a1,slc1a4, slc1a2 and gpc1,3. While glut1, 2,3,4, slc38a2, gpc4, g6pc and hk2 were Reported Non-significant when Compared to BHT Treatment and Non-transgenic Mice |
|
Gene Symbol
|
T Cluster ID
|
Description
|
Fold Change
|
Differential Expression p value
|
|
Hk1
|
15275
|
Hexokinase-1
|
2.06880
|
0.022
|
|
Slc1a5
|
20514
|
Solute carrier family 1 member 5
|
8.498
|
0.0009
|
|
Slc5a1
|
20537
|
Solute carrier family 5 (sodium/glucose cotransporter), member 1
|
4.8465
|
0.015
|
|
Slc1a4
|
55963
|
Solute carrier family 1 (glutamate/neutral amino acid transporter), member 4
|
2.9
|
0.0009
|
|
Slc1a2
|
20511
|
Solute carrier family 1 (glial high affinity glutamate transporter), member 2
|
2.68
|
0.0001
|
|
Slc38a2
|
67760
|
Solute carrier family 38 member 2 (among its pathway glucose transport)
|
1.1012
|
0.5983
|
|
Slc2a1
|
20525
|
Glut1
|
2.0599
|
0.1129
|
|
Slc2a2
|
2056
|
Glut2
|
1.0098
|
0.9558
|
|
Slc2a3
|
20527
|
Glut3
|
1.7805
|
0.1104
|
|
Slc2a4
|
20528
|
Glut4
|
0.338
|
1.5796
|
|
HK2
|
15277
|
Hexokinase-2
|
3.1893
|
0.1963
|
|
Gpc1
|
14733
|
Glypican-1
|
0.0425
|
0.0425
|
|
Gpc3
|
14734
|
Glypican-3
|
3.8882
|
0.0425
|
|
Gpc4
|
14735
|
Glypican-4
|
1.0373
|
0.7924
|
|
G6pc
|
14377
|
Glucose 6 phosphatase
|
1.8741
|
0.0745
|
|
ALDOA
|
11674
|
Aldolase A
|
1.9602
|
0.0001
|
|
PKM2
|
18746
|
Pyruvate kinase M2v
|
0.0754
|
1.6485
|
|
LDHB
|
16832
|
Lactate dehydrogenase wasoform
|
2.3694
|
0.0618
|
|
Six1
|
427402
|
SIX Homeobox 1
|
2.1361
|
0.1221
|
|
HIF1a
|
432128
|
Hypoxemia inducing factor 1a
|
1.6606
|
0.0041
|
|
c-myc
|
424405
|
Myelocytomatoswas
|
32.049
|
0
|
|
Pfkl
|
427329
|
Phosphofructokinase
|
1.4353
|
0.0163
|
|
Pgk1
|
427956
|
Phosphoglycerate kinase-1
|
1.2137
|
0.0144
|
|
Pgam1
|
424483
|
Phosphoglycerate Mutase 1
|
1.2437
|
0.0341
|
|
Trp53
|
424011
|
Tumor suppressor p53
|
4.786
|
0.0002
|
DISCUSSION
The use of these animal models help to study the biology of the human tumor as well as the technology of geneexpression for discovering the genes that helpful for developing or testing anticancer therapeutic agents before the different stages of clinical evaluation safety.
It was previously reported by us7,16,17 that MicroCT, PET or joined MicoCT/PET for identification of acceleration liver tumor in ATT-MYC transgenic mouse model of liver cancer induced by DEN and validation of these finding by histopathological examination. While BHT fails to promote liver cancer in transgenic7,16,17 and in non-transgenic mice.21,22
False-positive echo was recorded by us in BHT treatment by MicroCT, while histopathological finding proof that BHT fails to promote liver tumor until 8.5-months and only induced large dysplastic nodules lined by endothelial cells.7 Notably, pet imaging was a goodtool as BHT treated transgenic mice had no evidence of glucose uptake until 8.5-months as well as control groups and also validated by histopathlogical examination previously. In contrast, the uptake of FDG could increase and in normal tissue, some tumors did not show FDG uptake.23
Interestingly, PET/CT imagining enables non-invasive information about tumor size, non-tumor tissue, metastasis, multiple tissue tumors7
and detected of the presence of tissue necrosis by hyper-intensity and hypo-intensity of FDG uptake.24 Also, DEN enhanced liver tumor growth and FDG uptake in a timedependent manner after the end of treatment.7
The gene expression in liver cancer and glucose uptake detected by PET imaging consider a new tools for study liver tumor.8 In the current study, GPC-3 was expressed in ATT-MYC mice at one year and at different time points after DEN treatment and correlated positively with the presence and size of the liver tumor as well as GPC3 expression was observed in 67.3% of HCC patients and 75.0% of them characterized by moderately differentiated HCC and the other with poorly differentiated HCC.9
Glut1 and hexokinase 1 were regulated in ATT-MYC mice at one-year and at a time point after DEN treatment and correlated positively with the presence and size of the liver tumor as a similar result seen in epidermal growth factor (EGF) hepatocellular carcinoma in a transgenic model of liver cancer10 or human liver cancer or in Hep G2.9 Also, there was a link between 18FFDG high uptake and the expression levels of the glycolytic pathway genes as GLUT1, hexokinase 1, 2, 3 in Primary macronodular adrenal hyperplasia.25 In contrast, GLUT1 expression does not correlate significantly with 18F-FDG uptake in colorectal carcinoma,26-28 neuroendocrine tumor,29 in thymic epithelial tumors30 and pancreatic tumor.31
Up withstanding to our result, the 18F-FDG uptake was increased in primary lung cancer promoted by DEN and c-myc promotion32 or HCC secondary metastases to lung tissue. Similarly, 18F-FDG uptake occurrence of colorectal hepatic tissue after hepatectomy.33 The cancer cells had characteristic features in their own metabolic process, such as the increasing uptake of glucose by tumor cells enhanced metabolic shifts to uncontrolled cell growth and survival.34 Also, the expression of aldoa gene as a glycolytic pathway in both liver tumors in ATT-MYC micetreated with or without DEN treatment was as a common feature of occurrence HCC.35 Notably, the overexpression of transcriptional factors, c-myc hypoxia-inducible factor and glycolytic enzymes were accompanied by poor prognosis and may be associated with resistance or failure of chemoradiotherapy in multiple gastrointestinal cancer cell types.36 So, the significance of the clinical impact of the Warburg effect in tumor growth reflects the important roles of inhibition of glycolytic pathway as significant biomarkers for predicting cancer prognosis and antitumor drug therapy37 especially with small interfering RNA (siRNA) as miR-338/PFKL.
CONCLUSION
There is a definitive correlation between genes responsible for glucose transport, 18F-FDG uptake in the early and advanced stages of liver cancer progressions such as glut1, HK1, GPC3 and other alternative pathways of glucose metabolism. This finding reveal the important roles of inhibition of the glycolytic pathway as antitumor drug therapy.
ACKNOWLEDGMENT
We thank Roman Haltera postdoctoral researcher who helped during the experimental part done in Fraunhofer Institute of Toxicology and Experimental Medicine (Hanover, Germany). Also, we thank Keritina Wiesner technician, who shared and helped in most of the exon-array experiment. Moreover, we had grateful to Tatiana Miere, a postdoctoral researcher, who supported us in learning gene expression on array track, X-RAY (version 3.2) software and the Excel add-in from Biotique Systems Inc (Reno, NV, USA).
CONFLICTS OF INTEREST
The authors declare that they have no conflicts of interest.


