PREMISE
World Health Organization (WHO) declared the COVID-19 outbreak a pandemic on March 11, 20201 due to a rapidly spreading worldwide of severe acute respiratory syndrome coronavirus 2 (SARS-CoV-2).2 In March 2020, Italy got the second-largest number of confirmed cases, after China. The Italian government introduced progressive infection-mitigation measurements on March 9 and March 11, 2020, to dramatically reduce social interactions and prevent virus spread.3,4 Contagion cases dramatically decreased during the following months. This led to progressively looser infection containment measures allowing free tourism and commerce-related exchanges among regions and mask-based socialization within coffee-bars, restaurants, pubs, and other gathering places while still adopting strict hand hygiene and proper inter-personal distancing. Unfortunately, as people interpreted that as fully regained freedom and, after a while, school reopening caused unrestricted use of public transportation, contagion rate progressively increased from August up to the present situation, which represents a severe challenge for our National Health Service (NHS) (Figure 1). However, the two periods of COVID-19 pandemic markedly differed from each other: between February and April, most cases occurred in Northern Italy, being the Central and Southern parts largely preserved while all regions appeared to be interchangeably under attack during the second infection wave (Figure 2).5,6
Figure 1. Cases of Confirmed SARS-CoV-2 Infection Reported in Italy, by Date of Sample/Diagnosis (green) and Symptom Onset (blue)
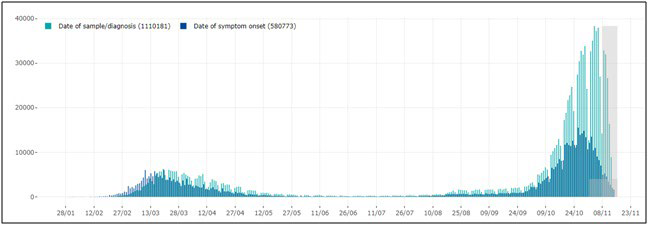
Note: More recent data (grey squares) should be interpreted with caution due to the possible reporting delay of more recently diagnosed cases and the possibility that cases with a date of onset within the reporting period may not have been diagnosed yet. (source: COVID-19 integrated surveillance data in Italy as of November 15, 2020, modified. (reference 10) https://www.epicentro.iss.it/en/coronavirus/sars-cov-2- dashboard. (source: COVID-19 integrated surveillance data in Italy as of November 15, 2020, modified.10
Figure 2. Cases of COVID-19: per 100.000 Population by Region/Autonomous Province of Diagnosis (blue); by the Province of Residence (orange); in the last 30-days, by Region/Autonomous Province of Diagnosis (red)
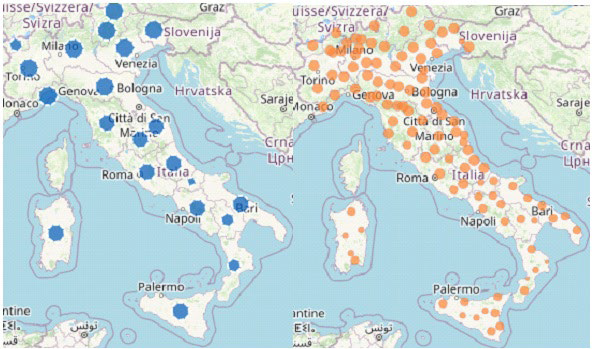
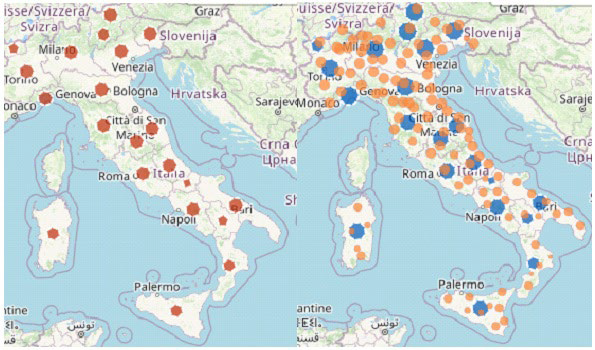
Source: COVID-19 integrated surveillance data in Italy as of15 November, 2020, modified.10
In April, the difference between the two national areas seemed to depend on unevenly distributed weather and pollution conditions.6,7 The latter were mostly due to pressing industrial activities involving the extensive use of public transportation by many workers undergoing long-term confinement within closed environments to provide our country with scheduled production rates.8 As reported by some authors, including ourselves, a few other factors might add to different contagion rates initially, including uneven tracking ability and implemented strategies against the viral spread.7,9
Frail Population: Patients on Dialysis with and without Diabetes
During the first period of the SARS-CoV-2 pandemic, we analyzed contagion rate in both a large cohort of patients and health care professionals, including auxiliary workers (HCWs) from 18 Southern Italy Nefrocenter Consortium dialysis centers (DCs). Our results10,11 were in agreement with those reported by the Italian National Institute of Health (NIH).12 Our interest in people on dialysis relied on the high prevalence of comorbidities expected to shorten life expectancy per se observed in such population, including type 2 diabetes mellitus (T2DM),13,14 arterial hypertension (AH) and cardiovascular disease (CVD) and on the high contagion risk entailed by repeated attendance of health care facilities.
There is some discrepancy between contagion prevalence (13.9%) and mortality rate (16.2%) in Chinese series15 and those reported in Italy (2.5%, except for Lombardy, where an average 7% death prevalence was reported, with a top 14% rate in Cremona).16 On adopting a prevention protocol in agreement with the Italian Nephrology Society (INS) recommendations17,18 and with Chinese experience,19 Nefrocenter Consortium DCs reported as low as 0.24% a prevalence and 0.12% a mortality rate (2 and 1 out of 825 patients, respectively).11 None got infected among the 351 health care personnel (HCP) members from the 18 DCs until April 23, 2020. The above observations support the high effectiveness of chosen contagion containment measures, especially considering repeated, long-standing exposure to promiscuity conditions of frail, immune-compromised individuals.20-25 However, the lower inflammatory cytokine levels reported in dialyzed patients might have also contributed to the relatively mild clinical course of COVID-19 observed in that period.26
Unfortunately, the second wave of COVID-19 pandemic is now quite different from the first one, by hitting all Italian regions almost equally with a high contagion rate both at home and in varying health care settings.27,28 Due to the consequent large number of apparently healthy carriers, the above protocol might prove less efficient than before.
Aim of Prevention Protocol and Infected Patient Management
Our study aimed to evaluate the efficiency of our previously described protocol11 under the new ubiquitous contagion conditions. The secondary outcomes were (i) SARS-CoV-2-infection mortality rate and risk factors; (ii) identifying further actions to be taken to provide SARS-CoV-2 positive dialyzed patients and HCP with undeferrable treatment in the 18 Campania region-located private Nefrocenter Consortium DCs contracted to the Italian NHS.
PROTOCOL
As defined according to INS recommendations28,29,30 and Chinese experience,19,31 the protocol has been running since the epidemic outbreak in Lombardy, i.e., February 20, 2020, to limit the spread of contagion among both patients and HCP directly or indirectly involved in dialysis-related activities. We already described protocol details,11 to which we added recommendations on the management of COVID-19 patients under the latest documents released by the Italian Ministry of Health (MoH), the ISS, and the WHO.32-34 Figure 3 provides a detailed protocol flowchart. As for the HCP, the latter was superimposable to the previous one oriented to people on dialysis,11except for eventually occurring COVID-19 dedicated DCs.
Figure 3. Identification and Management Flowchart of SARS-CoV-2 Positive Dialysis Patients
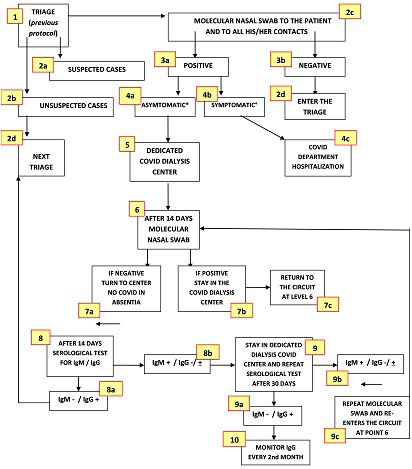
*Asymptomatic, pre-symptomatic or mild symptomatic infection (fever, cough, dysgeusia, dysosmia, headache, myalgia, in the absence of dyspnea and X-ray abnormalities (stage 1 and 2 according to NIH classification [64]); ° moderate, severe or critical illness according to the same classification.
METHODS
On April 23 and November 13, 2020, 381 HCP members underwent regular monitoring (Table 1), while dialysis patients ranged 825 to 873 according to the expected shifting prevalence over time (mean±SD: 853±30 per month throughout the 6.5-months). Overall Italian all-cause mortality rate was 11.8% in April and 14.8% in November vs. a.
| Table 1. General Features of Subjects on Chronic Dialysis as of April 23, 2020, and Co-Morbidities Observed According to Diabetes Status. *IHD/AF/HF=Composite Outcome: Ischemic Heart Disease/ Atrial Fibrillation/ Heart Failure. Data Expressed as Mean+SD, Range, or n; (%). In No Case were HIV Infection, Autoimmune Disease, and Obesity Present |
|
OverAll (n. 873)
|
T2DM yes (n. 332) |
T2DM no (n. 471) |
p
|
| Sex M/F (%) |
52/48
|
47/53 |
51/47 |
n.s.
|
| Age years |
66.5+5.3
|
76.5+3.6 |
64.6+3.2 |
<0.05
|
| BMI kg/m2 |
23.5+2.3
18.8 – 29.4
|
25.2+3.6
19.5-29.4 |
21.5+1.8
18.8-26.5 |
<0.05
|
T2DM (%)
On Insulin
On other |
332(38.03) 252(75.90) 80(24.10)
|
– |
– |
–
|
| Comorbidities n (%) |
| IHD/AF/HF * |
398 45.99
|
(51.85) |
(42.31) |
<.01
|
| Stroke |
183
(20.96)
|
(23.11) |
(18.09) |
n.s.
|
| Chronic Obstructive Pulmonary Disease |
209 23.94
|
25.52 |
20.90 |
<.05
|
| Arterial Hypertension |
585 67.01
|
59.72 |
39.54 |
<.01
|
| Active Cancer in the past 5 years |
2 0.23
|
– |
|
–
|
| Dementia |
36 4.12
|
3.85 |
3.94 |
n.s.
|
| Chronic Liver Disease |
175 20.05
|
23.61 |
17.33 |
<.01
|
| Respiratory Failure |
148 16,95
|
17.61 |
15.42 |
n.s.
|
Following Italian MoH recommendations, suspect cases underwent oro-pharyngeal swabs for virus detection using ribonucleic acid (RNA) polymerase chain reaction (PCR).3-5 Those found positive were then carefully followed-up with quantitative IgM- and IgG-based serologic tests.34-36
To define COVID-19 disease severity, we chose the NIH classification37 as the most suitable one in our clinical setting, heavily clogged with hectic health care activities.
T2DM diagnosis and comorbidities/complications related to DM relied on criteria defined by the ADA Standards of Medical Care in Diabetes 201938 and on the International Classification of Diseases, Clinical Modification (ICD-9-CM, V82.9 2014),39 respectively.
The study was conducted following the Helsinki Declaration 1975 and subsequent amendments. The protocol was approved by the Ethics Committee of the University of Campania “Luigi Vanvitelli” on June 3, 2020 (Protocol Registration N. 1394- b) as follow-up of previous paper, already approved on April 30, 2020 (protocol registration n. 1394), and published on the same Journal.11
It was formally approved by the Ethics Committee of the University of Campania “Luigi Vanvitelli” on April 30, and again for the present analysis as an extension of the previous approval on November 3, 2020. According to good clinical practice guidelines, the data was processed anonymously, and no patient started the study before signing informed consent. All the subjects enrolled signed the informed consent.
Results, expressed as mean±SD or %, relied on the utilization of the Statistical Analysis System (SAS) Program (Release 9.4, SAS Institute, Cary, NC, USA), which also allowed to perform the chi-square test with Yates correction or Fisher Exact test for categorical variables, as well as the analysis of variance for repeated measures (rANOVA) supplemented by the two-tailed Student’s ttest or Mann-Whitney U-test with 95% confidence intervals (CI) for parametric variables or nonparametric variables, respectively. The least acceptable significance level was set at a p<0.05.
RESULTS
In Italy the two periods of the pandemic were characterized by a strong association between mortality rate and often intertwined comorbidities, mostly represented by AH, Type 2 DM (T2DM), ischemic heart disease (IHD), and chronic kidney disease (CKD).5,10 As reported in Table 2, while showed no significant period-dependent differences, data from the ISS on mortality rate and factors associated with COVID-19 pointed to co-existing comorbidities, mostly represented by the AH, T2DM and CKD triplet, as an extremely unfavorable prognostic factor.
| Table 2. Most Common Co-morbidities Observed in SARS-CoV-2 Positive Deceased Patients |
|
Data Available on April 23, 2020 (*)
|
Data Available on November 13, 2020 (°) |
| Diseases |
N |
% |
N |
%
|
| Ischemic Heart disease |
562
|
27.5 |
1449 |
27.7
|
| Atrial Fibrillation |
450
|
22.0 |
1266 |
24.2
|
| Heart Failure |
328
|
16.1 |
858 |
16.4
|
| Stroke |
228
|
11.2 |
595 |
11.4
|
| Hypertension |
1410
|
69.1 |
3441 |
65.7
|
| Type 2 Diabetes |
647
|
31.7 |
1531 |
29.3
|
| Dementia |
307
|
15.0 |
1148 |
21.9
|
| COPD (Chronic Obstructive Pulmonary Disease) |
350
|
12.1 |
895 |
17.1
|
| Active Cancer in the past 5 years |
328
|
16.1 |
896 |
17.1
|
| Chronic Liver Disease |
81
|
4.0 |
244 |
4.7
|
| Chronic Renal Disease |
431
|
21.1 |
1099 |
21.0
|
| Dialysis |
43
|
2.1 |
109 |
2.1
|
| Respiratory Failure |
110
|
5.4 |
345 |
6.6
|
| HIV Infection |
5
|
0.2 |
11 |
0.2
|
| Autoimmune Diseases |
76
|
3.7 |
223 |
4.3
|
| Obesity |
249
|
12.2 |
541 |
10.3
|
| Number of Co-morbidities |
| 0 |
74
|
3.6 |
174 |
3.3
|
| 1 |
294
|
14.4 |
682 |
13.0
|
| 2 |
431
|
21.1 |
988 |
18.9
|
| 3 |
1242
|
60.9 |
3390 |
64.8
|
| Total subjects |
2041
|
100.0 |
5234 |
100.0
|
| (*) Source12;, (°) Source10 |
Table 1 shows our 873 patients’ general features as of November 2020 and differences among main comorbidities as referred to the presence/absence of T2DM. People with T2DM were older and had a higher BMI and comorbidity rate except for dementia, stroke, and respiratory failure (p<0.05); those on insulin were 77.9%. Results were almost superimposable to those we observed in April 2020.
Table 3, comparing SARS-CoV-2 contagion data from both periods, shows the strikingly different infection prevalence occurring within the HCP (n=75 vs. 0) despite strict compliance to the prevention protocol within all DCs over time. However, SARS CoV-2 positive HCP had only mild symptoms (NIH classification scores 1-2).35 if so ever (thus requiring no hospitalization). Based on triage and tracking investigations, they had got mostly infected outside the DCs, mainly when spending August-September holidays in places characterized by a high virus circulation rate.
| Table 3. Comparison between the First and the Second Period of SARS-CoV-2 Pandemic within the 18 Campania Region Dialysis Centers from the Nefrocenter Consortium. HCW=Health Care Auxiliary Workers |
|
1st Period
|
2nd Period
|
|
April 23, 2020
|
November 13, 2020
|
p
|
|
n
|
SARSCoV-2 Negative |
With Symptoms (%) |
Dead n. (%) |
n |
SARSCoV-2 Negative |
With Symptoms (%) |
Dead n. (%) |
|
| Physicians |
93
|
93 |
– |
0 |
93 |
69 |
0 |
0 |
<0.01
|
| Nurses |
151
|
151 |
– |
0 |
151 |
103 |
0 |
0 |
<0.05
|
| Head nurses |
20
|
20 |
– |
0 |
20 |
20 |
– |
– |
–
|
| HCWs |
48
|
48 |
– |
0 |
48 |
1 |
0 |
0 |
n.s.
|
| Drivers |
54
|
54 |
– |
0 |
54 |
52 |
0 |
0 |
n.s.
|
| Other employees |
15 |
15 |
– |
0 |
15 |
15 |
– |
– |
–
|
| Dialysis patients |
825
|
823 |
2 (0.24) |
1 (0,12) |
873 |
784 |
22 (2.52) |
19 (2.18) |
<0.0001 |
More patients showed to be infected in November than in April (2 out of 825 people; 0,24%) as well, summing up to 89 out of 873 people (10.19%). As many as 22 patients from the November cohort required hospitalization for moderate-severe symptoms (24.7% of the 89 SARS-CoV-2 positive subjects and 2.5% of the whole attending population), with death unavoidably coming in 19 (86.3% of hospitalized and 21.3% of infected patients) compared to the only one recorded in April (0.12%).
Table 4 shows differences among SARS-CoV-2 positive (n=89) and negative (n=784) patients as for type and number of comorbidities, compared to those from ISS reports issued before the pandemic (Table 2). No HIV infection, autoimmune disease, or obesity cases were present in our population. The prevalence of all comorbidities was significantly higher in SARS-CoV-2 positive patients except for cancer (we avoided statistics for the too few [only two] active cases reported during the past five years). Also, all SARS-CoV-2 positive patients, compared to only 61.8% of SARSCoV-2 negative ones, suffered at least three comorbidities.
| Table 4. Most Common Co-morbidities Observed in SARS-CoV-2 Positive Patients Compared to Negative Ones in the Second Pandemic Period (1st August-13th November). In No Case were HIV Infection, Autoimmune Disease, and Obesity Present. *IHD/AF/HF=Composite outcome=Ischemic Heart Disease/ Atrial Fibrillation/ Heart Failure |
|
SARS-CoV-2 positive patients (n. 89)
|
SARS-CoV-2 negative patients (n. 784) |
|
|
|
N%
|
N% |
p |
Total n.
|
| Comorbidities |
| IHD/AF/HF * |
12 69.16
|
386 49.23 |
<0.0001 |
398
|
| Stroke |
7 7.87
|
176 22.45 |
< 0.001 |
183
|
| Arterial hypertension |
76 85.39
|
509 64.92 |
< 0.01 |
585
|
| Type 2 diabetes mellitus |
79 88.76
|
253 32.40 |
<‘0001 |
332
|
| Chronic obstructive pulmonary disease |
31 34.83
|
178 22.70 |
< 0.01 |
209
|
| Active cancer in the past 5 years |
2 2.25
|
0 – |
– |
2
|
| Dementia |
9 10.11
|
27 3.44 |
< 0.05 |
36
|
| Chronic liver disease |
19 21.35
|
156 19.90 |
n.s. |
175
|
| Respiratory failure |
14 15.73
|
134 17.59 |
n.s. |
148
|
| Number of Comorbities |
|
0
|
0 – |
5 0.64 |
– |
5
|
|
1
|
0 – |
105 13.39 |
– |
105
|
|
2
|
0 – |
189 24.11 |
– |
189
|
|
3 at least
|
89 100.00 |
485 61.86 |
<‘0001 |
574
|
DISCUSSION AND CONCLUSION
From the analysis of the two pandemic periods, quite different pictures arise. During the first wave, due to government directives and the ubiquitous fear of a virus, which was unknown even to the experts, the whole population strictly observed contagion prevention strategies. As a result, the virus spread kept at low-levels in Italy, despite significant differences between the Northern regions and the others,40,41 despite reported long-term persistence of viral particles and a potentially high infection risk within health care facilities.41-43
The lack of any contagion signs among the HCP while detecting only two infected patients in the DCs during the first period11 seems to support both the favorable environmental condition outside DCs and the effectiveness of containment’s protocol adopted inside the DCs.11 The explanation for that seemed to rely on the hypothesized large removal of the already reduced inflammatory storm-related cascade of cytokines by dialysis44 produced by the defective immune system characterizing people with CKD19 during the acute phases of SARS-CoV-2 infection.37 Of course, all the above could not nullify but only mitigate CKD patients’ comorbidity-related frailty and high mortality rate reported by the ISS.10
On the opposite, SARS-CoV-2 positive HCP members and patients found during the second wave of the pandemic were quite many, yet, being infection severity negligible among the HCP, a high prevalence of cases of moderate-severe symptoms leading to hospitalization was recorded among patients. Only 13.4% of the HCP (n=14) was over 50-years of age vs. 100% of patients. Only 36.0% of the infected HCP had one comorbidity (invariably AH), while 100% of infected patients suffered at least three comorbidities. Apropos of that, our data support the strong association found by the ISS in the Italian population between at least three combined comorbidities and the high morbidity and mortality rate of people on dialysis.45,46,47
How to explain the considerable difference observed between the two periods? On displaying pandemic trend in Italy since the very beginning, Figure 1 depicts the exponential rise observed in November, and Figure 2 provides evidence of the ubiquitous virus spread. In other words, the positive effect of lockdown performed in spring 2020 vanished after summertime containment measure loosening. Media repeatedly and uselessly stigmatized unstoppable dangerous behaviors, including thoughtless aggregation of many people, totally disregarded social distancing and failure to wear masks despite numerous infected people identified daily all over Europe. In greater detail, during the summer discos opened again everywhere in Europe and especially in Sardinia (an almost COVID-free region until mid-August), international travel exchanges started again. Simultaneously, more and more events, including festivals, funerals, mass religious celebrations/processions, and political gatherings, involved hundreds of people, and school reopening overcrowded public transportation – thus hindering social distancing during rush hours. All phenomena mentioned above made the virus spread much faster than before, especially in the presence of many, mostly young, asymptomatic infected people who largely hindered effective tracking despite ever-updated safety protocols issued at regular intervals.48-51 To overcome this problem, the Italian government offered the IMMUNI App for smart phones associated with Bluetooth Low Energy technology for free in order to track suspected cases and identify contacts with SarsCoV-2 positive people.42 However, due to privacy concerns, only a few people felt confident enough to download and use the App, thus nullifying such a nation-wide strategy.52
All this shows how contagion containment measures adopted by our DCs were not enough to fight the global infection risk pending on the whole Italian social community around. The most evident proof of this is the fact that, opposite to what we observed during the previous period, many HCP members “imported” the SARS-CoV-2 virus from highly infected touristic places before the second wave. Since early September 2020, the Nefrocenter Consortium adopted an add-on protocol meant to identify, track and monitor suspected cases, and thus stop contagion spread within its DCs by identifying and isolating suspected cases and their contacts. It also organized COVID-dedicated DCs to keep patients on dialysis, as suggested by other experiences,53-57 while reinforcing safety procedures for the sake of health personnel, patients, and relatives.
In conclusion, we now summarize lessons learned from such stressing experience to help the scientific community take the weighty responsibility of assisting dialyzed people appropriately and safely in times of COVID-19 contagion:
1. CKD patients are frail and as susceptible to SASR-CoV-2 as anybody else;
2. The impaired immune responsivity, despite possible pro-inflammatory cytokine clearance provided by dialysis, might not prevent CKD patients from undergoing severe/lethal consequences;
3. The high comorbidity rate is an unfavorable factor increasing the risk of clinically severe infections eventually leading dialysis patients to hospitalization;
4. Patients chronically undergoing dialysis have a very high-risk of dying after hospitalization for moderate/severe infection symptoms;
5. Environmental circulation of SARS-CoV-2 virus also dramatically increases contagion rate in dialysis units independently of highly effective safety protocols complying with current recommendations from local and national health institutions;
6. However, adopting a suitable surveillance and monitoring protocol for suspected/infected subjects grants an effective contagion tracking activity, thus preventing local COVID-19 outbreaks within DCs.
LIMITATIONS
The present study suffers the main limitation of being based on a single Italian region endowed with a socio-economic reality somewhat differing from other ones characterized by equally relevant virus circulation rates, further exacerbated by highly concentrated industrial activities and massive use of means of transport.
However, its multicenter structure and the large size of its population allow for reliable, updated results. Also, it deserves credit for warning dialysis specialists about the fact that, despite proving effective for the HCP, prevention protocols could fail to protect the frailest patients with T2DM from the effects of an aggressive outer environment.
ACKNOWLEDGEMENTS
We acknowledge the logistic support of Nefrocenter Research Network & Nyx, research startup, Naples, Italy.
INFORMED CONSENT
Written informed consent was obtained from all participants before enrollment.
FUNDING
The study did not have a sponsor/funder. Nefrocener Research Network & Nyx Statrup paid only the printing costs in a nonconditioning way.
AUTHORSHIP
All named authors meet the International Committee of Medical Journal Editors (ICMJE) criteria for authorship for this article, take responsibility for the integrity of the work as a whole, and have given their approval for this version to be published.
AUTHOR’S CONTRIBUTION
SG, ES, CR and FS created the paper and wrote it. CA, TDC, MP critically read the paper. All have complied with data collection, critically assessed the results, and approved the final text. All collaborators critically read and approved the final text.
STUDY INVESTIGATOR
For full investigator list see the Appendix.
COMPLIANCE WITH ETHICS GUIDELINES
This study was conducted in conformance with good clinical practice standards. The study was led in accordance with the Declaration of Helsinki 1975, as revised in 2013. Written informed consent was obtained from all participants before enrollment.
The protocol was approved by the Ethics Committee of the University of Campania “Luigi Vanvitelli” on June 3, 2020 (protocol registration n. 1394-b) as follow-up of previous paper, already published on the same Jornal “COVID-19, DIABETES AND DIALYSIS: AN INTERNAL MEDICINE CONUNDRUM: Proposal for a suitable and easy-to-handle prevention protocol” (reference 11).
DATA AVAILABILITY
The datasets analyzed during the current study are available from the corresponding author on reasonable request.
CONFLICTS OF INTEREST
The authors declare that they have no conflicts of interest.


