INTRODUCTION
Heavy metal contamination in aquatic environment is a critical concern, due to toxicity of metal and their accumulation in aquatic habitats. Heavy metals, in contrast to most pollutants, are not biodegradable and they undergo a global ecological cycle in which natural waters are the main pathways.1 A large part of the heavy metal input ultimately accumulates in the estuarine zone and continental shelf, since these areas are important sinks for suspended marine and associated land-derived contaminants.2
Food safety is a major public concern worldwide especially in a country like Bangladesh where population is a great problem. The increasing demands for food and food safety have drawn the special attention of researchers to the risks associated with consumption of contaminated foodstuffs i.e. pesticides and heavy metals.3,4 Heavy metal contamination is a major problem of the environment as they are one of the major contaminating agents of the food supply.4 This problem is receiving more and more attention all over the world, in general and in developing countries in particular. Among the heavy metals some are toxic such as Cd, Pb, Cr, Hg, As, etc. and some are essential such as Fe, Zn, Mn, Cu, Ni, Co, Si, etc. The biological half-lives of these heavy metals are non -biodegradable and thermo-degradable and thus their accumulation readily reaches to the toxic levels.5 They have the potential to accumulate in different body organs and thus produce unwanted side effects.6,7,8
Kalurghat area in the port city, Chittagong, Bangladesh has grown up as a rapidly expanding industrial area in the country. Different industries were set up there according to the data of Chittagong Chamber of Commerce and Industry. These industrial units directly discharge untreated toxic effluent into Karnaphuli river9 and hence metals remain in the ecosystem eventually move from one compartment to the other within the food chain. These toxic metals not only pollute the river waters but also pose a threat to the aquatic biota. The increase in residue levels of heavy metal content in water and biota will result in decreased productivity and increased health risk in case of human beings. For better understanding of heavy metal sources, their accumulation in the water seems to be particularly important issues of present-day research on risk assessments. The water and food reserves and resources of Bangladesh have not been considered seriously for long time and hence extensive and comprehensive research on the pollution of fish as well as vegetable samples grown in contaminated water is urgently needed. Present study was therefore sketched to quantify the level of heavy metal accumulation by water, fish and vegetable samples collected from the kalurghat heavy industrial area at Karnaphuli river under Chittagong district, Bangladesh and to assess the possible health risk that may associate due to dietary intake of those foodstuffs.
MATERIALS AND METHODS
Study Area
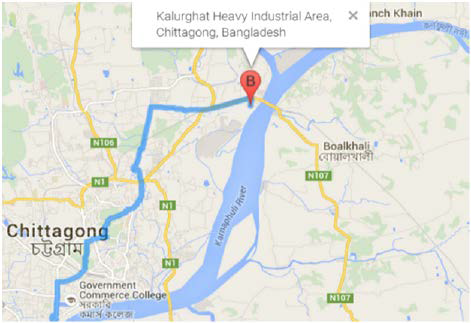
The study has been carried out in Karnaphuli river near Kalurghat heavy industrial area (Figure 1) located in 5 no. Mohra ward sublocality, Chittagong District, Bangladesh. 22º23’48.66’’ latitude and 91º52’59.22’’ longitude can be mapped to closest address of kalurghat heavy industrial area, Chittagong, Bangladesh (Figure 1). Kalurghat area is loaded with huge number of industries, most of which discharge their effluents in the Karnaphuli river without any prior treatment, unthinkable in these days. Even more, Karnaphuli is being polluted by agricultural runoff resulting in reduced amount of oxygen available and thus harming aquatic life in the river. Vegetable samples, usually irrigated by the river water, were collected from embankment of the river in addition to the different variety of small fishes and surface water collected directly from the river.
Figure 1. Map of the Study Area
Water Sample Collection
Ten water samples (500 ml) were collected in March 2015 along the downstream of river (Rw-1, Rw-2, Rw-3, Rw-4, Rw-5, Rw6, Rw-7, Rw-8, Rw-9, Rw-10) which started from CNB drain (a drain next to Chandgaon Kalurghat heavy industrial area) that carries most of the effluents of Kalurghat industrial area. Starting point of water sample collection was the junction of the river and drain. Others were collected 10, 20, 30, 40, 50, 60, 70, 80, and 90 m away from the starting point. During sampling, cleaned plastic bottles rinsed three times with river water were used to obtain representative samples. Water samples were collected from about 10 cm depth of surface water to avoid air penetration. pouvoir hydrogène (pH), electrical conductivity (EC), total dissolved solid (TDS), temperature and salinity of water samples were measured in-situ and rest were preserved with 10% nitric acid in refrigerator for further analysis.
Collection of Vegetable and Fish Sample
A total of six vegetable samples viz; brinjal (Solanum melongena), cucumber (Cucumis sativus), tomato (Lycopersicon esculentum), string bean (Vigna sesquipedalis), lady’s finger (Hibiscus esculentus), Hyacinth bean (Lablab niger) and five species of fish samples localy named kachki fish (Coricasoborna), poa fish (Otolithoides pama), chingri fish (Macrobracium lamarre), chiring fish (Apocryptes bato), shamuk (Neritaspengleriana) were randomly collected in triplicate, from different locations of the study area during the period of March to April 2015. The samples were tagged with proper identification number and carried to the laboratory for analysis.
Water Sample Preparation
For X-ray fluorescence (XRF) measurement of elements, a volume of 500 ml of each collected water sample filtered with Whatman 41 filter paper was taken in a clean weighed porcelain dish followed by addition of 2 gm of cellulose powder (analar grade) and evaporated on water bath. The sample after evaporation to dry mass was further dried under IR lamp at about 70 ºC for two hours to remove the trace of moisture and weighed. For homogeneous mixing, the dry mass was then transferred to a carbide mortar and ground to fine powder using a pestle. Each powdered sample was pressed into a pellet of 2.5 cm diameter with a hydraulic press pellet maker (Specac) using 10 tons of pressure.
Preparation of Vegetable and Fish Sample
The vegetable samples were cut into suitable pieces with a stainless steel knife, washed first with tap water several times and rinsed with deionized water three times. The inedible parts of all fish samples were removed with a stainless steel knife. The remaining edible part of the samples were washed with tap water repeatedly and then rinsed with deionized water three times. All vegetables and fish samples were then taken into porcelain dishes separately. Each dish with particular sample was marked with an identification number and placed in an oven at around 70 ºC for overnight drying which was continued until a constant weight was obtained. The dried mass of each sample was then transferred to a carbide mortar and ground to fine powder using a pestle. Each powdered sample was pressed into a pellet of 2.5 cm diameter with a hydraulic press pellet maker (Specac) using 10 tons of pressure.
Measurement of Physicochemical Properties
pH, EC, TDS, temperature and salinity were determined by using Multimeter HACH-USA-Sension 378 which is equipped with glass electrode. The electrode is rinsed and calibrated with distilled water. Meter was kept in gentle position through the water column while a reading was being taken.
Sample Analysis
Sample irradiation with X-ray beam: Energy Dispersive X-ray Fluorescence (EDXRF) Spectrometer (Model: Epsilon 5) was used as major analytical technique for determining elemental concentration. The irradiation of all real samples was performed by assigning a time-based programmed, controlled by a software package provided with the system. The standard materials were also irradiated under similar experimental conditions for construction of the calibration curves for quantitative elemental determination in the respective samples. The generated X-ray spectra of the materials were stored into the computer.
Construction of calibration curve and method validation: A direct comparison method based on EDXRF technique was used for elemental concentration measurement.10 In comparison method, standards are set to construct the calibration curves. Again key to this comparison method is that both the standard and the samples have to be of similar matrix, so that they can produce identical sensitivity and thus matrix effects are nullified. Hence to comply with the fact, three lab-synthesized cellulose-based multi element standards (cellu-1, cellu-2, and cellu-3) were used to construct the calibration curves11 for carrying out elemental analysis in water samples. The calibration curve constructed for each element was based on its K X-ray and L X-ray line sensitivity as a function of its atomic number. To justify the accuracy of the curves, a groundwater sample were analyzed under the constructed calibration curve and in another method named total reflection X-ray fluorescence (T XRF) respectively. All the results were found within the acceptable limit.12 For vegetables and fish samples, precision and accuracy of the method was checked through analysis of spinach/NIST 1570a and tuna fish homogenate/IAEA-350 respectively. Obtained values were found in good agreement with the certified values and the percentage of relative error and coefficient of variation in almost all the elements were less than 10%.13,14
Data Analysis
Metal pollution index: Metal Pollution Index (MPI) was computed to determine overall heavy metal concentrations in different food stuff analyzed. This index was obtained by calculating the geometrical mean of concentrations of all the metals in different food stuff15 following the equation bellow:
MPI (mg kg-1)=(Cf1 x Cf2 x……Cfn ) 1/n
Where Cfn =Concentration of n number of metal in the sample.
Health risk index (HRI): The health risk index was calculated as the ratio of estimated exposure of test vegetables and fishes and oral reference doses.16 The oral reference doses (Rf D) represents an estimation of the daily exposure of a contaminant to which the human population may be continually exposed over a lifetime without an appreciable risk of harmful effects. Oral reference dose for Cr, Ni, Cu, Pb, Mn and Zn were 1.5, 0.02, 0.04, 0.004, 0.033 and 0.30 (mg/kg bw/day) respectively;17 10-60 (mg/kg bw/ day) for Fe;18 0.002 (mg/kg bw/day) for Hg.19
The Rf D for inorganic arsenic is 0.0003 (mg/kg bw/day) based on hyper pigmentation, keratosis and possible vascular complications in human.20
The estimated daily intake (EDI) of each metal in this exposure pathway is calculated by the equation:

here, Cmetal, Dfood intake, and Baverage weight represent the heavy metal concentrations in foodstuff (mg kg-1), daily intake of foodstuff and average body weight, respectively. According to the food consumption, survey,21 Bangladeshi people per person per day consumes vegetable: 0.089 kg/day22 and fish: 0.03 kg/ day.23 The average body weight (baverage weight) was taken 70 kg for adults according to World Health Organization (WHO).24
Health risk of consumers due to intake of metal contaminated foodstuffs was assessed by using HRI. A HRI greater than 1 means the exposed population is unlikely to experience obvious adverse effects; whereas a HRI bellow 1 means that there is a chance of non-carcinogenic effects, with an increasing probability as the value increases. The HRI was calculated by using the equation suggested by Wang et al.25
HRI=DIM/RfD
It has been reported that exposure to two or more pollutants may result in additive and/or interactive effects. The hazard index (HI) of heavy metals for individual foodstuff was also calculated which is the arithmetical sum of the individual metal HRI26:
Hazard Index (HI)=HRI (toxicant 1)+HRI (toxicant 2)+. . . HRI (toxicant n)
Statistical Analysis
To assess the contamination level of heavy metal, mean, minimum, maximum and standard deviation of water, fish, and vegetable samples were performed using Microsoft Excel (version 2007).
RESULTS AND DISCUSSION
Physicochemical Properties in River Water
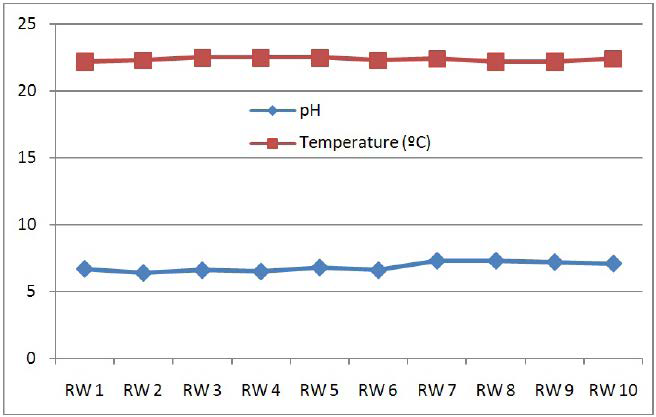
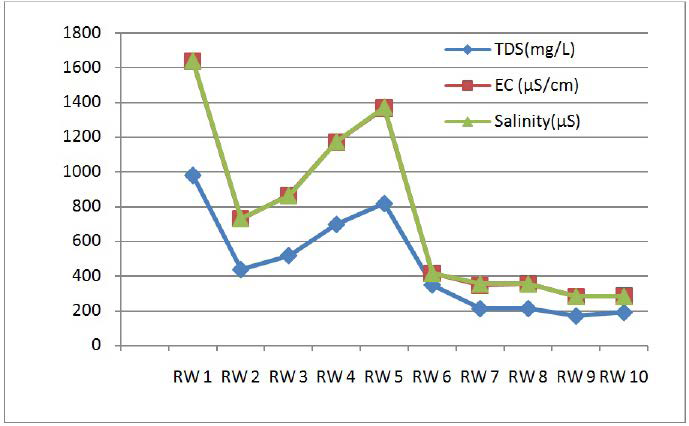
The physicochemical properties for river water are shown in Table 1 and Figure 2. The pH value of the study area ranges from 6.4 to 7.3 and the highest pH was observed for point RW-8 (70 m away from RW-1). Most fish can tolerate pH value of about 5.0 to 9.0 and hence pH value of water is in comfortable range for aquatic life. The level of total dissolved solid fluctuates between 190 to 979 mg/L. The highest value was observed for RW-1 (at the junction of CNB drain and Karnaphuli river) while the least value was detected at point RW-10 (90 m away from RW-1). Excessive TDS value can reduce water clarity, hinder photosynthesis, and lead to increased water temperature. However, the TDS value recorded in the entire points were within the WHO guideline of 1000 mg/L for the protection of fisheries and aquatic life and for domestic water supply. EC and salinity ranges from 282-1368 µS/ cm and 283-1372 µS respectively. Department of environment (DoE) of Bangladesh, suggested value for EC in drinking water (also called BD Standard) is 320 µS/cm which is high enough in the present study which may be due to the fact that Bay of Bangle is only 40 km away from the sampling site. It is found that physicochemical properties in river water except EC and salinity are within the DoE suggestive value for drinking water. Temperature of water in the river was found uniform.
| Table 1. The Physicochemical Properties of Karnaphuli River Water |
| Sample ID |
pH |
TDS (mg/L) |
Electrical Conductivity (µS/cm) |
Salinity (µS) |
Temperature |
| RW 1 |
6.7±0.2 |
979±19 |
1637±23 |
1640±27 |
22.2±0.1 |
| RW 2 |
6.4±0.2 |
437±23 |
730±29 |
731±21 |
22.3±0.1 |
| RW 3 |
6.6±0.2 |
518±17 |
865±21 |
864±24 |
22.5±0.1 |
| RW 4 |
6.5±0.2 |
697±18 |
1172±19 |
1175±19 |
22.5±0.1 |
| RW 5 |
6.8±0.2 |
817±14 |
1368±23 |
1372±12 |
22.5±0.1 |
| RW 6 |
6.6±0.2 |
349±20 |
416±18 |
416±25 |
22.3±0.1 |
| RW 7 |
7.3±0.1 |
212±23 |
346±11 |
355±13 |
22.4±0.1 |
| RW 8 |
7.3±0.1 |
213±22 |
355±12 |
355±11 |
22.2±0.1 |
| RW 9 |
7.2±0.1 |
170±22 |
282±18 |
283±19 |
22.2±0.1 |
| RW 10 |
7.1±0.1 |
190±17 |
284±19 |
283±17 |
22.4±0.1 |
Figure 2. Physico Chemical Parameters in Water Samples of Karnaphuli River
Concentration of Heavy Metal in Water
The concentration (Table 2) of Cr in river water ranged from 0.151 to 0.178 mg/L, which is much higher than the drinking water standard (0.050 mg/L) set by WPCB WHO24 and technical remote viewing (TRV) (0.117 mg/L) assigned by United States Environmental Protection Agency (USEPA). Concentration of Cr in surface water at Kalurghat of Karnaphuli river was observed 0.809 mg/L by Das.27 The value of manganese ranged from 0.053 to 0.237 mg/L in water sample, which exceeds both drinking water standard (0.1 mg/L) assigned by TRV (0.12 mg/L) and WHO,22 (0.5 mg/L). The values of Fe in water ranges from 1.534 to 4.520 mg/L, thus at all points it exceeded both drinking water standard (0.3 mg/L) assigned by ECA28 and TRV (1 mg/L) by USEPA. Das et al27 reported the concentration of Fe is 35.325 mg/L at Kalurghat, which is much higher than the present value. The value of Nickel ranges from 0.001 to 0.006 mg/L which is within drinking water standard (10 mg/L) assigned by WPCB, TRV (0.052 mg/L) by USEPA and permissible limit of 0.02 mg/L given by WHO.24 Das et al27 observed the concentration of Ni 0.685 mg/L at Kalurghat. So it is apparent that the concentration of Ni found in the Kalurghat area is not harmful. The value of Copper ranged from 0.010 to 0.023 mg/L which is within the permissible limit (1 mg/L) set by the ECA28 but higher than TRV value (0.009 mg/L) at all points, on the other hand all points are within the WHO, 2003 recommended value (2 mg/L), whereas Das et al27 reported 0.711 mg/L of Cu in water at Kalurghat. The concentration of Zn ranges from 0.003 to 0.045 mg/L which is within drinking water standard (5 mg/L) and Zn in the investigated water course showed lower than the recommended value of 5 mg/L according to WHO.24 In a previous study, it was observed27 that the concentration of Zn was 0.731 mg/L at Kalurghat. The concentration of As in river water at different points ranges from 0.001 to 0.006 mg/L, which was within the safe limit for drinking (0.05 mg/L) assigned by ECA 199528 and TRV (0.15 mg/L) by USEPA. The concentration of Hg, ranges from 0.001 to 0.006 mg/L, exceeds both drinking water standard (0.001 mg/L) assigned by ECA 1995 and TRV (0.000012 mg/L) by USEPA and highest concentration of Hg was found in RW-7 (60 m away from RW-1) and lowest in RW-5 (40 m away from RW-1), showed a random distribution in water. The concentration of lead in the water sample ranges from 0.001 to 0.005 mg/L. Highest concentration was found at RW-4 (30 m away from RW-1) and lowest at RW-9 (80 m away from RW-1) showing a gradual decrease to the downstream points but Lead concentrations at all the points exceed the TRV assigned value by USEPA (0.0025 mg/L). In a study Das et al27 reported, concentration of Pb in surface water at Kalurghat area of Karnaphuli river was 0.772 mg/L which was higher than the present study.
Heavy Metal in Aquatic Animal
Some aquatic fish collected from Karnaphuli river locally known as kachki (Coricasoborna), poa (Otolithoides pama), chingri (Macrobracium lamarre), chiring (Apocryptes bato) and aquatic animal locally known as samuk (Neritaspengleriana) are analyzed for heavy metals. The results obtained are shown in Table 3. Value of Chromium (Cr) ranges from 14.0 (Neritaspengleriana) to 16.3 (Coricasoborna) mg/kg respectively and all values of Chromium was found higher than the WHO standard22 of 0.05 mg/kg. Islam et al29 found highest concentration of Chromium in chiring fish (Apocryptes bato). Cr is an essential trace element in human and some animal but in excess, it could have undesirable lethal effect on fish and wildlife. Estimated Manganese (Mn) ranged from 14.1 to 216.1 mg/kg. Highest concentration was found in Samuk (Neritaspengleriana) and lowest in Kachki fish (Coricasoborna) but all values of Mn were found higher then WHO Standard22 of 0.01 mg/kg. Among the heavy metals analysed, Fe was found as the most abundant. Its lowest and highest amount was found in poa (Otolithoides pama) (51.9 mg/kg) and samuk (Neritaspengleriana) (319.9 mg/kg) respectively. Akoto et al30 reported a lower value of Iron in fishes from Fosu Lagoon, Ghana. In the present study, iron was found higher than WHO Standard22 of 50 mg/kg for all the investigated aquatic animal and fishes. Amount of Cu in the fish muscles were found in the range of 3.4 to 10.6 mg/ kg. Highest was found in chingri fish (Macrobracium lamarre) and lowest in samuk (Neritaspengleriana). FAO/WHO in 200131 established limits for Cu in fish as 30.0 mg/kg for human health risk concerns. Concentrations of Cu in these samples were far below the threshold value, therefore regular consumption of fish with such low amount of Cu could not lead to any serious health risk. Zinc in all the fish species were extremely high as compared to the amount of other micronutrients that were considered in this study. The maximum amount of Zn recorded in the kachki fish (Coricasoborna) was 70.6 mg/kg and the minimum was 21.5 mg/kg in samuk (Neritaspengleriana). FAO recommended concentration of Zn is 30 mg/kg for safe human consumption.32 The amount of nickel (Ni), arsenic (As) and lead (Pb) were too low to detect by the instrument. In a study, Shakir et al33 also stated the highlevel of chromium and manganese which exceed the safe limit and Cu, Zn, Ni, As were within the safe limit, showing no threat to the human consumption in a wild carp fish from selected sites of a river loaded with municipal and industrial wastes in Pakistan. In the present study, the decreasing trend of heavy metal (mean) in fishes is Fe>Mn>Zn>Cr>Ca>Se>Co>Cu>K. Khan et al13 also reported a similar trend (Fe>Zn>Mn>Co>Cu) for fish of Buriganga river.
Heavy Metals in Vegetables
Concentration of heavy metal in vegetable samples analysed are shown in Table 4. Chromium (Cr) in the investigated vegetables ranged from 0.6 to 7.4 mg/kg. Highest was found in string bean (Vigna Sesquipedalis) and lowest in tomato (Lycopersicon esculentum). Concentration of chromium in all the vegetable samples were higher than WHO/Food and Agriculture Organization (FAO) standard34 of 2.3 mg/kg. Jolly et al14 reported a lower level of Cr in radish, amaranthus, tomato and cauliflower collected from Rooppur area of Bangladesh. Concentration of nickel (Ni) in the investigated vegetables ranged from 0.65 to 5.43 mg/kg. Highest was found in string bean (Vigna Sesquipedalis) and lowest in tomato (Lycopersicon esculentum) and cucumber (Cucumis sativus). Ni concentration was found lower than EU Standard35 of 67 mg/kg and thus vegetables are not contaminated by nickel. Copper (Cu) is an essential part of several enzymes and it is necessary for the synthesis of haemoglobin but can cause harm at high concentrations.33 Concentration of Cu in vegetables was in the range of 4.6 to 10.3 mg/kg. Highest was found in tomato (Lycopersicon esculentum) and lowest in lady’s finger (Hibiscus esculentus). According to WHO/FAO,34 safe limit for Cu in vegetables is 73.0 mg/kg for human and hence the value of Cu was far below the suggestive value therefore regular consumption of vegetables with such low amounts of Cu could not lead to any serious health risk so far as Cu is concerned. The maximum value of Zn recorded in the lady’s finger (Hibiscus esculentus) was 57.1 mg/kg and the minimum was 39.4 mg/kg in brinjal (Solanum meiongena), which was within the guideline value of 100 mg/kg for safe human consumption34 and hence vegetables are not contaminated by zinc. Lead (Pb) in the investigated vegetables was found from 0.57 to 0.91 mg/kg. Highest value was found in lady’s finger (Hibiscus esculentus) and lowest in hyacinth bean (Lablab niger). Concentration of Pb in all the vegetable samples was within the WHO/FAO34 suggestive value of 5 mg/kg. Among the heavy metals Fe was the most abundant metal and its highest and lowest value was found in string bean (vigna Sesquipedalis) 162.2 mg/kg and lowest in tomato (lycopersicon esculentum) 98.3 mg/kg, which was lower than WHO/FAO standard,31 of 425 mg/kg. Manganese and mercury was present in very low amount to detect by the system . The trend of heavy metals (mean) in vegetables is Fe>Zn>Cu>Cr>Ni>Pb>Co. Khan et al13 also reported, the trend of metals in vegetables as Fe>Mn>Zn>Cu>Co for vegetables collected from Buriganga river embankments.
Metal Pollution Index for Vegetable and Fish/Aquatic Animal
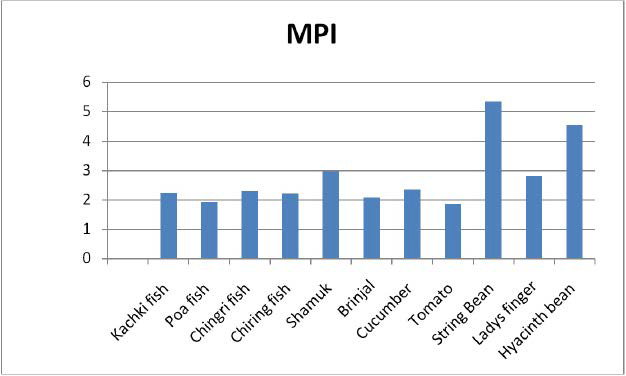
Metal pollution index (MPI) is suggested to be a reliable and precise method for metal pollution monitoring. In this study MPI is calculated by considering concentration of Mn, As and Ni as 0.63, 0.02 and 0.65 mg/kg respectively for all vegetables where the concentrations were not detected by the analytical system. Among different vegetables, MPI (Figure 3) followed a decreasing sequence of string bean>hyacinth bean>lady’s finger>cucumber>brinjal>tomato. On the other hand, among different fishes and aquatic animals (Figure 3), metal pollution index (MPI) followed a decreasing sequence of shamuk>chingri fish>kachki fish>chiring fish>poa fish. Shamuk is supposed to be more polluted because they live on sediment, which contain excess amount of heavy metal due to metal deposition on sediment surface. Islam et al34 reported heavy metal accumulation was high in chirring fish and low in poa fish of Karnaphuli river. Vegetables are found to contain higher MPI value than fishes which may be due to the uptake of higher amount of heavy metal available from polluted soil. Khan et al13 also reported that, vegetables contain higher MPI than fish and thus suggested that this foodstuff might cause human health risk. According to Pan et al,35 the soil acidification trend and the decrease in soil organic matter were bound to increase the accumulation of heavy metals in agro products. Present findings agreed with the findings of Singh et al36 of waste water irrigated site in north east Varanasi and the sequences was as lady’s finger>tomato>brinjal.
Figure 3. Metal Pollution Index in the Various Food Stuffs
Estimated Daily Intake (EDI) of Metals through Different Food Stuffs
Daily intake of metals by consuming different food stuffs are shown in the Table 5. Usually different food items (fish and vegetables in this case) are consumed variably by different segment of populations throughout the year in different time; therefore it is realistic to consider the mean value of the particular elements in different foodstuffs respectively and hence the intake values have been calculated by considering the mean value of element in different fish and vegetable samples respectively and also taking the minimum detectable limit (MDL) values as the concentrations of those elements whose concentrations were too low to detect by the system. However it is observed from the table that intake of all the elements are far below the reference value (Rf D) suggested by different agencies. Shirin et al37 reported to find estimated daily intake of metal (EDI) of Fe, Cr, Mn, Zn, As Cr, Ni and Pb were within the permissible value with an exception of Mn, As and Pb in the vegetable samples collected from the fertilizer factory polluted area. Jolly et al38 also reported to calculate EDI value of Fe, Cu,, Mn, Zn, Co, Cr, V, Ni, Pb and Cd in vegetables collected from Rooppur area of Bangladesh and found all the values were within the permissible limit only Cd showed an alarming value. On the other hand in a study Rahman et al39 estimated daily intake of metal (Cr, Mn, Zn, As, Pb) in marine fish samples followed a sequence Zn>Mn>As>Pb>Cr and all the values were within the safe value which is identical with the present study.
Health Risk Index (HRI) for Different Foodstuffs Analysed
Fish is one of the most popular food and sources of nutrition for human thus, intake of trace elements form consumption of fish, especially toxic elements is one of great concern for human health. To evaluate the health risk to human through the consumption of fish collected from Kalurghat heavy industrial area, HRI was estimated. The predominant pathways for heavy metal uptake, target organs, and organisms’ sensitivity are highly variable and are dependent on factors such as metal concentrations, feeding behaviour and growth rates of fish.40 The increasing demand of food safety has accelerated the research regarding the risk associated with consumption contaminated by heavy metal.41 Result of health risk assessments (HRI) of the various heavy metals considered in this study is presented in Table 6. The calculated HRI through the consumption of fish was less than 1, indicating that there is no potentially significant health risk associated with the consumption of fish collected from Karnaphuli river, even though the concentration of toxic elements found in fish muscles were above the limit set by national and international standard. But there is the need for a continuous monitoring of contamination level of these metals especially Pb since they can accumulate to toxic levels. Among the heavy metals examined in this study, Zn in kachki fish (Coricasoborna), Co in chingri fish (Macrobracium lamarre), and Fe in chiring fish (Apocryptes bato) show higher potential health risk. The health risk associated with heavy metals (Cr, Mn, Fe, Co, Ni, Cu, Zn, Pb) in locally grown vegetables near kalurghat heavy industrial area were calculated as well and results are shown in Table 6. HRI for individual toxic element was found lower than one (1) for most of the vegetables. String bean has maximum HRI value of 1.61 which indicates maximum risk to public health and shows higher HRI value for Cr, Mn, Fe, and Ni. As HRI value of Pb in brinjal, Co in cucumber, Cu and Cd in tomato, Zn in lady’s finger are more close to one, these metals in foodstuff may show health risk in near future. In a study Singh et al41 reported, HRI value for Pb was higher in all the leafy vegetables. Khan et al42 reported, Cd, Pb, and Mn have HRI>1 in food crops from wastewater irrigated land in Pakistan. Jolly et al14 also reported the calculated HRI for Mn, Cd, and Zn was higher than 1 in vegetable samples collected from Rooppur area of Bangladesh.
Hazard Index (HI)
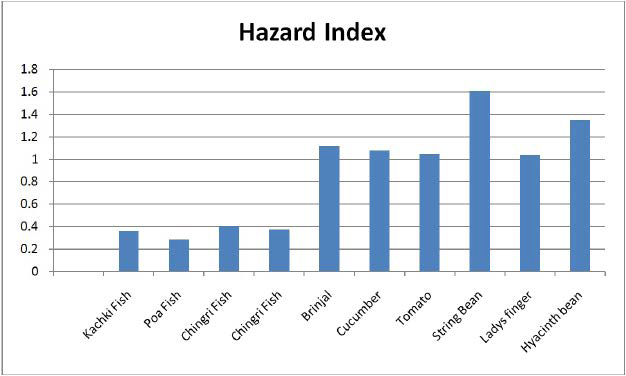
The HI is the cumulative non-carcinogenic effects of multiple elements exposed to consumption of one or more foodstuffs. The calculated HI (Figure 4) for fish and vegetables followed the decreasing order of chiring (Apocryptes bato)>chingri (Macrobracium lamarre)>kachki (Coricasoborna)>poa (Otolithoides pama) and string bean (Vigna Sesquipedalis)>Hyacinth bean (Lablab niger)>brinjal (Solanum meiongena)>cucumber (Cucumis sativus)>tomato (Lycopersicon esculentum)>lady’s finger (Hibiscus esculentus) respectively. When the HI exceeds 1.0, there is concern for health hazard and hence HI values found more than 1.0 for all the analysed foodstuffs are suggested to not consume.
Figure 4. Value of Hazard Index in Different Food Stuffs
CONCLUSION
Present study was conducted to elucidate the status of environmental implication of metals in the water, commonly consumed vegetables and fishes and the possible health risk from consuming those food stuffs collected from Kalurghat heavy industrial area near Karnaphuli river. The average value of physicochemical properties like pH, EC, TDS, salinity in river water showing those properties are much lower than the DoE of Bangladesh suggestive value, indicating safe for irrigation but EC and Salinity are higher than the DoE of Bangladesh suggestive value for drinking water. The mean concentration of heavy metal in Karnaphuli river water followed a sequence of Fe>K>Cr>Mn>Zn>Cu>As=Ni=Hg>Pb. Comparing the present value with the previous study it was found that the pollution level has been decreased which may be due to implement of proper effluent treatment procedures and consciousness about harmful health effects of such pollutants. On the other hand, comparing with national and international standard it can be said that, the Karnaphuli river body near Kalurghat heavy industrial area is still contaminated by Chromium, Iron, Manganese, Zinc and Mercury.
For fish samples, heavy metal concentrations are within the safe value as defined by the recognized authorities with an exception of Chromium, Manganese, Iron. On the other hand, the MPI, for all the fish samples are quite high. Consumption of foodstuff with elevated levels of heavy metals may lead to high level of accumulation in the body causing different diseases like thalassemia, dermatitis, brain and kidney damage and cancer. Among different aquatic animals, metal pollution index (MPI) followed a decreasing sequence of Neritaspengleriana>Macrobracium lamarre>Coricasoborna>Otolithoides pama>Apocryptesba. Result of HRI, HI for fishes and aquatic animals was found less than 1, as fish experience less contamination because pollutants became diluted in presence of river current and hence revealed no association of health risk or hazard for the consumers. In all vegetable samples, metal concentrations were found within the safe value recommended by WHO/FAO 2007,42 FAO/WHOCodex alimentarious commission 200134 except Cr. Metal pollution index (MPI) followed a decreasing sequence of lady’s finger/okra (Hibiscus esculentus)>cucumber (Cucumis sativus)>string bean (Vigna Sesquipedalis)>hyacinth bean (Lablab niger)>brinjal (Solanummeiongena)>tomato (Lycopersicon esculentum). Vegetables are found to contain higher MPI value than fishes. HRI was found below one (1) but HI is greater than one (1) in all varieties of vegetables and thus regular monitoring is essential. Bangladesh is facing a crucial choice between industrialization and environmental protection and therefore government policy should ensure balanced development and thus approaches should be more preventive than corrective. Therefore, water, vegetables and fishes should be monitored on regular basis in order to minimize the toxicity build-up inside the river.
ACKNOWLEDGEMENTS
The authors are grateful to the authority of Dhaka University, Bangladesh and Atomic Energy Centre Dhaka, Bangladesh for giving the permission to conduct the research work. They are also thankful to the staff members of Atmospheric and Environmental Chemistry Laboratory of Chemistry Division for overall assistance and help.
CONFLICTS OF INTEREST
The authors declare that they have no conflicts of interest.


