INTRODUCTION
In India, most of the progeny testing is limited to organized farms with small herd size and this is a limiting factor in assessing the sires breeding values. Today, the need for sire evaluation for the additive genetic value (breeding value or transmitting ability) to its progeny has been recognized. Therefore, accurate, efficient and early evaluation of breeding value of sires is of prime importance. With advancement in computing power, many procedures have been proposed for evaluating sires based on the records of their progeny. In recent past the best linear unbiased prediction (BLUP) procedure has been widely used as standard method of sire evaluation. However, Henderson1 opined that analysis of variance and covariance may give biased components of variance from selected population by BLUP method; whereas restricted maximum likelihood (REML) can give biased free estimate. Hence, the sire evaluation using advanced statistical techniques based on derivative free REML methods were also used to judge the effectiveness of different methods.
In the present study, the breeding values of sires were estimated, evaluated and ranked on the basis of DFREML as described by Meyer,2 would be expected to enhance the accuracy of selection of bulls. However, an animal model in Indian breeds has been used preciously.3,4 Hence, in this paper an attempt is made to compare effectiveness of different methods of sire evaluation on the basis of first lactation traits in crossbred cattle.
MATERIALS AND METHODS
The data for the present study were obtained from the performance records of 1085 crossbred daughters of 57 sires maintained at Instructional Dairy Farm of Gobind Ballabh Pant University of Agriculture and Technology, Pantnagar, Uttarakhand, India during 1974-2004. They were used to estimate breeding value of sires for first lactation and life time traits. The exotic breeds used were Holstein Frisian (HF), Jersey (J) and Red Dane (RD) and the indigenous breeds were Sahiwal (S) and Rathi (R). The crossbreds were HFxS, JxS, RDxS, HFxSxRD, RDxSxJ, HFxRxJ and HFxSxRDxJ. Cows with abnormal and incomplete records were excluded from the study. The data on sires having at least 3 daughters per sire were included for sire evaluation of sires. Each year was divided into 3 seasons i.e. summer (March to June), rainy (July to October) and winter (November to February) based on climatic conditions. Daughters were grouped into 7 genetic groups on the basis of their breeding history. Period of study was divided into 7 periods, each period of 5 years in which their daughters were born.
STATISTICAL ANALYSIS
As the data in the present study were non-orthogonal in nature with unequal subclass numbers, they were subjected to least squares analysis of variance without interactions using different models to examine the effect of genetic as well as non-genetic factors on various first lactation traits as per standard procedures of Harvey.5 The model was based on the assumption that different components fitting in the model were linear, independent and additive. While sire was treated as random effect, the other genetic and non-genetic factors (genetic group, season and period) were taken as fixed effects in the model. The main objective of sire evaluation is to obtain an accurate and unbiased estimate of breeding value of bulls and ranking them on the basis of performance of their daughters so as to enable the breeders to choose the best bull for subsequent improvement of the herd. Many sire evaluation methods based on performance of adequate number of progeny recorded have been proposed. The following four methods of sire evolution were used to estimate the breeding values of sires.
Least Squares Method (LSM)
The least squares method (LSM)5 was used to estimate the breeding value of sires, using the following statistical model.
Yij = µ + Si + eij
Where,
Yij =jth dependent single trait of the daughter of ith sire
µ =population mean
Si =effect of ith sire
eij =random error assumed to be normally and independently distributed with mean zero and variance σ2 i.e. NID (0,σe2 ).
Best Linear Unbiased Prediction (BLUP F90-Dairy Pack, 2004)
BLUP F90 and related programs were developed in the lab of Misztal et al6 with the purpose of providing comprehensive computing capabilities to problems related to mixed models in animal breeding.
Dairy pack provides basic animal model which allows data of animals in the pedigree to be included in the analysis so that all known relationships can be taken into account. Other effects, fixed and random, can be including for comprehensive use of mixed model. Fixed effects such as herd-year-season can be performed during the analysis; therefore, no added step of data preparation is required. Normally, all traits used in dairy pack should be continuous rather than ordinal scale for proper use in the analysis of linear mixed model. Model with single record per animal can be analyzed by BLUP univariate (single trait) animal model as follows:
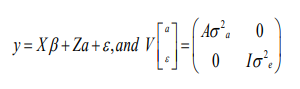
Where, y is a vector of response variable, β is a vector of fixed effects, a is vector of random additive genetic effects, ε is a vectors of random residual, X and Z are incident matrices related to fixed and random effects, A is the numerator relationship matrix, is the additive genetic variance, and Iis the residual variance.
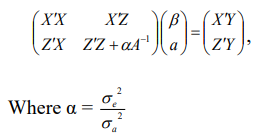
To perform BLUP, Henderson’s1 MME can be written as:
Multivariate Model
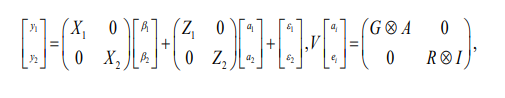
Where y1, y2 is a vector of response variable for trait 1 and 2, β1, β2 is vectors of fixed effects, a1, a2 is vector of random additive genetic effects, ε1, ε2 is vector of random residual effect, X, W and Z are incident matrices related to fixed and random effects, A is a numerator relationship matrix, G is a matrix of direct genetic variance-covariance for trait 1 and 2. R is matrix of residual variance-covariance for trait 1 and 2.
Derivative Free Restricted Maximum Likelihood Method (DFREML)
In DFREML method the density function of the multivariate distribution is maximized after correcting all observations first for the fixed effects without taking consideration of the first or second derivatives in the analysis. Single and multiple trait models were used for estimation of different variance and covariance components. In multiple traits two or three traits were considered simultaneously.
For DFREML estimation following animal model was considered:
Yijk = X bi + Z uj + eijk
For three traits the model can be represented as:
| y1 |
= |
X1 |
0 |
0 |
0 |
|
b1 |
+ |
Z1 |
0 |
0 |
0 |
|
u1 |
+ |
e1 |
| y2 |
0 |
X2 |
0 |
0 |
b2 |
0 |
Z2 |
0 |
0 |
u2 |
e2 |
| y3 |
0 |
0 |
X3 |
0 |
b3 |
0 |
0 |
Z3 |
0 |
u3 |
e3 |
| Y4 |
0 |
0 |
0 |
X4 |
|
b4 |
0 |
0 |
0 |
Z4 |
u4 |
e4 |
Where,
Yijk =kth observation of jth random effect of ith fixed effect
bi=Vector of observation of fixed effect i.e. season and period of calving
uj=Vector of additive genetic effect (random effect/sire effect)
X=Design matrix/incident matrix of fixed effect
Z=Design matrix/incident matrix of random effect
eijk =Vector of residual errors.
With E(y)=Xb and variance V.
The variance covariance structure given by
| Var |
u1 |
= |
Aσ2a1 |
Aσa12 |
Aσa13 |
0 |
0 |
0 |
| u2 |
Aσa21 |
Aσ2a2 |
Aσa23 |
0 |
0 |
0 |
| u3 |
Aσa31 |
Aσa32 |
Aσ2a3 |
0 |
0 |
0 |
| e1 |
0 |
0 |
0 |
Iσ2e1 |
Iσe12 |
Iσe13 |
| e2 |
0 |
0 |
0 |
Iσe21 |
Iσ2e2 |
Iσe23 |
| e3 |
0 |
0 |
0 |
Iσe31 |
Iσe32 |
Iσ2e3 |
The following are the assumptions of the model:
Var (u)=G
Var (e)=R
and Cov (u, e/) 0
So that, V(y) =ZGZ/+R
The normal distribution of a variable y with mean µ and standard deviation σ, the normal distribution of this variable represented as: y~N (µ, σ2).
The mathematical distribution of the density function for this normally distributed variable is:
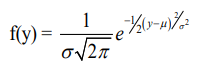
This is known as probability density function (PDF). In case of multivariate, multidimensional normal distribution PDF follows, y~N (Xb, V). Where, N is the length of y and V is the variance of the parameter. This function ƒ(y) gives the probability of finding a certain ‘y’ such that the parameters are given. The parameters are the means in Xb “location parameters” and the variances in V “dispersion parameters”. Observed data gives probability of having such data for certain parameter value. So the probability density function can be used as a likelihood function.
When the data y is known; the ƒ(y) is a likelihood function which can be maximized in parameters; in other words, find the parameters for which ƒ(y) has highest value is to be found.
The effectiveness of different sire evaluation methods was judged by the estimated breeding value of sires taken as twice the sire genetic group solution plus sire solution within sire genetic group for that trait. After estimation of breeding value of sire, the sires were given ranks as per their genetic merit.
After estimation of breeding value of sires, the sires were ranked as by their genetic merit. The Spearman’s rank correlation between breeding values of sires derived by various methods was used to judge the effectiveness of different methods. The rank correlation was estimated as per Steel and Torrie7:
 Where,
r=rank correlation coefficient
n=number of sires under evaluation
di=difference of rank between paired items under 2 methods
The significance of rank correlation was tested by t-test as given below:
It was compared with t-table value with (n-2) degree of freedom.
RESULTS
In the present study, the breeding values of sires were estimated and sires ranked on the basis of breeding value of their progeny by 3 different sires evaluation methods and presented in Table 1. The estimated overall average breeding values of sires by LSM, DFREML and BLUP methods for age at first calving (AFC), first lactation period (FLP), first dry period (FDP) and first calving interval (FCI) were found to be 1359.95 days, 356.56 days, 177.58 days and 534.15 days respectively. The EBV’S for AFC, ranged from 1296.20 to 1414.70 days, for FLP 330.70 to 399.80 days for FDP 171.40 to 188.90 days and for FCI 509.50 to 562.00 days respectively. By DFREML method the estimated breeding value for AFC ranged from 1162.00 to 1522.20 days, for FLP 305.90 to 449.70 days, for FDP 137.80 to 254.60 days for FCI 470.20 to 616.20 days respectively. By BLUP method the estimated breeding value for AFC ranged from 1204.40 to 1512.70 days, for FLP 302.80 to 447.70 days, for first dry period 151.00 to 226.20 days and for FCI 469.30 to 610.60 days respectively.
| Table 1: Average breeding value estimates for first lactation traits by different methods of estimation |
| Traits |
Sire evaluation method |
Average breeding value |
Minimum B.V.
(% below average) |
Maximum B.V.
(% below average) |
Number of sires over average BV (% of sires) |
Number of sires below average BV (% of sires) |
|
AFC
|
LSM |
1359.95 |
1296.20 (4.69) |
1414.70 (4.03)
|
26.00 (45.61) |
31.00 (54.39)
|
|
DFREML
|
1359.95 |
1162.0 (14.56) |
1522.20 (11.93) |
27.00 (47.37) |
30.00 (52.63)
|
|
BLUP
|
1359.95 |
1204.70 (11.42) |
1512.70 (11.23) |
27.00 (47.37) |
30.00 (52.63)
|
|
FSP
|
LSM |
271.51 |
270.50 (0.37) |
272.30 (0.29) |
21.00 (36.84) |
36.00 (63.16)
|
|
|
DFREML
|
271.50 |
268.80 (1.00) |
273.50 (0.74) |
25.00 (43.86) |
32.00 (56.14)
|
|
BLUP
|
271.50 |
269.80 (0.63) |
272.80 (0.48) |
25.00 (43.86) |
32.00 (56.14)
|
|
FDP
|
LSM |
177.58 |
171.40 (3.48) |
188.90 (6.37) |
32.00 (56.14) |
25.00 (43.86)
|
|
DFREML
|
177.58 |
137.80 (22.40) |
254.60 (43.37) |
32.00 (56.14) |
25.00 (43.86)
|
|
|
BLUP
|
177.57 |
151.00 (14.96) |
226.20 (27.38) |
32.00 (56.14) |
25.00 (43.86) |
|
FCI
|
LSM |
534.15 |
509.50 (4.61) |
562.00 (5.21) |
33.00 (57.89) |
24.00 (42.11)
|
|
DFREML
|
534.15 |
470.20 (11.97) |
616.20 (15.36) |
31.00 (54.39) |
26.00 (45.61)
|
|
FLP
|
LSM |
356.56 |
330.70 (7.25) |
399.80 (12.13) |
27.00 (47.37) |
30.00 (52.63)
|
|
DFREML
|
356.56 |
305.90 (14.21) |
449.70 (26.12) |
27.00 (47.37) |
30.00 (52.63)
|
|
|
BLUP |
356.56 |
302.80 (15.08) |
447.70 (25.56) |
27.00 (47.37) |
30.00 (52.63) |
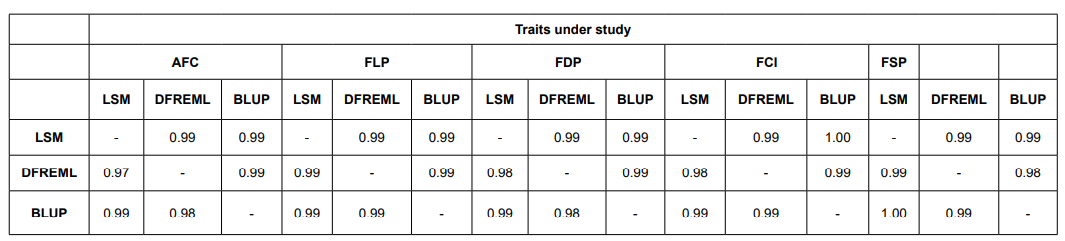
The estimated breeding values of sires estimated for first lactation traits by LSM method showed small genetic variation in comparison to BLUP and DFREML methods. The BLUP method was considered to be second more appropriate method than the DFREML method. The product moment correlations between the breeding value of sires and the rank correlations between the rankings of sires by various methods are presented in Table 2. Accuracy of the methods of sire evaluation was determined by comparing the simple (product moment correlations and spearman’s rank correlation) correlation of breeding value of sires estimated by various sire evaluation methods for first lactation traits. The simple correlations and rank correlations among all the three methods of sire evaluation were very high and significant. The product moment correlations among LSM and DFREML and BLUP methods of sire evaluation ranged from 0.974 to 1.00, where as the rank correlations among breeding value of sires ranged from 0.994 to 0.998 for first lactation traits.
Table 2: Spearman’s Rank and Product moment correlation among different sire evaluation methods.
Top 10 sires ranked on the basis of estimated breeding values of sires for first lactation traits by all 3 methods are presented in Table 3. The top 10 sires ranked on the basis of first lactation traits revealed that all sires would not rank same for all the methods. However, the rank of sires for different sire evaluation methods revealed that 4-5% top sires almost had similar rank for all the methods.
| Table 3: Top 10 sires ranks on the basis of estimated breeding values of sires for first lactation traits by different methods. |
|
Rank
|
AFC
|
FLP |
FDP
|
FCI |
|
LSM
|
DFREML |
BLUP |
LSM |
DFREML |
BLUP |
LSM |
DFREML |
BLUP |
LSM |
DFREML |
BLUP
|
|
1.
|
25 |
25 |
25 |
20 |
20 |
20 |
43 |
43 |
43 |
20 |
20 |
20 |
|
2.
|
38 |
46 |
38 |
21 |
64 |
21 |
23 |
35 |
23 |
25 |
25 |
25 |
| 3. |
32 |
32 |
58 |
64 |
21 |
64 |
50 |
23 |
50 |
47 |
47 |
47
|
| 4. |
58 |
58 |
32 |
42 |
42 |
42 |
19 |
50 |
19 |
42 |
53 |
42
|
In comparison of these methods of sire evaluation LSM method was found to be more efficient, accurate, and stable with lowest genetic variation. The rank correlation coefficients amongst breeding value of sires by different methods of sire evaluation showed reasonably high degree of agreement (79%) in the ranking of sires.
DISCUSSION
The estimated overall average breeding values of sires by LSM, DFREML and BLUP methods for AFC, FLP, FDP and FCI were 1359.95 days, 356.56 days, 177.58 days and 534.15 days respectively. The EBV’S for AFC, ranged from 1296.20 to 1414.70 days, for FLP 330.70 to 399.80 days for FDP 171.40 to 188.90 days and for FCI 509.50 to 562.00 days respectively. By DFREML method the estimated breeding value for AFC ranged from 1162.00 to 1522.20 days, for FLP 305.90 to 449.70 days, for FDP 137.80 to 254.60 days for FCI 470.20 to 616.20 days respectively. By BLUP method the estimated breeding value for AFC ranged from 1204.40 to 1512.70 days, for FLP 302.80 to 447.70 days, for first dry period 151.00 to 226.20 days and for FCI 469.30 to 610.60 days respectively (Table 1). These estimates showed large genetic differences between the ranges of breeding values of sires for first lactation traits. Similar results were also reported by Dalal et al,8 Bajetha,9 Moges et al,10 Singh and Singh,11 Bajeetha and Singh12 and Bajeetha et al.13
The estimated breeding values of sires estimated for first lactation traits by LSM method showed small genetic variation in comparison to BLUP and DFREML methods. The BLUP method was considered to be second more appropriate than the DFREML method. The results obtained in the present study are in conformation to the reports of Tajane and Rai,14 Sahana and Gurnani,15 Deulkar and Kothekar,16 Kumar17 and Mukharjee.18 However, Dhaka and Dahia,19 Dahia,20 Bajeetha.9 Dubey et al21 and Bajeetha and Singh12 reported BLUP as best procedure in comparison to other procedures of sire evaluation.
Accuracy of the methods of sire evaluation was determined by comparing the simple (product moment correlations and spearman’s rank correlation) correlation of breeding value of sires estimated by various sire evaluation methods for first lactation performance traits. The simple correlations and rank correlations among all the three methods of sire evaluation were very high and significant. The product moment correlations among LSM and DFREML and BLUP methods of sire evaluation ranged from 0.974 to 1.00, where as the rank correlations among breeding value of sires ranged from 0.994 to 0.998 for first lactation traits (Table 2).
In the present study, all the estimates of simple and rank correlations were highly significant. These findings agreed with the reports of Dalal et al,22 Dubey et al,21 Banik and Gandhi,23 Bajetha,9 Mukharjee et al,4 Kumar et al3 and Moges et al.10
The top 10 sires ranked on the basis of first lactation traits revealed that all sires would not rank same for all the methods. However, the rank of sires for different sire evaluation methods revealed that 4-5% top sires almost had similar rank for all the methods (Table 3). Similar results were also reported by Dalal et al,22 Bajetha,9 Dubey et al,21 Moges et al,10 Singh and Singh,11 Singh et al25 and Bajeetha and Singh,12 Lodhi et al,24 Lodhi et al26 and Singh and Singh.27
In comparison of these methods of sire evaluation LSM method was found to be more efficient, accurate, and stable with lowest genetic variation. The rank correlation coefficients amongst breeding value of sires by different methods of sire evaluation showed reasonably high degree of agreement (79%) in the ranking of sires.
CONCLUSION
These results indicated that the estimated breeding values (EBV’S) of sires had very high and significant product moment correlations and rank correlations among all lifetime traits estimated by all the methods. These estimates indicating that there was higher degree of similarly (about 85-90%) in ranking of sires by different methods. However, the ranks of sires for different traits revealed that 4-5% top sires had similar rank for all life time traits. In comparison of these methods of sire evaluation LSM method was found to be more efficient, accurate and stable with lowest genetic variation. The rank correlation coefficients amongst breeding value of sires by different methods of sire evaluation showed reasonably high degree of agreement (79%) in the ranking of sires.
CONFLICTS OF INTERESTS
The authors declare that they have no conflicts of interest.


