INTRODUCTION
Maize (Zea Mays Saccharrata L.) is the prime member of family Gramineae. It is the third major source of staple food after wheat and rice for mankind. It is a short duration crop and can be successfully grown in areas of high mountains of KPK (Khyber Pakhtunkhuwa), where snowfalls and chilling temperature limits growing period of cereals.1 Maize has 5 types i.e flint corn, dent corn, popcorn, flour corn and sweet corn. Sweet corn (Zea Mays Saccharata. L) is a variety of maize having high sugar content. It differs from field corn interms of its genetic makeup.2 It contains high percentage of sugar during milk stage. It is grown in several areas of Khyber Pakhtunkhwa including Mansehra, Mingora and Swabi for local market purpose.3 Potential yield of sweet corn can be maximized through various reeding schemes. In these breeding schemes early testing of S2 lines is considered an efficient approach for grain yield.4 Maize improvement can be boosted due to genetic diversity.1 To identify better combiners, combining ability analysis is employed.
Combining ability is the capacity of an individual to transmit superior performances to its offspring. The better combiners can be hybridized to exploit heterosis and to select better crosses for future breeding work or direct use. Combining ability analysis is of special importance in cross-pollinated crops like maize as it helps in identifying potential inbred parents that can be used for producing hybrids and synthetics.2
Expected value of any particular cross is the sum of general combining ability (GCA) of its two parental lines.5 GCA is the ability of a line to produce superior hybrids when crossed with a broad base tester or to a number of different inbred lines. Tester is a line used as female parent in a cross. On the basis of good GCA, when more promising lines are selected it is necessary to find out the particular combination that will produce the higher yield.3 Estimates of GCA provides a guideline of individual genotypes in selection and testing schemes. Hence diallel analysis is one of the genetic-statistical approaches that helps in selection of parents carrying promising genotypic potential of producing superior segregants.6 The present study was therefore initiated to 1) evaluate sweet corn testcrosses for yield and morphological traits and 2) estimate general combining ability of inbred lines of sweet corn. Combining ability is the capacity of an individual to transmit superior performances to its offspring. The better combiners can be hybridized to exploit heterosis and to select better crosses for future breeding work or direct use. Combining ability analysis is of special importance in cross-pollinated crops like maize as it helps in identifying potential inbred parents that can be used for producing hybrids and synthetics.2 Expected value of any particular cross is the sum of GCA of its two parental lines.5 GCA is the ability of a line to produce superior hybrids when crossed with a broad base tester or to a number of different inbred lines. Tester is a line used as female parent in a cross. On the basis of good GCA, when more promising lines are selected it is necessary to find out the particular combination that will produce the higher yield.3 Estimates of GCA provides a guideline of individual genotypes in selection and testing schemes. Hence diallel analysis is one of the genetic-statistical approaches that helps in selection of parents carrying promising genotypic potential of producing superior segregants.6 The present study was therefore initiated to 1) evaluate sweet corn testcrosses for yield and morphological traits and 2) estimate general combining ability of inbred lines of sweet corn.
MATERIALS AND METHODS
The research was conducted at The University of Agriculture Peshawar, Pakistan during 2016. Forty-eight testcrosses, derived in spring 2016 by crossing 24 inbred lines with two testers at Cereal Crops Research Institute Pirsabak, Nowshehra, were evaluated in alpha lattice design with two replications along with two checks. Each testcross was sown in a 2 row plot, having 4 meter row length. The row spacing was kept 0.75 m while plant to plant spacing was 0.25 meter. Two to three seeds per hill was sown which were later thinned. Data was recorded on plot basis for flowering characters and grain yield related traits, while on randomly selected plants for plant height and ear height. Recorded data was analyzed through WASP (web of Agri AGRISTAT package) software, developed by Ashok Kumar Jangam and Pranjali Ninad Wadekar. Analysis of general combining ability effect was calculated using method developed kempthrone et al (Table 1).7
| Table 1. Analysis of Variance for 48 Testcrosse |
|
SOV
|
Df |
MS |
F-value
|
|
Replications
|
(r-1) |
RMS |
RMS/EMS |
| Crosses |
(c-1) |
CMS |
CMS/EMS
|
|
Lines
|
(l-1) |
LMS |
LMS/EMS |
| Tester |
(t-1) |
TMS |
TMS/EMS
|
|
Line×tester
|
(l-1)(t-1) |
LTMS |
LTMS/EMS |
| Error |
(r-1)(c-1) |
EMS |
|
|
Total
|
ltr-1 |
|
|
| SOV=source of variation, Df=degree of freedom,
MS=means Square, RMS=replication mean square,
CMS=crosses mean square, LMS=lines mean square,
TMS=tester mean square, LTMS=line×tester mean
square, EMS=error mean square |
Estimation of General Combining Ability Effect
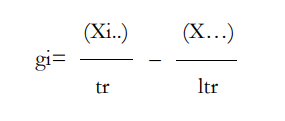
where t=tester , r=replication and l=lines
RESULTS AND DISCUSSION
Analysis of Variance
Analysis of variance disclosed highly significant variation (p<0.01) among the testcrosses for days to tasseling, plant height and cob length, and significant variation (p<0.05) for grain yield, while non-significant variation for dasy to silking among the testcrosses (Table 2). Kamara et al8 have noticed similar significant results for tasseling, plant height and grain yield. Variation due to lines effect was highly significant for tasseling, silking and plant height, significant for cob length and non-significant for grain yield (Table 2). Variation due to tester effect was non-significant for flowering and yield traits, while highly significant for plant height. Similarly variation due to line and tester interaction was non significant for silking and tasseling, and highly significant for cob length and plant height, while significant for grain yield (Table 2). The present findings of this research are in direction with earlier research reports of Chen et al,4 Srivastava,5 Jaykumar et al,6 Premlatha et al,7 Al Nagger et al,8 El-Hosary et al,9 and Ali et al.10
| Table 2. Mean Squares for Days to Silking, Tasseling, Cob Length, Plant Height and Grain Yield of 48 Testcrosses Derived from S4 Lines of Sweet Corn |
|
Source
|
DTS |
DTT |
PH |
CL |
GY
|
|
Replication
|
2.04
|
7.59 |
0.68 |
18.38 |
399680.63 |
| Crosses |
3.23NS |
6.04** |
257.97** |
1.72** |
1729930.86*
|
|
Lines
|
5.13*
|
8.08** |
303.97** |
1.52* |
1614682.90 NS |
| Tester |
2.04NS |
1.76NS |
17.94** |
0.06NS |
231624.40 NS
|
|
Line × tester
|
1.43NS
|
3.47NS |
222.41** |
2.00** |
1910322.58* |
| Error |
2.22 |
1.99 |
0.68 |
0.63 |
828031.48
|
|
CV%
|
2.66
|
2.74 |
0.54 |
5.65 |
19.65
|
| *,**=significant at 5 and 1% probability level, respectively. NS=Non-significant
DTS=Days to silking; DTT=Days to tasseling; PH=Plant height; CL=Cob length; GY=Grain yield |
Days to Silking (days)
Means for days to silking ranged from 53 to 59-days having an average of 55.47 with T1 (Central Citrus Research Institute (CCRI) sweet) and 56.02 with T2 (Synthetic sweet) (Table 3). Using synthetic sweet as tester minimum value (53-days) was observed for line 1(9-4) and maximum (59-days) by line 1(6-3). Overall mean of testcrosses was 55.75 and 55-days for checks (Table 3). Mean values ranged from -2.00 t0 2.00. highest positive GCA was obtained for line 1(3-5) and lowest for line 1(10-2). Thirteen testcrosses showed negative GCA effect. It is evident from the findings that 37.5% testcrosses took minimum days to silking and 62.5% took more days to silking as compared to checks (Table 3). Negative GCA effect was recorded for 54.1% of testcrosses (Table 3). Nigussie et al,9 reported similar negative GCA effects for days to silking.
| Table 3. Means, GCA Effects of Days to Silking and Tasseling of 48 Testcrosses of Sweet Corn |
|
S4
Line
|
Silking (days)
|
GCA
|
Tasseling (days)
|
GCA
|
| Tester |
Tester |
|
CCRI
Sweet
|
Synthetic
Sweet |
CCRI
Sweet |
Synthetic
Sweet
|
|
1(4-1)
|
53.5 |
55 |
-1.50 |
49 |
48.5 |
-1.66 |
| 1(9-3) |
55 |
56 |
0.50 |
49 |
51.5 |
0.09
|
|
1(9-1)
|
56.5 |
58.5 |
-0.50 |
50.5 |
54 |
-1.16 |
| 1(8-1) |
56 |
57 |
1.00 |
51 |
51.5 |
0.09
|
|
1(8-4)
|
55.5 |
55.5 |
-0.75 |
50 |
50.5 |
-1.41 |
| 1(8-5) |
55 |
54 |
-0.50 |
49 |
48.5 |
-1.16
|
|
1(12-4)
|
57 |
55.5 |
-0.50 |
50.5 |
51 |
-1.41 |
| 1(2-4) |
56.5 |
55 |
-2.00 |
51 |
49.5 |
-2.16
|
|
1(6-3)
|
54.5 |
59 |
0.25 |
49 |
53.5 |
0.84 |
| 1(3-2) |
55.5 |
56 |
1.00 |
49.5 |
50.5 |
2.34
|
|
1(3-1)
|
55 |
57 |
-0.25 |
49.5 |
51.5 |
0.09 |
| 1(12-2) |
55.5 |
58 |
0.00 |
49.5 |
52.5 |
0.09
|
|
1(2-1)
|
55 |
55 |
-0.25 |
49 |
50 |
-0.66 |
| 1(7-3) |
55.5 |
56.5 |
2.00 |
49.5 |
55 |
2.09
|
|
1(9-2)
|
53.5 |
58 |
0.00 |
48 |
55 |
-0.16
|
|
1(4-2)
|
54 |
57.5 |
-0.50 |
49 |
53 |
-0.41
|
|
1(8-3)
|
56 |
54.5 |
1.75 |
51.5 |
49 |
1.34
|
|
1(9-4)
|
56 |
53 |
1.75 |
51.5 |
47.5 |
1.34
|
|
1(7-4)
|
57 |
55 |
0.00 |
53 |
50 |
1.84
|
|
1(3-5)
|
56.5 |
56 |
2.00 |
53 |
51 |
3.34
|
|
1(10-2)
|
56 |
56 |
-2.00 |
51 |
51 |
-2.41
|
|
1(3-3)
|
56 |
55 |
-0.25 |
50.5 |
50.5 |
-0.16
|
|
1(7-1)
|
57 |
56 |
-0.25 |
52.5 |
51.5 |
0.09
|
|
4(3-3)
|
54.5 |
55.5 |
0.00 |
49 |
50 |
0.09
|
|
Grand Mean
|
55.47 |
56.02 |
|
50.20 |
51.10
|
|
|
Grand mean of checks=55
|
Grand mean of checks=49.4
|
| *The S4 lines pedigree number which were obtained from (cereal crops research institute (CCRI),
Pirsabak) Pakistan |
Days to Tasseling
Testcross 1(9-4) took minimum (47.5) days to tasseling, with synthetic sweet as tester and maximum (55-days) by line 1(7-3) and 1(9-2), using synthetic sweet as tester. The average mean for all testcrosses was 50.66-days. GCA values ranged between -2.41 to 3.34 (Table 3). Maximum GCA effect was recorded for line 1(3-5), followed by 1(3-2), and minimum for line 1(10-2) followed by 1(3-4). About 35.5% testcrosses took minimum time to tasseling and 64.5% took more time as compared to check means. 48.5% testcrosses recorded negative GCA effect and rest with positive GCA values (Table 3). Our result for days to tasseling got support from Shah et al.10
Plant Height
Mean values regarding plant height ranged between 129.8 and 178 cm. Maximum plant height was recorded by line 1(12-4), when CCRI sweet was used as tester followed by 1(9-4) when synthetic sweet was used as tester. Minimum plant height was observed for line 1(3-3), with synthetic sweet as tester (Table 4). GCA effect ranged from -14.69 to 17.03. Maximum positive GCA effect was observed for testcross 1(9-1), succeeded by testcross 1(10-2). Negative and maximum GCA effect was in case of testcross 1(7-1), followed by 1(4-2) (Table 4). Proportional contribution of lines were relatively higher (Table 5). Plant height has direct effect on yield. higher plants are more susceptible to lodging and decreasing yield. Hence low plant height is ultimate goal of a breeder. In this experiment 27.98% plants had lowest plant height as compared to mean of checks (148 cm). Half of the population recorded negative GCA effects for plant height (Table 4). Early researcher Gul et al11 and Carena12 also estimated significant results for agronomic trait like plant height.
| Table 4. Means, GCA Effects of Plant Height and Cob Length of 48 Testcrosses of Sweet Corn |
|
S4 Line
|
Plant Height (cm)
|
GCA
|
Cob Length (cm)
|
GCA
|
|
Tester
|
Tester |
| CCRI Sweet |
Synthetic Sweet |
CCRI Sweet |
Synthetic Sweet |
|
1(4-1)
|
168.5 |
135 |
3.36 |
13.8 |
15.8 |
-0.33 |
| 1(9-3) |
147.6 |
167.7 |
11.51 |
15.1 |
14.1 |
0.92
|
|
1(9-1)
|
159.4 |
153 |
17.03 |
15.9 |
14.1 |
0.48 |
| 1(8-1) |
173 |
155.5 |
12.76 |
15.5 |
15.4 |
0.13
|
|
1(8-4)
|
173.55 |
144.6 |
-1.89 |
15.9 |
13.9 |
-0.14 |
| 1(8-5) |
169.9 |
152.1 |
-8.44 |
14.6 |
15.7 |
0.06
|
|
1(12-4)
|
178 |
144 |
0.56 |
13.6 |
16.6 |
-1.37 |
| 1(2-4) |
156.6 |
136.6 |
-2.59 |
16.3 |
14.9 |
1.01
|
|
1(6-3)
|
159.7 |
157.7 |
5.61 |
14.6 |
16.1 |
-0.59 |
| 1(3-2) |
145.9 |
155.6 |
1.91 |
14.7 |
15.2 |
-0.32
|
|
1(3-1)
|
148.1 |
145.9 |
-4.49 |
13.9 |
14.6 |
-0.49 |
| 1(12-2) |
144.4 |
139.3 |
2.61 |
15.8 |
14.8 |
-1.02
|
|
1(2-1)
|
156 |
143.5 |
-3.34 |
13.6 |
16.2 |
0.18 |
| 1(7-3) |
154.5 |
148.5 |
-0.44 |
13.3 |
14.4 |
-0.09
|
|
1(9-2)
|
146.6 |
160.3 |
-6.34 |
15.7 |
13.7 |
0.01 |
| 1(4-2) |
157.6 |
145.5 |
-14.39 |
15.9 |
14.8 |
0.98
|
|
1(8-3)
|
144.6 |
167.2 |
1.96 |
14.8 |
14.5 |
0.88 |
| 1(9-4) |
176 |
176.1 |
-12.06 |
13.6 |
14.8 |
-0.12
|
|
1(7-4)
|
162 |
147.9 |
-8.69 |
15.3 |
14.9 |
0.51 |
| 1(3-5) |
151.2 |
165.8 |
-1.79 |
13.6 |
15.1 |
-0.57
|
|
1(10-2)
|
149.6 |
150 |
16.96 |
15.1 |
12.9 |
-0.12 |
| 1(3-3) |
150.8 |
129.8 |
2.16 |
13.6 |
15.5 |
0.18
|
|
1(7-1)
|
163.6 |
164.3 |
-14.79 |
13.4 |
15.7 |
-0.59 |
| 4(3-3) |
151 |
151 |
2.96 |
14.2 |
14.1 |
0.38
|
|
Grand mean
|
157.85 |
151.53 |
|
14.67 |
14.95
|
|
|
Mean of checks=148.3
|
Mean of checks=13.10
|
| *The S4 lines pedigree number which were obtained from (cereal crops research institute (CCRI), Pirsabak) PAKISTAN |
Cob Length
Large seed set can be obtained only if cob length is high. Mean value regarding cob length were between 12.9 to 16.6 cm. Line 1(12-4)×synthetic sweet was found to be with high cob length mean, while lowest mean was recorded for testcross 1(10-2)×synthetic sweet. Mean of checks was lower than mean of testers (Table 4). General combining ability effect values lied in range of -1.37 and 1.01. Desirable and high GCA effect value was observed for testcross 1(3-4), while testcross 1(12-4) recorded negative GCA effect with minimum value (Table 4). In the present study about 97% population had higher cob length mean than compared to checks mean. It was evident from the results that 50% of testcrosses had positive GCA effects (Table 4). Contribution of lines was lower than line and tester interaction (Table 5).
| Table 5. Proportional Contribution Lines, Tester and Line×Tester Interactions for Various Traits of Sweet Ccorn to the Total Variance |
|
% Contribution
|
Silking |
Tasseling |
Plant Height |
Cob Length |
Grain Yield
|
|
Lines
|
77.12 |
71.23 |
57.66 |
43.22 |
45.68
|
|
Tester
|
1.33 |
0.26 |
0.15 |
0.08 |
0.28
|
|
Linextester
|
21.54 |
28.15 4 |
42.19 |
56.70 |
54.04
|
Grain Yield
Mean values for GCA ranged between 2022.04 and 7143.18 kg ha-1 Table 6). Highest mean 7143.18 was recorded for testcross 1(9-4), using synthetic sweet as tester, and 6647.72 for testcross 1(8-1), using CCRI sweet as tester, while lowest mean 2022.04 was shown by testcross 1(7-4), using synthetic sweet as tester, and 3715.90 by testcross 1(9-3), using CCRI sweet as tester. Mean of checks was found lower (4086.39 kg ha-1) (Table 6). GCA effect was in range of -1133.35 to 1370.93. Maximum GCA effect was shown by testcross 1(10-2) and minimum GCA effect was recorded for testcross 1(7-4). Twelve testcrosses showed positive GCA effects (Table 6). About 33.3% testcrosses had highest mean for grain yield and 66.6% had lowest mean when compared to mean of check. Among testcrosses, 45.8% had positive GCA effects and 54.8% had GCA effects in negative direction. Similar significant results were also disclosed by Rahman et al13 for grain yield in maize breeding program. Similar results for grain yield due to GCA and SCA were reported by Menkir et al.11
| Table 6. Means, GCA Effects of Grain Yield of 48 Testcrosses of Sweet Corn |
|
S4 lines
|
Grain yield (kg ha-1)
|
GCA
|
|
Tester
|
|
CCRI Sweet
|
Synthetic Sweet
|
|
1(4-1)
|
4911.21 |
4800.45 |
-457.05
|
|
1(9-3)
|
3715.91 |
4733.94 |
1281.93 |
| 1(9-1) |
5657.27 |
3792.42 |
-754.02
|
|
1(8-1)
|
6447.73 |
5916.97 |
194.80 |
| 1(8-4) |
3942.27 |
3980.83 |
-4.25
|
|
1(8-5)
|
4090.91 |
4377.20 |
473.78 |
| 1(12-4) |
5303.03 |
5385.91 |
-54.55
|
|
1(2-4)
|
4627.73 |
3837.88 |
268.73 |
| 1(6-3) |
4751.52 |
4864.85 |
-324.15
|
|
1(3-2)
|
4781.21 |
5203.64 |
162.83 |
| 1(3-1) |
5178.79 |
5296.67 |
183.78
|
|
1(12-2)
|
5310 |
2180 |
818.05 |
| 1(2-1) |
5189.70 |
3815.91 |
-3.37
|
|
1(7-3)
|
4242.42 |
3458.79 |
84.08 |
| 1(9-2) |
4615.15 |
5286.67 |
-591.57
|
|
1(4-2)
|
5463.48 |
4239.92 |
-158.67 |
| 1(8-3) |
4614.92 |
5139.85 |
263.63
|
|
1(9-4)
|
4277.95 |
7143.18 |
-1032.27 |
| 1(7-4) |
5542.42 |
2022.05 |
-1133.25
|
|
1(3-5)
|
4324.39 |
5759.39 |
-7.32 |
| 1(10-2) |
5032.73 |
4267.58 |
1370.93
|
|
1(3-3)
|
4876.06 |
4951.97 |
-879.87 |
| 1(7-1) |
5302.27 |
4620.98 |
-160.85
|
|
4(3-3)
|
5875 |
5837.50 |
458.65
|
|
Grand mean
|
4919.75 |
4621.43
|
|
| Mean of checks=4086.39 |
| *The S4 lines pedigree number which were obtained from CCRI (cereal crops research institute, Pirsabak) Pakistan |
CONCLUSION
The findings of this research suggested extent of variability among the testcrosses for different traits studied, which could be further evaluated in certain future breeding schemes involving sweet corn. Testcross 1 (9-4), 1(12-4) and 1(3-3) is recommended for grain yield, cob length and plant height respectively. However, in terms of GCA effects testcross 1 (10-2) can be fruitful in future breeding programs as it had showed negative general combining ability estimates for days to silking and days to tasseling which is desirable for flowering traits, and for plant height and grain yield the said testcross exhibit positive maximum GCA effects.
CONFLICTS OF INTEREST
The authors declare that they have no conflicts of interest.


