INTRODUCTION
Lung cancer has the second highest estimated new case rates and the highest estimated death rates for both males and females. According to American Cancer Society (ACS), the estimated number of new cases in 2015 are 115,610 men and 105,590 women which account for about 14% and 13% of all new cancer cases for males and females respectively. The estimated deaths are 86,380 men and 71,660 women which account for about 28% and 26% of all deaths associated with cancer for males and females respectively.1 Lung cancer can be classified as small cell lung carcinoma and non-small cell lung carcinoma (NSCLC). NSCLC weighs more than 80% of all lung cancer. NSCLC can be sub-classified into Lung squamous cell carcinoma (LUSC), Lung adenocarcinoma (LUAD), and large cell carcinoma.2 Approximately 20% of all lung cancers are LUSC; it has the worst prognosis. About 40% of all NSCLC cancers are LUAD.2
Despite the differences in prognosis, subtypes of NSCLC have been treated by similar strategies. The treatment effects vary in LUSC and LUAD patients.3 With the rapid development of the targeted therapies for NSCLC, more efficient treatments are available for both NSCLC subtypes. However, to choose treatments, especially targeted therapies and combination of interventions, we need more accurate sub-typing between them.3
Currently, the most widely used method to distinguish between LUAD and LUSC is hematoxylin-eosin (HE) staining of the tumor tissue sections observed under a light microscope. However, due to the drawbacks of HE stainning, such as unclear structures in tumors and small biopsies with a limited number of tumor cells, it is difficult to make a precise diagnosis between LUAD and LUSC.4 Since the molecular profiling is different between LUAD and LUSC, Immunohistochemical (IHC) staining can help to diagnose between LUAD and LUSC. However, it needs knowledge of reliable IHC markers.4 Yu et al designed a fully automated informatics pipeline to extract quantitative image features and build classifiers to distinguish survival outcomes for lung cancer. They applied the classifiers to distinguish between LUAD and LUSC and obtained 0.75 as the highest area under the curve (AUC) value.5
High-throughput data obtained from microarrays and RNA sequencing can be used to identify appropriate biomarkers for IHC staining.4 However, limited biomarkers are applied to IHC staining. By using all available high-throughput data, we may obtain better diagnostic outcomes. In our study, we applied three methods directly to publicly available RNA-Seq data released by the cancer genome atlas (TCGA) from National Cancer Institute (NCI).
METHODS
Data Source
Normalized level 3 RNA sequencing data of tumor samples were obtained from the R package RTCGA RNA seq.6 The data include 576 LUAD and 552 LUSC cases. The outcome to predict is LUAD versus LUSC, and the predictors are 20,259 gene expressions quantified using RNA-Seq by expectation maximization (RSEM) values.7,8 The original data includes 20531 genes; however, 272 have all zero values and thus were excluded from the analyses. In addition, we applied log transformation to achieve an approximately normal distribution for the data.
Overview of Classifier Construction and Evaluation
We applied the following three methods to predict lung adenocarcinoma (LUAD) and lung squamous cell carcinoma (LUSC): principal components regression (PCR), logistic regression with LASSO shrinkage (LASSO), and kth nearest neighbors (KNN). We randomly split the data into training and testing at a ratio of 3:1, where the training data were used to construct a classifier and the testing data were used to evaluate its performance. Details on the three methods are described in the next three subsections.
After a classification model was constructed, we applied it to the testing data to obtain a predicted probability for each sample to be a certain subtype. We applied 0.5 as the cutoff point of the predicted probability to classify samples into the two subtypes. A set of statistics including overall misclassification rates, misclassification rates for LUAD and LUSC, and AUC values were calculated. In addition, we believed that genes used in the selected models were informative. Therefore, we tracked those genes from our selected models for PCR and LASSO. Due to method difference, KNN doesn’t return information on genes. For PCR, we selected 10 genes (5 with the largest positive and 5 with the largest negative loading values) from each of the first two principal components. For LASSO, we recorded all genes included in the selected model. The frequency of those genes will be reported in the Results section.
For each method, we repeated the process 500 times using 500 randomly generated seed numbers. Within each replication, we applied function “set.seed” with fixed seed number. In this way, we got the same split datasets for all three methods to make the final results more comparable. All data processing and analyses were performed in R (version 3.3.2).
PCR: Logistic Regression on Principal Components
The “prcomp” function from R Stats package was used to obtain principal components from training data. We fitted the training data with a different number of principal components and recorded the AIC value for each model. The model with the smallest AIC value was identified as the best model.
LASSO: Logistic Regression with Lasso Shrinkage
The R package “glmnet” is used to fit the LASSO model. To select the shrinkage parameter lambda in the LASSO model, we further split the training dataset at a ratio of 2:1. We fit 100 models with different lambda values using the first portion of the data and calculate the overall misclassification rate of each model using the second portion of the data. The cutoff point to calculate the overall misclassification rate was set as 0.5. The best lambda value was chosen as the model that yields the smallest overall misclassification rate.
KNN: Kth Nearest Neighbors
The R package “class” was used to build a KNN-based classifier. We applied the same strategy as we did for LASSO to select the best number of nearest neighbors (K) in the KNN model. Specifically, the training data were split at a ratio of 2:1, where the first portion was used to fit 20 KNN models with K ranging from 1 to 20. Then the 20 models were applied to the second portion of the data to calculate the overall misclassification rate (cutoff point=0.5) for each model. The best model (best number for K) was selected as the one that achieved the smallest overall misclassification rate.
RESULTS
Table 1 shows the mean value and 95% confidence intervals for overall misclassification rate and misclassification rates for LUAD and LUSC. As we mentioned in the Methods section, all misclassification rates were obtained by using 0.5 as the cutoff point. LASSO has the smallest overall misclassification rate 3.42% (95% CI: 3.25%-3.60%), followed by PCR 5.64% (95% CI: 5.51%-5.76%) and KNN 8.70% (95% CI: 8.57%-8.83%). Compared to PCR and KNN, LASSO also has the smallest misclassification rate for both LUAD (2.55%) and LUSC (4.36%).
| Table 1: Summary Statistics for PCR, LASSO, and KNN. Mean Misclassification Rates and 95% Confidence Intervals are shown in Percentages. All Statistics Presented in the Table are based on 500 Replications. |
|
PCR
|
LASSO |
KNN
|
|
Misclassification Rate (%)
|
Mean (95% CI) |
Mean (95% CI) |
Mean (95% CI)
|
|
LUAD
|
4.36 (4.23-4.49) |
2.55 (2.41-2.69) |
7.25 (7.01-7.49)
|
|
LUSC
|
7.02 (6.84-7.20) |
4.36 (4.13-4.59) |
10.16 (9.93-10.39)
|
|
Overall
|
5.64 (5.51-5.76) |
3.42 (3.25-3.60) |
8.70 (8.57-8.83) |
Receiver operating characteristic (ROC) curves with area under the curve (AUC) values for all three methods are displayed in Figure 1. LASSO has the highest average AUC value (0.993), compared to PCR (0.987) and KNN (0.965).
Figure 1: ROC Curves for PCR (plot A), LASSO (plot B), and KNN (plot C). Max AUC: Maximum AUC Value; Min AUC: Minimum AUC Value; Avg AUC: Mean AUC Value; 95% CI: 95% Confidence Interval for AUC Value. All Statistics Presented in the Figures are based on 500 Replications.
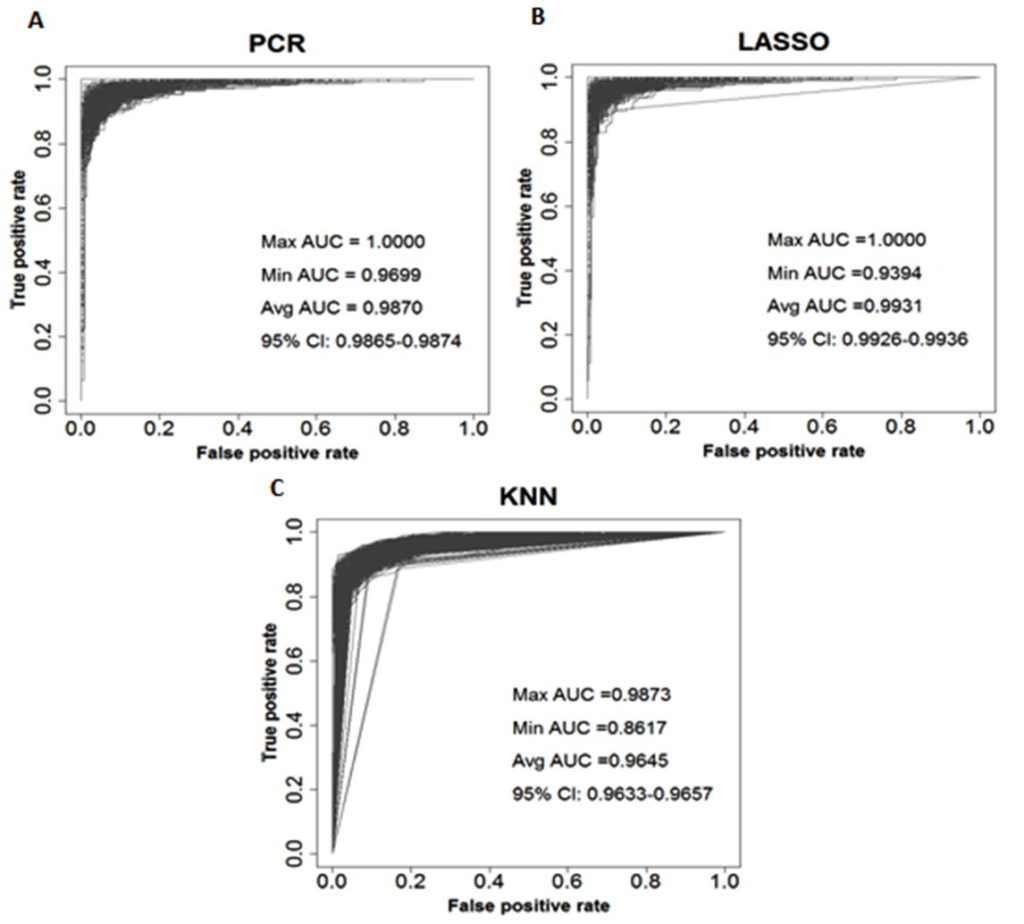
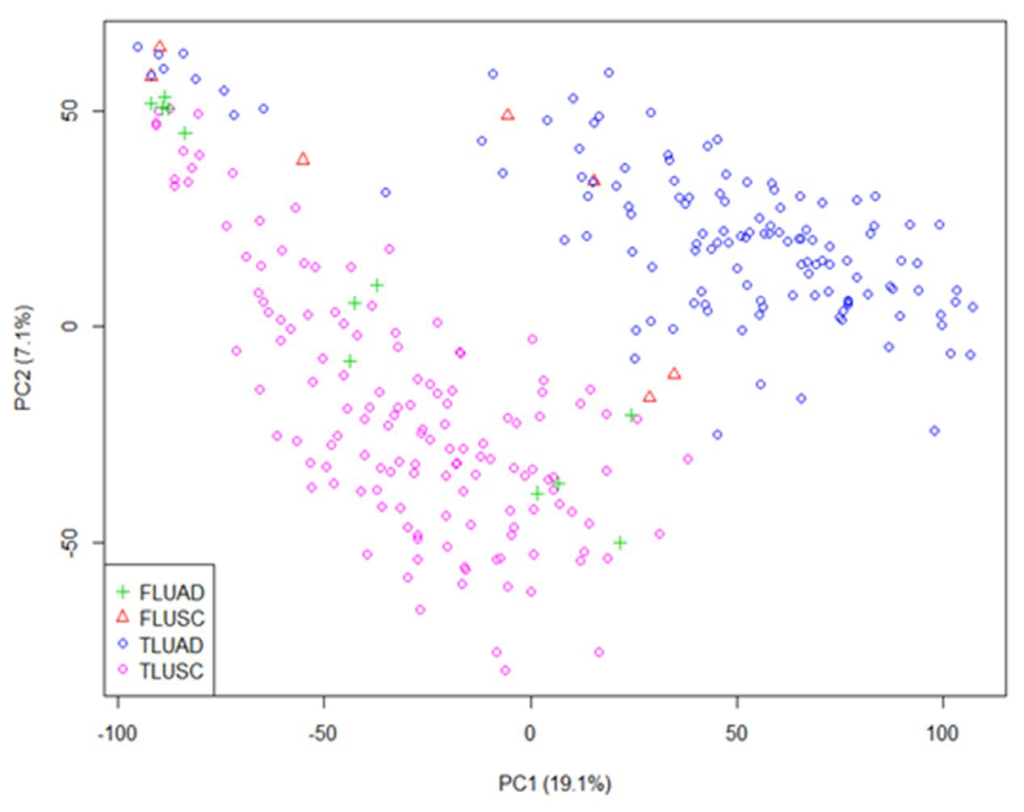
Figure 2 shows the classification result from one replication. The test dataset for this replication included 145 LUAD and 137 LUSC cases. Among them, 7LUAD cases (red triangle) were classified into LUSC and 12LUSC cases (green plus) were classified into LUAD. The AUC value was 0.974 if only the first two principal components (PCs) were used. To explore whether increasing number of PCs in the model would help to reduce the misclassification rates and increase the AUC value, we considered a model including the first thirteen PCs. We got the same overall misclassification rate and same misclassification rates for LUAD and LUSC from the selected model using the same cutoff point. The AUC value was 0.985, slightly higher than the AUC value from using only two PCs. Since by only using the first two PCs, LUAD and LUSC were well separated, we only recorded genes with large effects from the first two PCs.
Figure 2: Classification Result from the First Two Principal Components. FLUAD: LUSC Cases Classified as LUAD; FLUSC: LUAD Cases Classified as LUSC; TLUAD: LUAD Cases Classified as LUAD; TLUSC: LUSC Cases Classified as LUSC. This Figure Shows the Result of one Replication. For this Replication, the First Principal Component Explains 19.1% of the Variance and the Second One Explains 7.1% of the Variance.
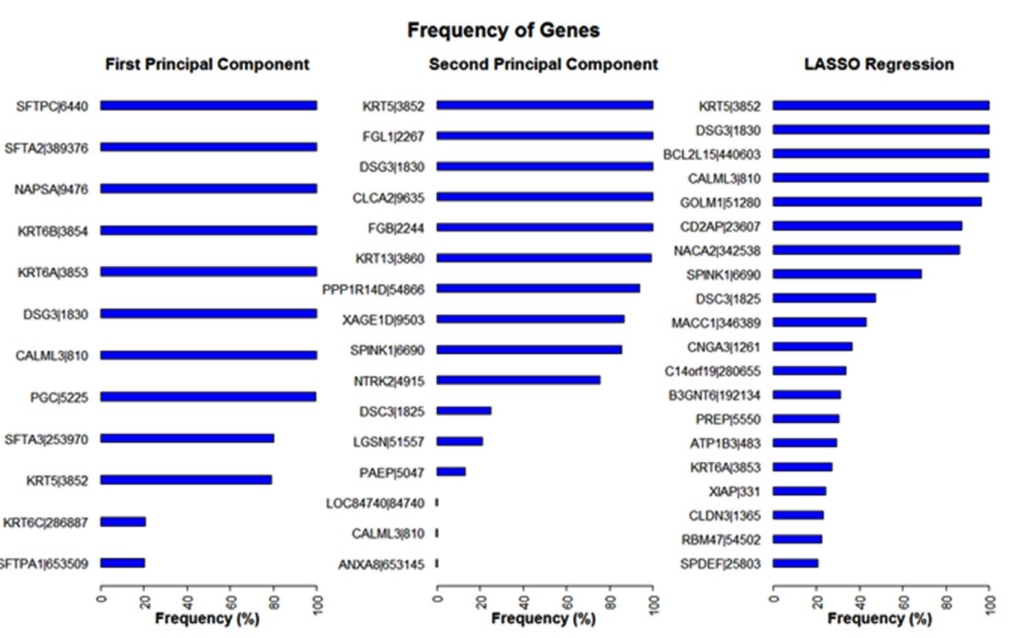
Frequencies of genes identified by the first two principal components from PCR and by the selected model from LASSO are shown in Figure 3. There are 12 genes identified by the first principal component, 16 genes identified by the second one, and 408 genes identified by LASSO. We only display 20 genes with the highest frequency from LASSO. Among all identified genes, 21 genes have a 90% or higher frequency rate. Three genes, CALML3, DSG3, and KRT5 were identified by both PCR and LASSO.
Figure 3: Frequency of Genes Identified by PCR and LASSO. Frequencies are shown in Percentages. We use Frequency Rates to Describe. Results are based on 500 Replications. A 100% Frequency Rate Means the Gene was Recorded in all 500 Replications.
DISCUSSION
In this paper, we considered three different statistical methods to classify LUSC and LUAD patients based on their gene expression profiles. All the three methods have a low overall misclassification rate of less than 9% and high AUC of greater than 0.96.
Our analyses demonstrate that gene expression data can accurately discriminate LUSC and LUAD samples, which does not specifically depend on the choice of statistical method. Therefore, gene expression profile may potentially be used in clinicly or in clinics to enhance the diagnosis of LUSC and LUAD.
One issue we had was to standardize the data. Some genes have many zero values. After we split the whole data into subsets, the subsets may contain all zeros for certain genes, and those genes could be different in training and testing data, and they could also be different for each replication. To confirm the results that we got for all three methods, we removed all genes that have constant zeros for all subsets. This further reduced the number of genes included in the analysis. Then we applied three methods again on the standardized data. No significant changes were seen after the standardization. Therefore, we chose to process the data without standardization.
The model fitting based on the KNN method was sometimes unstable in our analysis. It might have been caused by the high dimensions of the data. Different algorithms on distance metric could be used to improve the classification. Also, we only tested a number of neighbors (K) from 1 to 20. Larger K may improve the diagnostic performance. In contrast, PCR and LASSO were very stable. As for computational time, both PCR and LASSO were considerably less than it was for KNN. On average, one replication took less than 1 minute and less than 10 seconds for PCR and LASSO, respectively. One KNN replication for K from 1 to 20 took more than 10 minutes. When we increased K, the computation time increased significantly. Since PCR and LASSO performed better on sub-typing LUAD and LUSC and had shorter computation time, we consider PCR and LASSO to be better methods than KNN.
Another advantage of PCR and LASSO is that we are able to get information on the contribution of each gene. Among those genes identified by our methods, SFTA3, DSG3, DSC3, and CALML3 were found to be useful to distinguish LUAD and LUSC from each other using an earlier version of TCGA data.4 In addition, DSG3, NAPSA, KRT5, KRT6A, KRT6B, and SFTA2 were identified as potential biomarkers for distinguishing between the two subtypes using different data sources.3,9,10 Unlike our study, those studies applied various differently expressed gene screening methods to identify potentially informative genes. Although, our main aim is to discriminate LUAD versus LUSC, we successfully identified many genes which were found in other studies. We believe that those high dimension reduction methods can help to discover potential biomarkers to distinguish between the two subtypes. Those methods also can be applied to other disease types known to have different molecular profiling.
ACKNOWLEDGEMENTS
The authors wish to thank Richard Charnigo for helpful comments. This research was supported by the Biostatistics and Bioinformatics Shared Resource Facility of the University of Kentucky Markey Cancer Center (P30CA177558).
CONFLICTS OF INTEREST
The authors have no conflicts to declare.


