INTRODUCTION
Asthma affects approximately 10% of the population in the United States and its prevalence has almost doubled in the past 20 years.1,2 In India, its prevalence varies between 2.4 to 31.14% from different parts of the country.3,4 Airway inflammation, persistent airway hyperresponsiveness (AHR) and airway obstruction are the main characteristics of asthma.5 Onset of this disease starts with the sensitization to an allergen, followed by IgE-mediated response, mast cell degranulation, bronchoconstriction and recruitment of inflammatory cells. In addition, during progression of the disease, structural changes in the airways like; goblet cell hyperplasia, smooth muscle thickening and subepithelial and airway wall fibrosis are known to occur.6,7,8,9,10
Asthma is triggered by various stimuli including virus, environmental pollutants, tree and weed pollens, cold air, exercise etc.11,12 The response of airway cells to these stimuli is mediated through activation of distinct transmembrane signaling intermediates.13 The activation of protein kinase C (PKC) signaling pathway is one of the key players in asthma pathogenesis.14,15 Previously, we and others have shown that inhibition of PKC reduces the activation of lymphocytes, inhibits the expression of Th2 cytokines by T lymphocytes from asthmatic patients,16,17 abolishes airway smooth muscles constriction,18 and inhibits the proliferation and structural changes in airway smooth muscle cells from asthmatic rats.19 In another study, inhibition of PKC by calphostin-C, prevented proliferation of bovine tracheal smooth muscle cells following activation of mannose receptors by β-hexosaminidase and also abolished Ca2+-dependent and -independent PKC activity20 which suggests involvement of different isoenzymes of PKC.
Thus, it is evident that PKC plays a pivotal role in the pathophysiology of asthma. In most of the studies, investigations were carried out after the disease was established and there is no report available on the role of PKC in the etiopathogenesis of the disease. We, therefore, hypothesized that PKC mediated signal transduction pathway might be playing an important role in the onset of the diseases.
MATERIALS AND METHODS
Ethics Statement
The study was approved by the Animal Ethics Committee of Vallabhbhai Patel Chest Institute, University of Delhi, Delhi, India.
Study Design
The experiments were conducted on guinea pigs. The animals were sensitized by ovalbumin using standards protocol. The control group received the vehicle alone. The sensitization of the animals was checked every day by intradermal (ID) test using ovalbumin. The day, the sensitized animals showed a positive reaction for the first time, was recorded. The airway responsiveness to ovalbumin was measured by non-invasive body-plethysmography technique daily starting from on day 0 (baseline) till the day when the sensitization was observed by intradermal test for the first time (onset) and finally the day of maximum positivity. Besides it, the cytology BALF and histopathology of lung tissue was also performed to assess the airway changes in the lungs (Figure 1). These parameters established day 9 to be the day of onset of hypersensitivity and day 14 to be the day of maximum hyper-responsiveness. The animals were divided in two main groups, the control an experimental. Each group had 15 animals. Five animals from each group were taken for experiments on day 0, day 9 and day 14. Blood was collected from each animal directly from the heart for preparing the peripheral blood lymphocytes. The animals were then sacrificed by cervical dislocation. For assessment of inflammatory changes, bronchialveolar lavage fluid (BALF) was collected for cytology and lung removed and preserved for histopathological examination. For biochemical studies, the trachea and bronchi were removed and airway smooth muscles (ASM) dissected out. The ASM homogenate and lymphocyte lysate were prepared, followed by identification, characterization and quantification of phosphoinositides by thin layer chromatography (TLC), total PKC activity assay by radio-binding and histone phosphorylation methods. The data were analyzed statistically. p<0.05 was considered significant.
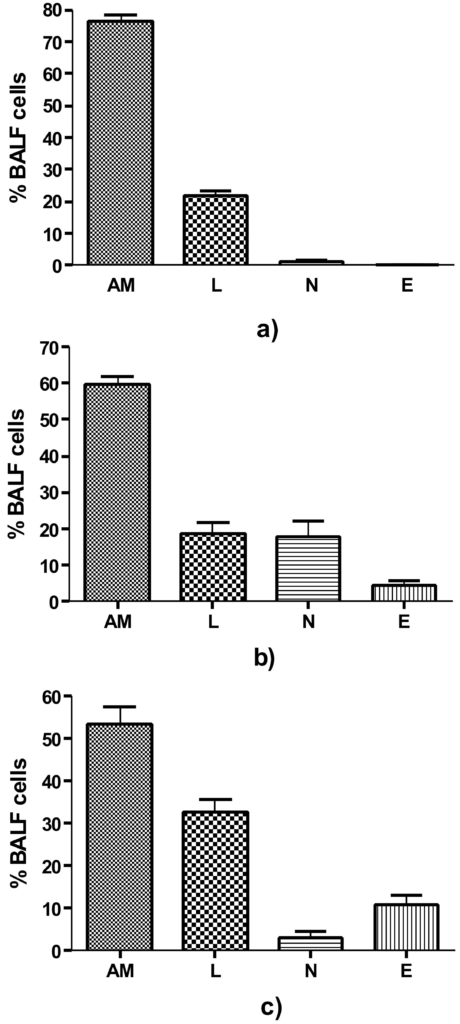
Figure 1. BALF Differential cell count (a) Control group i.e. on day 0, comprising predominantly of AM, (b) On day 9, Significant increase in N and E (p=0.002 and p=0.016 respectively) as compared to control and (c) on day 14, AM showed significant decrease to 53.20±4.23% (p<0.0001) and a significant increase in E to 10.80±2.48%, (p=0.0001) as compared to control. AM=Alveolar Macrophages, N=Neutrophils, E = Eosinophils and L= Lymphocytes
Chemicals and Reagents
Radioactive Chemicals: [3H] Phorbol 12, 13 dibutyrate ([3H] PDBu) (specific activity 23.5 Ci/mM), was purchased from Amersham Biosciences, UK. [32P]-γ-ATP (specific activity 4000 Ci/mM) was purchased from BRIT, Mumbai, India. Histopaque (sp. gravity 1.077), ovalbumin (Grade V), L-α phosphatidyl inositol (PI), L-α phosphatidyl inositol 4 monophospahte (PIP), L-α phosphatidyl inositol 4, 5 bisphospahte (PIP2), L-α phosphatidyl serine (PS) were purchased from Sigma Chemical Co. St Louis., USA.
Sensitization of Guinea Pigs
The animals were sensitized with 100 µg ovalbumin and 100 mg aluminum hydroxide per ml of normal saline.21 Control group animals received the vehicle alone. The antigen-adjuvant solution was agitated vigorously on a vortex mixer for 90 minutes and 0.5 ml injected intraperitoneally and 0.5 ml subcutaneously by dividing the amount equally among 5 different sites near the lymph nodes, viz. cervical, axillary, lumbar regions, neck and inguinal. This protocol results in sensitization of guinea pigs.
Specific Airway Conductance (SGaw)
SGaw was determined by dividing airway conductance by the lung volume (SGaw=Gaw/TGV). It was measured by non-invasive whole body plethysmography technique.20 Briefly, the box pressure and airflow was measured (Validyne PM 18 differential transducers) and the signal amplified (CD 12 carrier demodulators). The box pressure signal was fed on the X channel and airflows on the Y channel of oscilloscope (Hewlett-Packard, USA) to obtain an X-Y plot.22
Collection of Broncho-Alveolar Lavage Fluid and Cytology
The bronchoalveolar lavage fluid (BALF) was collected by exposing the trachea as per the method described earlier,23 and physiological saline (8 ml, 37 ˚C) was injected in the lung and lavaged twice. The lavage fluid obtained was centrifuged at 500 × g for 10 min at 4 ˚C. The cell pellet was given osmotic shock to eliminate the erythrocyte contamination as described by Bansal.24 The cell suspension was centrifuged as before, pellet washed twice with saline and resuspended in 100 µl saline. The total cell count was performed using a Neubaur’s Counting Chamber. Smears were stained with Giemsa stain and differential count performed on at least 300 cells in each case.
Histopathology of Lung
A histopathological study of lungs was carried out as described by Underwood et al.25 Briefly, the lungs were removed, half the portion fixed by slowly inflating with buffered formaline and subsequently embedding in paraffin. 5 µm thick sections were stained with haematoxylin and eosin. Lung parenchyma was assessed for changes in bronchi and bronchioles. Peribronchiolar inflammation was assessed and graded on the scale of 0-3.26 Gomori’s stain for reticular fibers to demonstrate thickening of the sub-epithelial lamina reticularis and Masson Trichrome stain to demonstrate sub-epithelial collagenization were also used.
Preparation of Airway Smooth Muscles (ASM) Extract
The trachea was harvested after sacrificing the animal, and adhering extraneous material to it was carefully removed, smooth muscle portion dissected out, washed in chilled saline and soaked over a clean filter paper. The tissue was then weighed and suspended in 9 volumes of homogenizing buffer (25 mM tris HCL pH 7.5, 2 mM EGTA, 2 mM EDTA, 2 mM DTT, 1 mM PMSF, 250 mM sucrose) and homogenized in a glass homogenizer in an ice-water bath. Homogenate was then centrifuged at 700 × g for 5 min as above and supernatant used for subsequent analysis.
Preparation of Peripheral Blood Lymphocytes (PBL) Lysate
The peripheral blood lymphocytes were isolated by the method of Boyum.27 Briefly, blood was diluted 1:1 with saline and carefully layered over histopaque (specific gravity 1.077) and centrifuged at 2000 rpm (Rotor no. 9, Rota 4R-V/FM Plasto Crafts, Mumbai, India) for 10 minutes. The opaque ring at the interface containing lymphocytes was collected, diluted with saline and centrifuged at 1500 rpm for 10 minutes. The pellet was washed twice with saline. Contaminating erythrocytes were lysed by incubating the pellet in 0.85% ammonium chloride solution. The PBL lysate was prepared by sonicating the cell suspension in the homogenizing buffer in an Ultrasonicator (Misonix Ultrasonic Processor XL- 2020) by giving five bursts of 30 sec each at an interval of one min at 0 ˚C in an ice-water bath. The cell lysate was centrifuged at 700 × g for 5 minutes and supernatant saved for subsequent analysis.
Protein Estimation
Protein contents of the ASM extracts and PBL lysate were quantified by the method of Lowry et al.28 Equal amount of proteins from different experimental groups was used for further analyses and determinations.
Phosphoinositide Assay
Phosphoinositides were extracted and resolved by TLC as described by Bansal et al.29 Briefly, the ASM homogenate or lymphocytes lysate (0.5 ml) in 10 mM LiCl solution containing one mg total protein was thoroughly mixed with 1.8 ml of acidified chloroformmethanol mixture (CHCl3: CH3OH: HCL; 100:200:2; v/v/v), followed by addition of 0.6 ml of chloroform and 0.6 ml of 2 M KCl. After thorough mixing, the contents were centrifuged at 500 g for 5 min at room temperature, aqueous and organic phases carefully separated and saved in separate tubes. The pellet was washed again with 2 volumes acidified chloroformmethanol mixture and aqueous and organic phases carefully separated and pooled. Organic phase containing phospholipids was dried under the stream of N2 and stored at 4 ˚C till analyzed. Phospholipids were resolved by TLC on silica gel G plates impregnated with 1% potassium oxalate and 1 mM EDTA.30 The spots corresponding to the standards were scraped. The bands of each phosphoinositide were processed for estimation of total phosphorus by the direct gel digestion method of Misra.31
Protein Kinase C (PKC) Assay
PKC in ASM extracts and PBL lysate was assayed by two different methods viz. radio-ligand binding assay and histone IIIS phosphorylation as described earlier.32
For radio-ligand binding assay, briefly, to 25 µl of reaction mixture (50 mM tris HCl, pH 7.5, 1 mM CaCl2, 0.1% BSA, 20 mM MgCl2∙6H2O, 2 mM DTT, 5 mg/ml phosphatidyl serine (PS) and 1 µCi/ml [3H]-PDBu) in triplicate, 25 µl sample (30-50 µg protein) was added to each tube to start the reaction and contents incubated at 30 ˚C for 25 minutes. In one of the test tubes, phorbol 12-myristate 13-acetate (PMA) was added (final conc 5 µM) which served as control for the non-specific binding. The reaction was terminated by adding 2 ml chilled 10 mM tris-hydrochloride (pH 7.5). The contents were filtered on what man glass fibre filter (25 mm GF/C), washed twice with chilled 10 mM tris HCL (pH 7.5) and processed for radioactivity counting in a liquid scintillation counter (Beckman LS 6500, CA, USA). PKC activity was expressed as femtomoles [3 H]-PDBu bound per mg protein under the experimental conditions.
For histone IIIS phosphorylation assay, the standard reaction mixture (50 μl) containing 50 mM tris HCL pH 7.5, 50 µM ATP, 10 mM MgCl2∙6H2O, 100 µM CaCl2∙2H2O, 50 µg histone IIIs, 5 µg PS and 32P-γ-ATP (0.1 µCi, sp. activity 4000 Ci/mM) was kept on ice. The reaction was started by addition of 50 µl of sample containing 50 µg proteins. The tubes were vortexed and incubated for 3 minutes at 30 ˚C in a metabolic shaker. The reaction was stopped by the addition of one ml chilled 20% trichloroacetic acid (TCA). Acid precipitable material was collected on a Millipore membrane filter HA type (25 mm, 0.45 µm) under vacuum using a manifold filtration device (Millipore). The filters were washed with one ml of TCA (10%) followed by washing with 2 ml ethanol, transferring of the filters into scintillation vials containing 5 ml dioxane-based scintillation fluid and counting of radioactivity using Beckman LS 6500 liquid scintillation counter. PKC activity was expressed as femtomoles of 32P-transferred to histone IIIs per mg protein under experimental conditions.
Quantitation of IgE
Total IgE in the BAL fluid was quantitated with a sandwich ELISA protocol. Briefly, the plates were coated with affinity-purified rabbit anti-IgE overnight at 4 °C and then blocked with 1% BSA in PBS for 1 h at 37 °C. The BAL fluid samples and appropriate dilutions of a standard IgE preparation were placed in the wells, and the plates were incubated for 3 h at 4 °C. Sample blank wells did not receive BAL fluid but were otherwise treated similarly. The bound IgE was detected with polyclonal goat anti-IgE Abs (incubation for 1 h at 37 °C), followed by HRP-conjugated rabbit anti-goat Abs (incubation for 1 h at 37 °C). The plates were developed by addition of OPD and read in an ELISA plate reader at 490 nm.
RESULTS
Ag-Specific Ige Is Present In Bal Fluid From Guinea Pigs With Allergic Airway Inflammation
IgE was detectable in BAL fluid from Ova-sensitized mice exposed to just one dose of aerosolized OVA, when the fluid was obtained 24 h after the Ag exposure. Significantly higher levels were detected after six Ag exposures, at both 3 and 24 h after the last exposure. Control mice that were sensitized to OVA but were exposed to aerosolized PBS did not show detectable levels of IgE. The levels of IgE in general correlated with eosinophilia.
Determination of Airway Hyper-Responsiveness during Onset of Immune Response
After determining the allergen specific immune response, we measured the specific airway conductance (SGaw) on days 1-14 in control and sensitized guinea pigs by whole-body plethysmography. On day 0, the SGaw of control group was 0.95±0.02 sec−1 cm H2O−1 (Mean±SEM) and that of experimental group (immediately after sensitization) was 0.89±0.03. There was no significant change in SGaw between day 1 and 8 (data not shown) in sensitized group as compared to the control group. However, on day 9, there was >35% (36.88%±0.55%) fall in SGaw after ovalbumin inhalation in experimental group while in control group the fall was only 21.80±1.250 and the changes were statistically significant (p<0.0001), indicating that day 9 was the accurate time point of onset of the airway hypersensitivity after sensitization. On day 14, there was a further decrease (43.91%±2.131%) in SGAw (p<0.0001) as compared to control (21.14±1.60). Since there was no significant change in SGawon day 7 and 8, we concluded day 9 to be the day of onset of airway hypersensitivity.
Determination of Cytological, Pathological and Biochemical Changes during the Onset of Airway Hypersensitivity
BALF total and differential cell count was done on day 0, 9 and 14 in control and experimental group animals. The total BALF cell count in control group on day 0 was 1.9±0.14 × 10⁶ cells/animal. In experimental group on day 0 there was no significant change, but on day 9, a significant increase in the total cell count to 3.925±0.09 × 10⁶ cells/animal (p<0.001) and on day 14 to 6.203±0.12 × 10⁶ cells/animal (p<0.001) was observed. On day 14, the alveolar macrophages showed further decrease to 53.20%±4.23% (p<0.0001) as compared to control. There was a significant increase in eosinophils to 10.80%±2.48%, (p=0.0001) but decrease in neutrophils to 3.30%±1.23% as compared to day 9 (p<0.003) although the number was still significantly higher (p<0.034) than that of day 0. The lymphocytes in BALF significant increased to 32.70%±3.07%, (p<0.0001) on day 14.
Histological analysis of lung sections
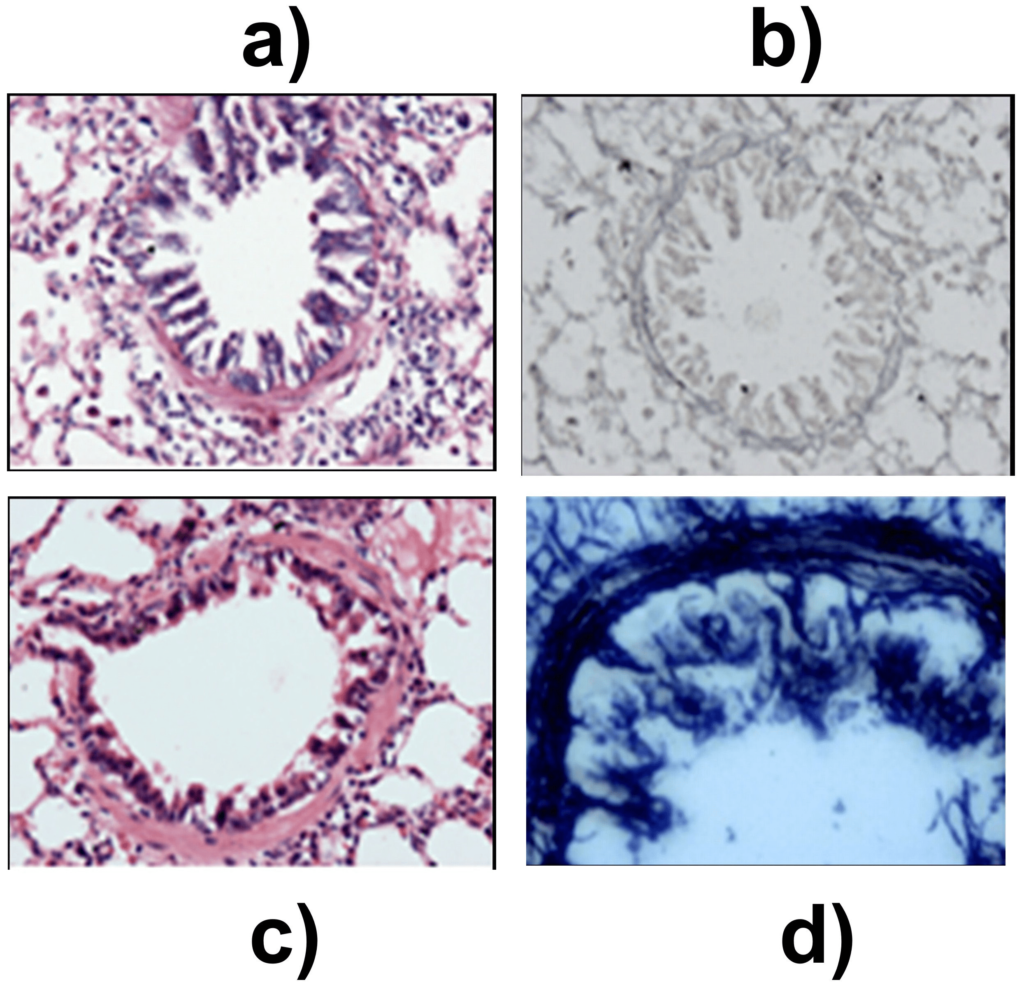
The histopathological changes in the proximal and distal airways were determined to assess the initiation of airway hypersensitivity. In the proximal airways of sensitized animals, an increase in thickness of airway smooth muscle and multiple areas of epithelial denudation was observed on day 14 when compared to control (Figures 2a and 2b). These changes were not observed on day 9. The distal airways revealed grade 1, peribronchiolar chronic lymphocytic inflammation when compared to control on day 9 (Figures 3a and 3b). On day 14, pathological changes were of grade 2 which corresponded to infiltration of lymphocytes and eosinophils in the lung (Figure 3c). Further, the onset of structural remodeling of proximal and distal airways was observed in experimental group on day 14 in which ASM hypertrophy was seen in proximal airways (Figure 4a) while distal airways showed a mild increase in thickness of the subepithelial lamina reticularis (Figures 4b, 4c and 4d) as compared to control group.
Figure 2. Pathological changes in proximal airways on day 14. H&E stain x 40. (a) Control group; showing normal histopathology and (b) Experimental group on day 14 showed epithelial denudation and airway smooth muscle hypertrophy.
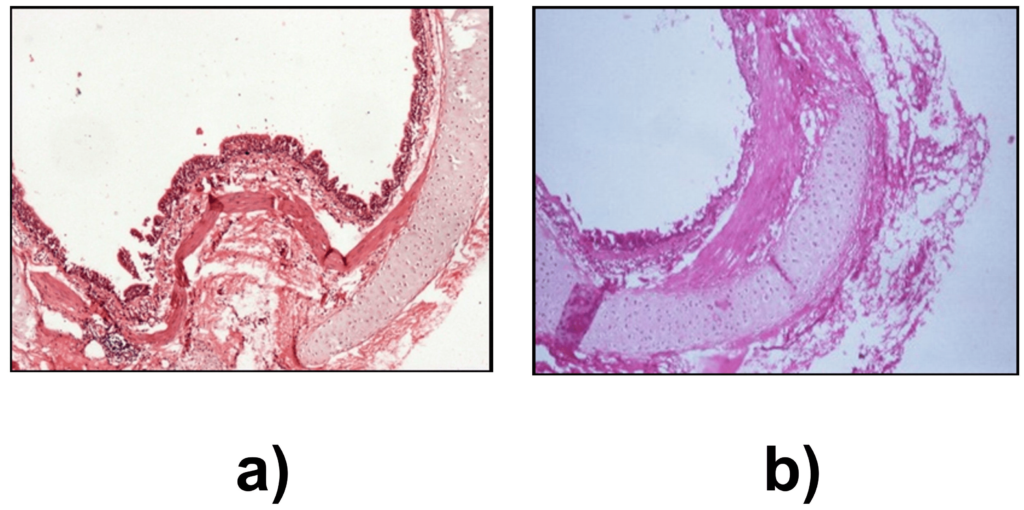
Figure 3. Distal airway inflammation, graded for peribronchiolar inflammation and percentage of eosinophilia H&E stain x 100. (a) Control group, normal bronchiole and lung parenchyma. (b) Grade 1 peribronchiolar inflammation on day 9 and (c) Grade 2 peribronchiolar inflammation on day 14, comprising of eosinophils and lymphocytes.
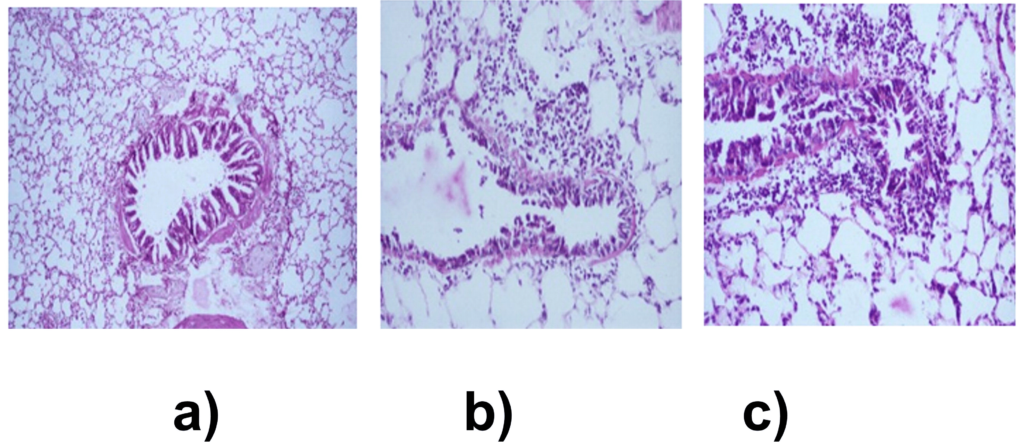
Figure 4. Structural changes in the distal airway. (a) Control group, H&E stain x 200. (b) Control group Gomori silver methenamine stain (GMS) x 200. (c) On day 14, mild increase in thickness of the subepithelial lamina reticularis, H&E stain x 200. (d) Laying down of reticulin fibres on day 14, in subepithelial region highlighted by GMS stain x 400.
PKC Activity and Expression of Its Isoenzymesin Airway Smooth Muscles (ASM) and Lymphocytes
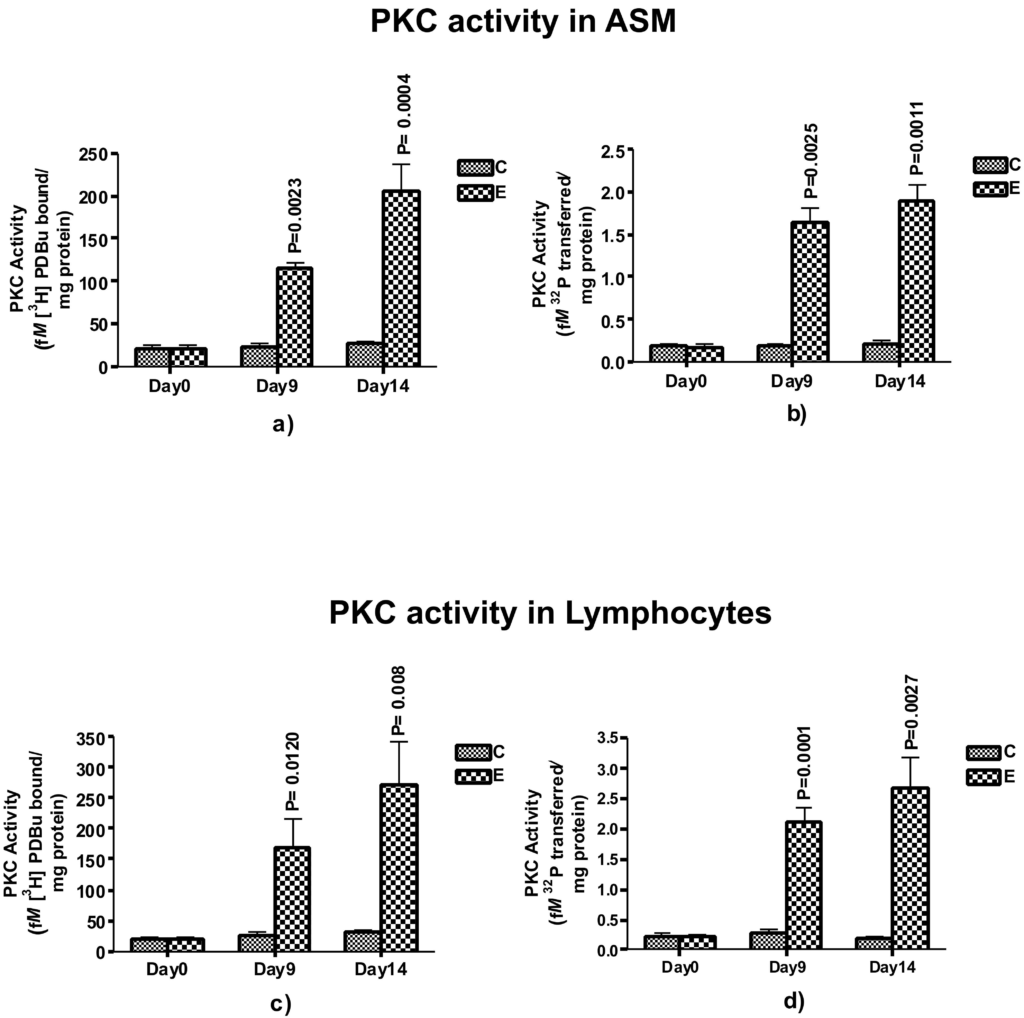
To test our hypothesis that PKC could be a critical player during the initiation of airway hypersensitivity after sensitization, we examined the total PKC activity in ASM (Figures 5a and 5b) and lymphocytes (Figures 5c and 5d) isolated from control and ovasensitized group on days 0, 9 and 14. On day 0, there was no significant change in the PKC activity in ASM and lymphocyte as compared to control group. However, on day 9, PKC activity, measured by two different methods, increased significantly in ASM (p=0.0023 and 0.0025 by radioligand and histone III phosphorylation methods, respectively) and lymphocytes (p=0.0120 and 0.0001 respectively). On day 14, the PKC activity further increased significantly in ASM (p=0.0004 and 0.0011 respectively) as well as lymphocytes (p=0.008 and 0.0027 respectively). The increase in PKC activity on day 9 and further was >45%, suggesting physiological activation of the enzyme at the onset of the airway hypersensitivity. Since increase in the activity as well as expression of PKC coincide with the days of Ova-induced airway hypersensitivity, these results suggest that PKC could be a key mediator of initiation of airway hypersensitivity in guinea pigs.
Figure 5. Assessment of PKC activity in Airway smooth muscle (ASM) and blood derived-lymphocytes. The PKC activity was measured by radio-ligand binding assay (a and c), expressed as mean±SEM femtomoles of [3H] DBu bound /mg protein in ASM or per 106 lymphocytes and Histone phosphorylation (b, d,), expressed as mean±SEM femtomoles of 32P transferred to IIIs histone per mg proteins in ASM or per 106 lymphocytes. The activity is shown in control and experimental groups on day 0, day 9 and day 14 representing baseline, the onset and full sensitization respectively (n=5 in each group).
Phosphoinositide turnover in Airway Smooth Muscles and Lymphocytes
Since PKC activity is regulated by the metabolic pool of phosphoinositides and their turnover, we next examined the changes in the total phosphoinositides in ASM and lymphocytes during the initiation of airway hypersensitivity. The phosphoinositides extracted and estimated were phosphatidyl inositol (PI), phosphatidyl inositol 4-monophosphate (PIP) and phosphatidyl inositol 4,5- bisphosphate (PIP2). In experimental group on day 0, there was no change in PI, PIP and PIP2 levels in ASM and lymphocytes as compared to control group (Table 1). On day 9, the level of PI increased significantly in ASM (p=0.0181) and lymphocytes (p=0.0087) as compared to control group. Similarly, the levels of PIP increased significantly in ASM (p=0.0285) and lymphocytes (p=0.0076) as compared to control group. The levels of PIP2 also increased significantly in ASM and lymphocytes (p=0.0258 and 0.0020) as compared to control group on day 9. On day 14, the levels of these phosphoinositide intermediates increased further in both ASM and lymphocytes as summarized in Table 1. These results suggest that increased activity of PKC isoenzymes during initiation of airway hypersensitivity could be associated with increased levels of phosphoinositides in ova-sensitized and challenged animal.
| Table 1: PhosphoinositidesΨ in airway smooth muscles (ASM) and lymphocytes in control and experimental groups on various days after sensitization with ovalbumin. |
| Day |
Phosphoinositide |
ASM |
Lymphocytes |
| Control |
Experimental |
Control |
Experimental |
| 0 |
PI |
0.328±0.028 |
0.310±0.019 |
0.336±0.047 |
0.293±0.002 |
| PIP |
0.208±0.007 |
0.237± 0.018 |
0.229±0.008 |
0.304±0.043 |
| PIP2 |
0.367±0.022 |
0.305±0.056 |
0.354±0.020 |
0.336±0.054 |
| 9 |
PI |
0.339±0.047 |
0.624±0.036* |
0.272±0.047 |
0.664±0.036** |
| PIP |
0.240±0.045 |
0.415±0.008* |
0.253±0.018 |
0.478±0.043** |
| PIP2 |
0.312±0.009 |
0.516±0.057* |
0.345±0.029 |
0.651±0.005** |
| 14 |
PI |
0.270±0.016 |
0.704±0.074* |
0.358±0.041 |
0.862±0.014** |
| PIP |
0.264±0.039 |
0.449±0.042* |
0.282±0.032 |
0.450±0.030* |
| PIP2 |
0.315±0.035 |
0.722±0.045** |
0.311±0.033 |
0.794±0.065* |
ΨExpressed as µg Pi/mg proteins (Mean±SEM), n=5 in each group
PI: Phosphatidyl inositol; PIP: Phosphatidyl inositol 4-monophosphate; PIP2: Phosphatidyl inositol 4, 5 bisphosphate.
p*< 0.05,**<0.01 |
DISCUSSION
Asthma is a multifactorial airway inflammatory disease, characterized by airway inflammation, structural changes in the airway wall associated with progressive decline in lung function, and airway hyperresponsiveness (AHR).5 Most of the studies on bronchial asthma on the mechanism of stimulus-induced changes have been conducted after the manifestation of the disease, which do not represent its etiopathogenesis. We, therefore, investigated the biochemical changes in airway hyper reactive guinea pig model of asthma and have presented evidence that PKC isoenzymes could be key mediators in the initiation of airway hypersensitivity during the onset of asthma. Previously, several investigators have suggested that PKC plays an active role in the progression and exacerbation of asthma.16,17 We have also demonstrated that PKC antagonist sphingosine reduced the T lymphocytes activity isolated from asthmatic patients.16 Further, PKC inhibitor, Ro31-8220, has been shown to inhibit the expression of Th2 cytokines from asthmatic T lymphocytes,17 abolish airway smooth muscles constriction18 and inhibit the proliferation and structural changes in airway smooth cells of asthmatic rats.19 In another study, Lew et al20 showed that calphostin-C, a PKC inhibitor, prevented proliferation of bovine tracheal smooth muscle cells following activation of mannose receptors by β-hexosaminidase and also abolished Ca2+-dependent and -independent PKC activity. These evidences clearly demonstrate the role of PKC in asthma, but its role during the onset of the disease is not clearly understood. We therefore investigated the biochemical and molecular changes in airway hyper reactive guinea pig model of asthma and have presented evidence that PKC isoenzymes could be key mediators in the initiation of airway hypersensitivity during the onset of asthma.
Immunoglobulin E (IgE) plays a central role in the pathogenesis of allergic diseases, including asthma.33,34 Allergic sensitization results from the formation of antigen-specific IgE in response to common inhalant allergens.35,36 In our present study, on day 9 after sensitization the animals in the experimental group showed a significant positive response in i.d. which indicate that allergen-specific IgE were synthesized in enough amounts which could respond to the antigen as early as day 9. When these animals inhaled ovalbumin, they showed a significant airway hypersensitivity on day 9, suggesting that day 9 was the accurate time point for the onset of the disease. The changes were further confirmed by histopathology of the lungs, e.g. there was a significant increase in the total BALF cell counts on day 9, the first day of initiation of hypersensitivity in experimental group, which further increased (3.5 fold) on day 14, similar to the findings of Sakai et al.37
PKC is one of the key enzymes that mediate inflammatory signals.38 It represents a structurally homologous group of 12 isoforms which are divided into three sub-groups that differ in their cofactor requirements. These are conventional(c) PKC isoforms (α, βI, βII and γ) that require Ca2+ and diacylglycerol (DAG) for activation, novel (n) PKC isoforms (δ, ε, ζ, θ and μ) that are Ca2+ independent but require DAG and the atypical (a) PKC isoforms, namely ζ, ι and λ (the mouse homologue of human PKCι), that do not require Ca2+ or DAG.14,39
One of the major signaling pathways that involves PKC is the hydrolysis of membrane PIP2 by phospholipase C (PLC) that generates IP3 and DAG,14,40 which then activate PKC.40 Activated PKC then phosphorylates downstream signaling protein kinases leading to activation of transcription factors such as NF-kB which in turn transcribe many inflammatory genes resulting in inflammatory response and pathophysiological changes in affected cells. In views of this, the role of PKC isoenzymes is crucial in the activation of inflammatory signals. PKC activity is influenced by the metabolic pool of phosphoinositides and their turnover.41 The increase in phosphoinositides pool may be due to their increased biosynthesis or decreased breakdown by the phosphomonoesterases. The phosphoinositides are metabolized by two different pathways. In one pathway activation of phosphoinositide- specific phospholipase C (PLC) leads to the generation of diacylglycerol (DAG) and inositol triphosphate (IP3) which act as second messengers and activate PKC.42 In the other pathway, phosphatidyl inositol -3 kinase (PI-3K) phosphorylates and converts the inositol of various phosphoinositides into respective phosphoinositide 3 phosphate species,41,42 the levels of which are regulated by specific phosphatases. We observed that the total contents of the phosphoinositides (PI, PIP, and PIP2) were significantly increased on day 9 after Ova-sensitization, which coincided with significantly increased antigen-specific immune response and airway hypersensitivity. The increase in the levels of PIs was associated with corresponding increase in the total PKC enzyme activity in airway smooth muscles and blood lymphocytes. These changes were further confirmed by the histopathological changes of the distal airways which showed lymphocytic infiltration (pathological grade 1), suggesting that increased activity and expression of PKC could lead to the activation of T cells and play a pivotal role in the pathophysiology, specifically during initiation of asthma. The increased PKC α activity on day 9 suggests the activation of conventional PKCs which require calcium and DAG for their activation.39 It is known that increase in intracellular calcium is transient and tightly regulated. After being released from intracellular pools, the level of calcium returns to normal rather quickly,40 suggesting that initiation of airway hypersensitivity and inflammation on day 9 could involve activation of PKC α, which probably trigger the onset of the disease. However, for long term sustenance of the pathology as in chronic asthma, calcium-independent mechanism will be required.40 Ono et al have suggested that novel PKCs do not require calcium for their activation and have been implicated in the progression of asthma.43 The significantly increased expression of PKCε by day 14, when the immune response was fully established, as evident by maximum i.d. positivity and airway hypersensitivity, indicates that sustained activation of novel PKCs in ASM and lymphocytes could be responsible for the progression of the disease. Since in our study there was no change in the expression of PKC-τ on day 9, it could be stipulated that atypical PKCs, whose activation is independent of calcium and/or DAG, do not play any significant role in the onset of the airway inflammation.39 These findings suggest that the onset of airway inflammation requires Ca2+ and DAG initially and activation of DAG-dependent mechanism in the later stage of asthma pathogenesis.
In summary, the results of this study suggest that PKC signal transduction pathway participates in onset of airway hypersensitivity and inflammation by regulating activation of lymphocytes and ASM. Therefore, the use of PKC antagonist may be a promising approach towards prevention of asthma.
CONCLUSION
The study established the day 9th to be the day of onset of airway inflammation and hypersensitivity in the guinea model of ovalbumin and day 14th to be the day when the hypersensitivity is fully developed. During the onset of the disease, the activation of PKC, particularly PKCα and PKCε, mediated signal transduction pathway play a critical role in lymphocyte infiltration and onset of airway hypersensitivity, airway remodeling and asthma pathophysiology. This study is the first one which shows a direct evidence of the role of PKC mediated pathway in the onset of airway hypersensitivity and the mechanism of the etiopathogenesis of the disease in ovalbumin sensitized guinea pig model.


