INTRODUCTION
Digital subtraction angiography (DSA) is the preferred technique in immediate assessment of blood flow for patients with cerebral vascular diseases during neurovascular intervention.1,2,3,4,5 However, assessment of vascular status in a given patient currently depends on the physicians’ intuitive judgment of dynamic contrast agent distribution patterns observed with DSA. Current DSA technology does not display volumetric blood flow rates. Flow in major cerebral blood vessels can be measured with other non-invasive imaging modalities including quantitative magnetic resonance angiography (QMRA),6,7 Xenon-enhanced cerebral tomography,8 single-photon emission computed tomography,9,10 or transcranial Doppler sonography.11 Moreover, perfusion studies in computed tomography, magnetic resonance imaging and positron emission tomography12 enable clinical measurements of microcirculation. However, these advanced imaging modalities are not available during surgery due to space requirements of the scanners. Some procedures are further limited by acceptable radiation dosage and unavailability of these techniques in smaller hospitals. Some studies13,14,15 have also cast doubt on perfusion methods for identifying infarct regions, because they involve image interpretation with respect to arbitrary mismatch thresholds.
Recently, increased acquisition rate in combination with de convolution analysis are beginning to provide metrics of cerebral blood flow, cerebral blood volume and mean transit time using DSA with dual panel detectors.16,17,18 Especially, absolute blood flow quantification in large vessels would be significant to improve the diagnostic capability of DSA. Precise blood flow metrics would help the neuro-interventionalist in defining end Points for the intervention. Blood flow metrics in addition to contrast agent distribution patterns would also ease physicians’ decision making during interventional procedures.
Accordingly, there is considerable research interest in quantifying blood flow with conventional DSA. Waechter19,20 used model-based waveform analysis of the pixel intensity. Tenjin21 correlated mean transit time and peak time to blood flow. Kamp22 performed indo-cyanine green fluorescence angiography during surgery to correlate intensity-time plots to relative blood flow on exposed cortical surfaces. Lieber23 performed micro droplet angiography during selective catheterization to access flow within arteriovenous malformations. Other analytical methods interpret slopes and extremes of the intensity profiles for flow analysis.24,25,26 Inversion-based methods use parameter estimation to infer volumetric blood flow rates.27,28,29 In an extensive review on blood flow estimation,30 inversion was assessed as the most rigorous technique, but also deemed computationally extensive.
In this paper, we first evaluate the consistency and precision of two intensity-based metrics: (i) the relative cerebral angiographic blood flow index (RCABi) and (ii) the time-to-peak index (TTPi). We use four clinical symptomatic arterial steno-occlusive disease cases studies to examine the benefits and limitations of simple flow metrics at baseline and post angioplasty and stenting. We compare flow estimates to volumetric flow rates acquired in vivo for all patients with baseline and post intervention QMRA. We further propose a new inversion technique for blood flow quantification with conventional DSA. The novel technique determines the volumetric flow rates in major arteries by perfectly aligning the DSA concentration profiles measured in vivo with computer predictions performed on a patient-specific blood flow network. We show that DSA absolute blood flow measurements almost reach QMRA accuracy.
MATERIALS AND METHODS
A. DSA acquisition of four patients pre and post intervention
Four patients with steno-occlusive disease were studied. All patients had symptomatic intracranial stenosis that requires angioplasty and stenting intervention. Standard diagnostic DSA data were acquired for all four patients 1-4, before and after intervention from the practice of the Endovascular Section – Department of Neurosurgery at our institution in accordance with Institutional Review Board approved protocols. Age, gender, disease diagnosis, and blood flow assessment of these patient cases can be found in Table 1. All patients had baseline and post-intervention angiograms. Contrast agent was injected into the patients’ internal carotid artery (ICA) in patients 2-4, and into the venous graft supplying the ICA territory for patient-1. In all four cases, there was evidence of diminished intracranial flow in the middle cerebral artery (MCA) as documented by QMRA. DSA data with three frames per second were collected before and after intervention (Leonardo, Siemens; Malvern PA). Dynamic contrast agent distribution was acquired by performing a typical bolus injection in the injected artery. The vasculature of the main arterial network was captured from images taken after constant infusion. DSA images were acquired and stored in DICOM format.
| Table 1: Patient case description |
|
|
Patient 1 |
Patient 2 |
Patient 3 |
Patient 4 |
| Age |
67 |
48 |
45 |
43
|
|
Gender
|
Female |
Female |
Male |
Female |
| Diagnosis |
Vein graft stenosis |
RICA stenosis |
RICA stenosis |
RICA stenosis
|
|
QMRA
(mL/min)
|
ICA(Pre/Post) |
–/– |
93/289 |
–/275 |
94/205 |
| MCA(Pre/Post) |
-34/-57 |
58/157 |
57/215 |
58/175
|
|
ACA(Pre/Post)
|
58/89 |
23/105 |
-12/133 |
14/49 |
| ACA2(Pre/Post) |
44/– |
35/68 |
43/104 |
20/47
|
|
TTPi
(s)
|
ICA(Pre/Post)
|
–/– |
2.58/1.50 |
1.80/0.72 |
1.02/0.66 |
| MCA(Pre/Post) |
2.94/1.14 |
3.12/1.86 |
1.86/1.14 |
0.90/0.84
|
|
ACA(Pre/Post)
|
2.52/1.14 |
3.18/1.74 |
2.25/1.98 |
1.23/0.96 |
| ACA2(Pre/Post) |
3.36/1.50 |
2.94/1.68 |
1.65/1.50 |
0.98/0.78
|
|
RCABi
(s)
|
ICA(Pre/Post) |
–/– |
0.24/0.36 |
0.57/0.80 |
0.34/0.84 |
| MCA(Pre/Post) |
0.20/0.45 |
0.13/0.17 |
0.47/0.42 |
0.14/0.26
|
|
ACA(Pre/Post)
|
0.15/0.35 |
0.14/0.20 |
0.43/0.47 |
0.37/0.33 |
| ACA2(Pre/Post) |
0.12/0.32 |
0.15/0.46 |
0.41/0.39 |
0.18/0.14
|
|
Inversion
(mL/min)
|
ICA(Post) |
— |
263.6±2.6* |
— |
182.9±6.1* |
| MCA(Post) |
— |
168.5±4.0* |
— |
136.6±6.0*
|
|
ACA(Post)
|
— |
56.5±2.5* |
— |
50.1±6.2*
|
The QMRA NOVA flow measurement has the unit of mL/min, –stands for unavailable,
– sign indicates reversed flow. * Stands for 99% confidence region. |
B. Intensity-based flow indices
DSA intensity plots were analyzed with regards to the change in time-to-peak and peak intensity. The relative cerebral angiographic blood flow index (RCABi) was defined as the ratio of the maximum intensity over the rise rate in selected vessels of interest. The rise rate was defined as the time needed for the intensity profile to reach maximum from 25% level of the maximum intensity. The time-to-peak index (TTPi) for a pixel inside an artery was defined as the time needed for the intensity to reach its maximum. We selected individual pixels in vessels of interest to calculate RCABi and TTPi. We also generated two-dimensional maps after computing the RCABi and TTPi for all pixels of the two DSA projection planes. The pixel-by-pixel analyses as well as the two-dimensional maps were generated for both the pre- and post-interventional angiography data.
C. Patient MRI acquisition
To set an independent gold standard for blood flow in major arterie, we acquired cervical and intracranial vessels quantitative MRA non-invasive optimal vessel analysis (QMRA NOVA, Vas Sol Inc. River Forest, IL) measurements before and after intervention. The details of obtaining a QMRA NOVA report are reported elsewhere.6,7 NOVA reports were used as the gold standard and reference to validate flow indices. QMRA measurement was limited to the major branches of the Circle of Willis and proximal branches; small arteries are not accessible to NOVA due to limited MR image resolution.
D. Flow calculation from DSA by image inversion
We propose a novel method to estimate volumetric blood flow rates from DSA images. To uniquely determine blood flow by indirect observation of the contrast agent distribution in space and time, we solved a parameter estimation problem that minimizes the difference between DSA contrast agents intensity and contrast agent profiles simulated for the anatomical hemodynamic network of each patient. The inclusion of anatomical information and flow physics will be shown to be advantageous for accurate blood flow predictions. Parameter estimation, also known as inversion, constitutes a non-linear optimization problem with objective function given in (1) subject to partial differential equation constraints (2-4) The inversion requires three components: (i) intensity plots (ii) an anatomical vascular network model (iii) hemodynamics and an inversion algorithm.
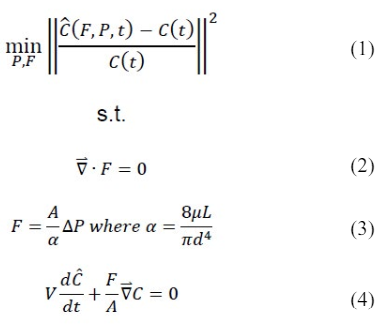
(i) Intensity Plots: Several regions of interest were chosen corresponding to the major arteries connected to the Circle of Willis. Although the method has no such limitation, DSA infusions are often performed only on one side of the patient. In our cases, three patients were injected in the right hemisphere, only patient-1 was infused in the left hemisphere. The image intensities were obtained from the respective DSA frames with the chosen locations in the infused hemisphere. We selected areas of interest including pixels located inside the internal carotid arteries (ICA), middle cerebral arteries (MCA), anterior cerebral arteries (ACA), posterior cerebral arteries (PCA), posterior communicating arteries (PCOM), basilar artery (BA), and anterior communicating artery (ACOM) as shown in Figure 5A.
(ii) An anatomical vascular network model: To relate blood flow and contrast agent intensity distribution acquired with DSA, a computational model of blood flow and dynamic contrast agent convection was established using the patient-specific anatomical network of the cerebral vasculature. We generated a morphologically accurate computer model of the main cerebral arteries emerging from the patients’ Circle of Willis. Due to the unilateral contrast injection used in clinical practice, our model captured only the injected hemisphere. 3D rotational angiography data obtained in patients were used for reconstructing a network model in which each blood vessel was represented by a cylindrical segment of known length and diameter. A stack of 508 DSA images with a resolution of 512×512 were segmented by manually chosen thresholds for reconstructing blood vessel surfaces with the marching cubes algorithm.31 The center lines of segmented vessels and their diameters were delineated using vascular modeling toolkit.32 Due to limited image resolution, only the main cerebral arteries (above a diameter of d>1 mm) could be reliably reconstructed. Accordingly, the major blood vessels of the right hemisphere of patient-2 and patient-4 were reconstructed.
(iii) Hemodynamics and inversion algorithm: We carefully incorporated patient-specific data such as diameters and segment length of the main arteries around the Circle of Willis into the blood flow network model. Hemodynamic computations were based on simple network flow models described previously by other authors, ignoring the effects of oscillatory wave propagation and reflection.33,34 In brief, continuity was applied as shown in (2), where F is the blood flow. Pressure drop was approximated using Poiseuille’s law given in (3), where d, A and L are the diameter, cross sectional area and length of a vascular segment, ΔP is pressure drop, μ is the apparent blood viscosity. This simple hemodynamic network model composed of cylindrical segments was also used to predict convection of a non-dilutable contrast agent as given in (4). The dynamic concentration profiles for contrast injected into the patient cerebral arteries were computed by the species conservation balance, where V is the volume of a small vascular segment, and C is its contrast agent concentration. Inversion with hemodynamic principles as side conditions was performed to compute the specific blood flows and pressures that best aligned the measured concentration profiles with predicted profiles. The objective function was minimized by adjusting the pressure boundary conditions at the internal carotid artery and peripheral arterial terminal vessels of interest to achieve the best match between the contrast concentration profiles. Specifically, concentration profiles were extracted from the RICA, RMCA, RACA, and LACA for patient-2. In patient-4, RICA, RMCA, and RACA concentration profiles were used in the inversion.
RESULTS
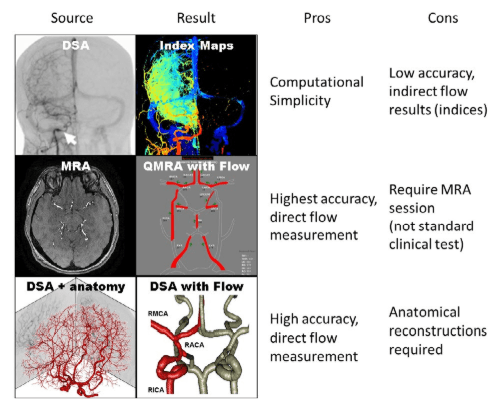
The results are presented according to the hierarchy displayed in Figure 1. We first present the intensity-based indices. These indices are compared with flow measurement from QMRA. Finally we show the results of the novel inversion technique to estimate absolute blood flow with conventional DSA.
Figure 1: Schematic of various modes of blood flow assessment using different imaging modalities. (Top) Simple flow indices can be derived by DSA images but only shows relative changes. (Middle) Absolute volumetric blood flow rates can be acquired by performing quantitative MRA, which is not available in the interventional setting. (Bottom) The novel inversion technique presented in this paper integrates DSA intensity profiles with anatomical information to predict measure volumetric blood flow rates with reasonable speed and accuracy. Red vessels indicate the major vessels observed from DSA reconstruction in the infused hemisphere, gray vessels indicate the unobservable vessel in the contra-lateral hemisphere.
DSA intensity-based flow indices
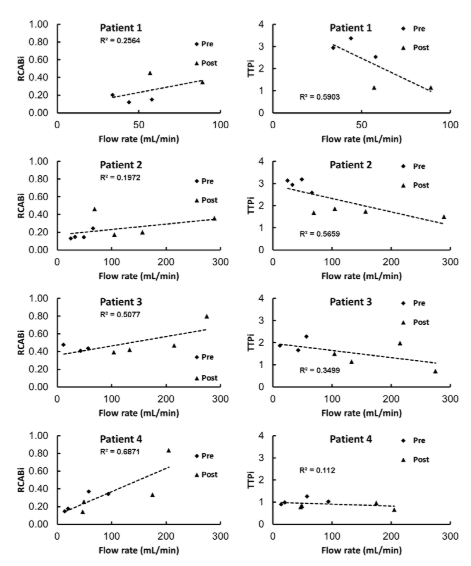
Patient-1 was treated initially for a giant right ophthalmic ICA segment aneurysm with ICA sacrifice and extracranial-intracranial venous graft bypass. The vein graft developed progressive stenosis, with compromise of left MCA flow. The arteries of interest were LMCA, LACA, and LACA2. All results are shown in Table 1. Before intervention, the time-to-peak indices were determined to be TTPi=2.94±0.61, 2.52±0.54, and 3.36±0.33, the relative cerebral blood flow indices were RCABi= 0.20±0.04, 0.15±0.04, and 0.12±0.03. Post angioplasty and stenting of the stenotic venous graft, the TTPi was determined to be 1.14±0.13, 1.15±0.14, and 1.50±0.01, the RCABi was 0.45±0.09, 0.35±0.04, and 0.32±0.06. Decrease in the TTPi and increase in the RCABi clearly indicate the improvement of blood flow. The relative change of TTPi in LMCA, LACA, and LACA2 were 61%, 55%, and 54%. The relative change of RCABi in LMCA, LACA, and LACA2 were 56%, 57%, and 63%. The absolute flow change in QMRA in LMCA and LACA were 40% and 35%. LACA2 measurement was not available in post-treatment QMRA. Table 1 summarized the intensity-based flow indices in various locations of interest for all four patients before and after intervention. In all four cases, the neurovascular intervention improved blood supply to the patients’ compromised cerebral hemispheres. We further computed the statistical agreement between blood flow and intensity-based indices as shown in Figure 2. For this purpose, we plotted on the x-axis the measured QMRA flow rate and on the y-axis the RCABi and the inverse of the TTPi at the same artery. Because flow measurements were available for four arteries, multiple data points were available for comparison. We also performed linear regression to correlate intensity-based indices against QMRA-based blood flow.
Figure 2. Scatter plot of inversion-based flow indices against QMRA flow measurement. Left: RCABi against flow shows overall increase of RCABi indicates faster flow rates. Right: TTPi against flow shows overall decrease of TTPi indicates faster flow rates. Multiple measurements for numerous blood vessels were available for each patient for better comparison.
Rcabi And Ttpi For Intervention Assessment
The scatter plots in Figure 2 show trends, which seem to support the notion that higher RCABi are associated with higher blood flow as expected. However, a closer look at Figure 3B demonstrates individual pixels that disagree with the flow improvements. When plotting the blood flow changes before and after intervention trends with QMRA and RCABi, it can be seen that an increase in blood flow detected by QMRA is not even qualitatively captured by the corresponding RCABi in the MCA. Accordingly, a local RCABi in the RACA erroneously suggests a blood flow decrease, when in fact it has increased. On the other hand, the trends of Figure 3B show no inconsistencies in the inferred blood flow changes with TTPi. The TTPi reflected correctly improved blood flow in all four cases. Flow indices shown in Figure 2 are in agreement with the general trend of flow improvement after surgical intervention. However, the lack of fit underscores the limitations of these simple indices as quantitative blood flow metrics. The low R2-value in the scatter plots (RCABi: R2=0.25, 0.19, 0.50, 0.68; TTPi: R2=0.55, 0.56, 0.34, 0.11) reflects only a weak correlation between indices and absolute volumetric flow rates.
Figure 3: Pre- and post- treatment intensity-based flow indices. (A) Two-dimensional flow maps showing an overall decrease in TTPi and increase in RCABi suggesting an improvement of blood flow after intervention. The success of the treatment effect
can be observed based on flow indices derived from the dynamic DSA intensity profiles. These indices can act as quantitative references to facilitate physicians’ optical observation. (B) Individual flow indices correctly reflect a general trend to flow increase post treatment. Unfortunately, several local pixels for patient-3 and patient-4 show the complete opposite trend (flow decrease) after intervention.
When assessing interventional outcomes based on simple flow indices caution is indicated, because inconsistencies cannot be avoided due to limitations in the data acquisition in conventional DSA.
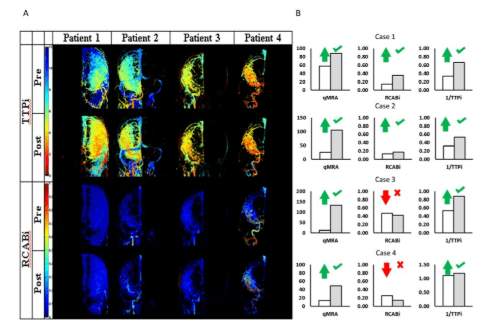
Two-dimensional TTPi and RCABi maps were also generated for coronal planes as shown in Figure 3A. Recently, similar maps are being offered as upgrades to existing angiography suite software. The two-dimensional plots show color patches reflecting the improved blood flow after interventions. In all patients, the intensity based maps properly indicate successful intervention. Overall, the RCABi map of patient-3 shows improved blood flow even though the RCABi values for several individual pixels contradict the trend. The two-dimensional RCABi and TTPi map appear to be more robust than single pixel indices, because the spatial normalization eliminates individual outliers leading to more robust “integral” snapshot of the blood flow pattern compared the “local” RCABi and TTPi.
Thus, intensity-based maps are better suited for the assessment of interventional outcomes. Yet, even the maps cannot render absolute blood flow rates in individual vessels.
Flow Inversion from Reconstructed DSA
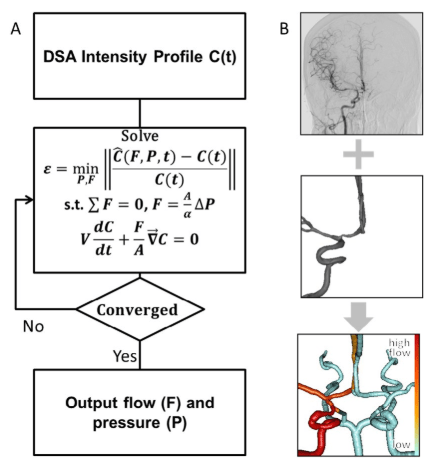
We also estimated blood flow rates in patient-2 and patient-4 using a novel inversion technique for DSA images. Measured contrast concentration profiles were compared to the simulated trajectories to obtain blood pressure and volumetric flow rates. During an iterative procedure, the inversion model chooses suitable inlet pressures, which in turn affects the flow rates, as well as the dynamically simulated contrast agent intensity profiles throughout the network. The boundary pressures and indirectly the flow rates that lead to the best alignment between the simulated contrast agent concentration profiles with the measured intensity profiles from DSA are deemed the optimal solution. The optimal solution minimizes the objective function in (1) which is the difference between measured and simulated contrast agent profiles. We assumed a linear relationship between intensity and contrast agent concentrations. The side conditions include the continuity in (2), pressure drop according to Hagen Poiseuille law in (3) and the dynamics of contrast agent distribution by blood advection in (4). The information flow of the inversion model is shown in Figure 4. The problem of minimizing (1) subject to (2-4) is a non-linear mathematical program (NLP) with partial differential constraints. We solved the NLP after time discretization with a one-step implicit Euler method with step size t=100 ms with genetic algorithm (GA) optimizer in MATLAB, details on GA optimizer can be found elsewhere.35 Optimization parameters were set to population size=1000, number of iterations=500. Typical computation time for the inversion model did not exceed 20 CPU seconds on an Intel Core2Duo E8400. The intensities for the optimization were taken from the arterial phase only, background noise was filtered by subtracting the intensity of a contra-lateral hemisphere, and the area under the curve of the intensity was normalized to a unity. The final solution with the best match between the concentration profiles yields the desired volumetric flow rates. The pressure drops and the simulated concentrations profiles are simultaneous outcomes of the inversion procedure.
Figure 4. Information flow for novel inversion technique for estimating cerebral blood flow in large arteries with fractional DSA. The inversion consists in solving a non-linear optimization problem which minimizes the difference between measured and simulated intensity profiles. The optimal solution determines the flow rates and pressures that give the best alignment between measurements and model B. Intensity profiles are extracted from DSA images (top). Anatomical information about the patient-specific network of main cerebral arteries is derived from medical images (middle). Flow results from inversion of the DSA images. The red gradient color bar indicates the volumetric flow rates; vessels in white are unavailable from DSA reconstruction (bottom).
Optimal Flow From Inversion Of The Intensity Profiles
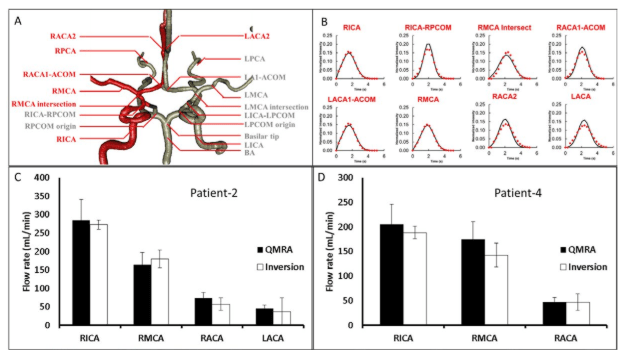
For the inversion of the contrast agent profiles, the inlet contrast concentration was set equal to the actual contrast infusion profile acquired at the first segment of the ICA. The optimal solution of flow rates from inversion are shown in Figure 5C, 5D and compared well with the QMRA measurements. The optimal flow rates were independent of the initial guesses for the unknown pressures and flows during the inversion. Figure 5B also shows the intensity profiles in simulation and actual DSA data sets in good qualitative and quantitative agreement. The absolute volumetric flow rates were computed by inversion as 263.6 mL/min in the RICA, 168.5 in the RMCA, 56.5 in the RACA, and 38.5 in the LACA. Compared to NOVA, there are only small differences: 2.7% in the RICA, 8.9% in the RMCA, 23.2% in the RACA, and 9.5% in the LACA. The inversion model renders the desired flow rate estimates. It implicitly performs smoothing of the noisy contrast agent intensity data based on fluid dynamic principles. Incorporation of flow physical principles into the noise reduction seems advantageous when compared to uninformed data fitting used in conventional deconvolution.
Figure 5. Flow estimation from inversion-based model. A. An anatomical network model of the main blood arteries in the right hemisphere was reconstructed from constant infusion DSA and used for the hemodynamic computations into contrast advection during the inversion procedure. Red labels and vessels indicate positions examined in patient-4, grey labels and vessels mark other anatomical areas. B. Intensity profiles extracted from DSA at the RICA, RMCA, RACA, and LACA (dots) used in the inversion-base flow rate assessment. Crude
intensity data were considered during the arterial phase, background was subtracted and the area under the curve for each intensity plot was normalized to unity. Solid lines show the simulated intensity profiles of the optimal solution. The good alignment between the two curves supports the validity of the flow estimation. C. The flow estimation with the novel inversion technique compared to the golden standard of QMRA for patient-2. Flow estimation from inversion-based model in vessels of interest is within 25% difference of QMRA. D. The flow estimation with the novel inversion technique compared to the golden standard of QMRA for patient-4. Flow estimation from inversion-based model in vessels of interest lies within 25% of the QMRA value.
Confidence Regions of Flow Estimation
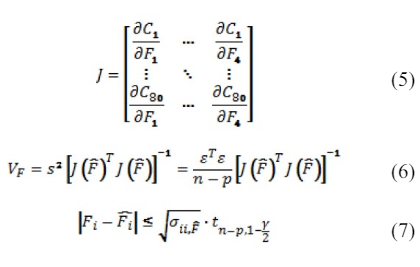
We also computed the individual confidence intervals to assess the reliability of the flow estimation. Independent confidence intervals for confidence level of 99% were calculated based on the covariance method described in.36 The covariance method requires the sensitivity information; the elements of the Jacobian matrix were computed numerically by repeated simulations with small changes to the flow rates in (5-7) with n is the number of observations, p is the number of parameters, V the covariance matrix, σ the individual variances, ε is the vector of concentration differences between the measurement and the model prediction with t as the student t-value. We computed for four different flow rates with eighty observations, and using 2.63 as t-value with 99% confidence. The final estimate for the blood flow in the RICA was 263.6±2.6 ml/min, 168.5±4.0 in the RMCA, 56.5±2.5 in the RACA, and 38.5±4.8 in the LACA, indicated as error bars in Figure 5C. We also reconstructed an anatomical network for the main arteries connected to the right hemisphere of the Circle of Willis for patient-4 and conducted flow measurements with the inversion technique described above. The flow estimation for patient-4 gave absolute volumetric flow rates of 182.9±6.1 mL/min in the RICA, 136.6±6.0 in the RMCA and 50.1±6.2 in the RACA as shown in Figure 5D. In comparison to the QMRA measurement were 205 mL/min, 175, and 49, respectively. The differences between flow rates acquired with inversion of traditional DSA and QMRA were smaller than 25%.
DISCUSSION
Intensity-based indices are appealing for the clinical practice especially during the interventional setting due to their ease of use. In this paper, two intensity-based angiographic indices, time-to-peak (TTPi) and relative cerebral angiographic blood flow index (RCABi) were investigated in four patients requiring neurovascular interventions. In all cases, improvements after neurovascular intervention were correctly detected by the TTPi. The RCABi analysis of two patients failed to reflect the correct trend. Such mismatches would not be acceptable for clinical outcome evaluations. We conclude that caution must be exercised when using angiographic intensity-based indices even for qualitative outcome assessment of neurosurgical interventions.
In addition, the quantitative correlation between intensity-based indices and absolute blood through individual arteries was found to be weak (R2<0.7). The imprecision is due to the low acquisition rate of DSA, the overlap of intensity in the angiographic projection planes, secondary injection of contrast agent, and attenuation of intensity through bony structures. The degree of variability and uncertainty is also a function of the patient-specific flow patterns. The use of these indices is reasonable as indirect assessment of relative change in blood flow post intervention (angioplasty, stenting, infusion of vasodilators, dural fistula or arteriovenous embolization), while the patient is still in the angiography suite. Especially the blood flow assessment for patients with flow reversal may be susceptible to incorrect trends as was the case in patient-3.
Two-dimensional TTPi and RCABi maps were found to be more robust than point measurements. The comparison of maps pre- and post- intervention reflected correctly the qualitative improvement in all four cases. The apparent improved reliability of two-dimensional index maps over the local indices can be attributed to the spatially integral character of the map. The spatially distributed RCABi or TTPi fields better reflects the global flow pattern, and appears less sensitive to errors than local indices evaluated for individual pixels. However, even flow index maps also do not render absolute volumetric flow rates.
To overcome the limitation of quantifying blood flow in conventional DSA, we presented a novel inversion technique that incorporates patient-specific anatomy in the image analysis. In two patients, DSA based blood flow measurement were demonstrated using an anatomically consistent hemodynamic model around the main arteries in the injected hemisphere. Using this patient-specific blood flow network and measured intensity plots from DSA as input, the inversion technique yielded absolute blood flow estimates within 25% of the QMRA NOVA measurements. Computation time needed for inverting the concentration profile were less than 20 seconds which shows that the inversion-based absolute flow estimation can be solved in real-time.
Unavoidable measurement error is attributable to the intensity overlap in the DSA projections, and noise during image acquisition. There is also mismatch between actual injection dynamics causing complex mixing patterns and the simplified flow assumptions used for the inversion. Fast contrast infusion creates a jet which carries the contrast agent initially much faster than shortly afterwards when the blood flow returns to normal. In DSA with limited frame acquisition rate, the rapid initial contrast agent ejection is an unavoidable source of error especially close to the injection site.
For building the hemodynamic model, patient-specific DSA images after constant infusion into one hemisphere were available in this study. The lack of observations for the contra-lateral side is expected to affect the estimation error. To quantify the effect of this error, we also built a complete intracranial vasculature model from patient-specific MRA images to perform the same flow estimation by inversion of a complete Circle of Willis and bilateral main cerebral arteries. The inversion result was within 20% of the QMRA results. The results from complete network inversion differed by only 5% from the hemispherical predictions. This preliminary study demonstrates the feasibility of acquiring absolute blood flow rates in large arteries with conventional DSA with an inversion technique that incorporates anatomical details in the image analysis of dynamic contrast profiles.
CONCLUSIONS
DSA is an established technique for hemodynamic assessment in an emergency clinical setting, which currently lacks volumetric blood flow rate estimation to ascertain the effectiveness of the neurovascular intervention. The limitations of two intensity-based flow indices for neurovascular intervention assessment were highlighted. Two-dimensional maps based on intensity-based indices were found more robust against misinterpretation.
A novel inversion technique to measure absolute flow in major arteries accounting for patient-specific anatomy in addition to DSA contrast agent profiles was introduced. The novel methods incorporated fluid mechanical and transport physics into the medical image analysis of DSA dynamic contrast data. The proposed inversion technique seems to give good flow estimates by smoothing the noisy image data according to hemodynamic principles. The combination of intensity profiles and patient-specific flow network is a promising approach to render absolute blood flow measurements with traditional DSA.
ACKNOWLEDGMENTS
The authors would like to gratefully acknowledge NIH for their financial support of this project, NIH-5R21EB004956. No conflicts of interest were posed in the conduct of this research.
CONFLICT OF INTEREST: None.


