BACKGROUND
Neural Tube Defects (NTDs) are serious birth defects that involve incomplete development of the neural tube, which is the structure that becomes the spinal cord and the brain. There are several types of NTDs, all of which occur during early pregnancy, largely attributable to low levels of folate in women while conceiving.1 Spina Bifida (SB) is used synonymously with NTDs. It actually falls within the spectrum of NTDs and this spectrum can range from mild with almost no problems to serious involving loss of bowel and bladder control, muscle paralysis, and loss of ability to sense urinary tract infection. NTDs can be further divided into three categories, ranging from mild to severe as listed: SB occulta; occult spinal dysraphism (lipomyelomeningocele); and SB cystica/aperta (myelomeningocele and meningocele).
Inconsistent coding of NTDs adds to the challenge of tracking the incidence. One recent analysis of the United States (US) NTD incidence rate (1991 to 2005) reported 17.96 cases of SB per 100,000 live births, whilst the anencephaly rate was recorded at 11.11 per 100,000 live births.2 US incidence rates for SB range from 3 to 6 cases per 10,000 live births.3,4 Infants with a NTD tend to have severe and life-long disabilities, and face the risk of psychosocial maladjustment.5 Most are unable to function independently as adults, with common disabilities and medical problems including sight problems, dysfunction in the arms, epilepsy, bowel and bladder dysfunction. In addition to physical handicaps, SB causes significant neurocognitive and psychological morbidity in affected children as well as mental health burdens for their caregivers.5,6,7
Although most folate-dependent NTDs can be prevented by elevating folate levels in women wanting to become pregnant, most public health campaigns to date have been only partially successful in reducing the incidence.5 A literature review of the economic burden of NTDs and prevention with folic acid showed that fortification of food with folic acid is a cost-effective method of reducing the burden of NTDs and therefore, their associated economic burden.8
However, the economic burden of SB remains significant. Total lifetime cost of a person with SB was estimated at $635,763 (in 2001-2003 $), with total direct costs of $279,210, and indirect costs of $356,553 (work productivity loss due to heightened morbidity and premature mortality).4 Caregivers of children with SB worked an annual average of 7.5 to 11.3 hours less per week depending on the disability severity, which translated to lifetime costs of $133,755 in 2002 $.7 Other studies have reported costs of US$294,000 per infant.1 In their working paper, Waitzman et al.9 estimated the total lifetime cost of a SB patient to be US$635,763, with total direct costs of US$279,210, and indirect costs of US$356,553 (work productivity loss due to heightened morbidity and premature mortality). A recent review of the social, psychological, and economic burdens experienced by people with SB and their caregivers showed that the average lifetime direct medical cost per person with SB ranges from US$285,959 to US$378,000 (in 2010 $). This does not include lifetime direct non-medical costs (such as special education and development services) of US$52,570 per person.5
Although data on the cost of SB to health care payers are available, it is mainly limited to information from the US and there are no data available at present relating to the costs of SB in Canada. Data on the mental consequences of the disease are particularly scarce so quantifying the total burden remains a challenge. The main objective of this paper is to provide an estimate of the burden of illness for patients with SB and their caregivers in Canada.
METHODS
Participant Recruitment and Survey Procedures
The study was approved by the Holland Bloorview Kids Rehabilitation (HBKR) hospital research ethics board, and signed consent was obtained from all participants. Individuals with NTDs were recruited through the HBKR in Toronto and were eligible to participate if they met all the following criteria.
1) As judged by the investigator, have the cognitive ability to participate in the study or a patient representative who spends a minimum of two hours interacting with the patient in-person daily and is willing to participate as a proxy for the patient; and
2) Clinical diagnosis of SB (SB occulta or SB cystica/aperta) at any point during lifetime; and
3) Able to read and speak English or have a patient representative who is willing to assist the patient with completion of the survey forms; and
4) Willing and able to provide written informed consent prior to study entry or have a legal guardian who is able to provide consent on the patient’s behalf prior to study entry.
For caregivers of individuals with SB, the participants had to meet all of the following criteria to be eligible.
1) At least 18 years of age; and
2) Able to read and speak English; and
3) Willing and able to provide written informed consent; and
4) Be an unpaid caregiver of a patient with SB who is also participating in the study (Note: caregiver must spend a minimum of two hours interacting with the patient in-person daily).
For caregivers, participants were excluded if they had a cognitive or other impairment (e.g., visual) that would interfere with them completing the study (assessed by the investigator).
If the patient had a cognitive or other impairment that would interfere with them completing the study, a patient representative could complete the measures for him or her. It was preferable that the patient representative was not also participating in the study as a caregiver.
Database set-up
A database of all patients was created using the clinic’s database and any new individual presenting with a diagnosis at the clinic during the study. All potentially eligible individuals with SB and caregivers were sent a letter to inform them of the study and either telephoned or approached during a clinic visit to screen for interest and confirm eligibility.
Those who were part of the final study cohort were given all forms and surveys at the clinic visit to take home and complete or, where phone-screened, were sent a packet containing copies in the mail.
Parents/legal guardians of patients under the age of 18, or who did not seem cognitively able to complete the informed consent process, signed an informed consent form on the patient’s behalf. For all child patients with SB under the age of 16, a patient representative completed the resource use questionnaire on the patient’s behalf; however, the child could complete the appropriate Quality of Life (QoL) questionnaire(s) if the investigator and patient representative believed he or she was mentally capable.
Questionnaires
Data were collected from patients and their caregivers using three types of questionnaires: self-developed sociodemographic questionnaire and resource use questionnaire; and three validated QoL questionnaires–EuroQol-5 dimensions (EQ-5D)/EQ-5D Youth (EQ-5DY),10,11 KIDSCREEN-10 (Child and Parent version for children), 36-Item Short Form (SF-36).12,13
Those with a diagnosis of SB responded to the first two questionnaires and the respective QoL questionnaire depending on their age (up to 12 years–EQ-5DY and KIDSCREEN-10; between 12 and 15 years–EQ-5D and KIDSCREEN-10; aged 16 and above–EQ-5D and SF-36).
Caregivers were asked to complete the first two questionnaires as well as the SF-36 and EQ-5D questionnaires to capture QoL. Participants could use their personal medical charts or personal diaries to assist with completion of the resource use and sociodemographic questionnaires. See Text Box 1 for more details on QoL questionnaires.
| Text Box 1
Three different validated instruments were used to assess Health-related Quality of Life (HRQoL) of patients with SB, including the version for children given the age range of these patients.
EQ-5D and EQ-5Dy
The EQ-5D questionnaire is a generic, utility-based QoL instrument used for clinical and economic appraisal. The EQ-5D questionnaire has five dimensions including mobility, self-care, usual activities, pain/discomfort and anxiety/depression. Each dimension has three levels: no problem, some problem, and severe problem. As no algorithm exists for the EQ-5D for Canada, the US algorithm was used. For the EQ-5DY no overall score can be calculated as no algorithm is yet available.
SF-36
The Medical Outcomes Study (MOS) SF-36 is a QoL instrument designed to assess generic health concepts relevant across age, disease, and treatment groups. It is aimed at both adults and adolescents aged 18 years and older. Nine different dimensions make up the SF-36: physical functioning (10 items); role-physical (4 items); bodily pain (2 items); general health (5 items); vitality (4 items); social functioning (2 items); role-emotional (3 items); mental health (5 items); and reported health transition (1 item).
KIDSCREEN-10
The KIDSCREEN-10 instruments assess children’s and adolescents’ subjective health and well-being. They were developed as self-report measures applicable for healthy and chronically ill children and adolescents aged from 8 to 18 years. They are available in child and adolescent as well as parent/proxy versions and have been translated and adapted for use in several languages. The KIDSCREEN-10 items use 5-point, Likert-type scales to assess either frequency (never-seldom-sometimes-often-always) or intensity (not at all-slightly-moderately-very-extremely). Rasch scores are computed for each dimension and for the overall score and are transformed into T-values with a mean of 50 and Standard Deviation (SD) of 10. The T scores refer to the mean values and SD from a representative sample of the European general population so that scores over (or under) 50 indicate better (or worse) HRQoL than the general population. As there is no general Canadian population data available, the European general population was used. |
Within the sociodemographic questionnaire data were collected on: age; gender; race; education level; employment status; and living situation. In addition, data were collected on: body mass index (BMI; weight, height); type of lesion/severity of SB (occulta-hidden form, occult spinal dysraphism-lipomyelomeningocele, cystic myelomeningocele/meningomyelocele, meningocele); location of the lesion (cervical, thoracic, lumbar, sacrum, other); presence of hydrocephalus; type of treatment of hydrocephalus; level of mobility; and wheelchair use. Data on caregivers included information on the relationship with the patient.
The resource use questionnaire for individuals with SB covered two periods: resource use in the last year and resource use in the last ten years. For caregivers, information on resource use only in the last year was collected. Caregivers were specifically asked to provide information on resource use that comes as a direct result of having to care for a person with SB. The following categories of data were included: health conditions; medical resource, such as hospital visits–out-patient, day-patient, in-patient/overnight stays, emergency room visits; visits to health care professionals; and medicines. In addition, patients’ data included incontinence management; medical care and aid (new shunts, wheelchair, glasses, walkers, etc.); and changes to house/apartment due to SB (e.g., build wheelchair ramp). Other data included: productivity/work loss or sick leave from school; transportation to hospital and health care professionals; living arrangements; and special education received.
Analysis
Baseline characteristics, QoL outcomes variables, variables on medical resource use and lost productivity were described for the entire study population and relevant subgroups of interest. For categorical variables, their distributions were described in terms of the number and proportion at each level of the variable; 95% Confidence Intervals (CIs) around these proportions were reported. Continuous variables were summarised in terms of the mean, Standard Deviation (SD), median, and range of values (minimum, maximum), with 95% CIs around the means being reported. For missing values, the number and percentage of missingness were reported for each variable.
The approach used to assess the association between patient groups and outcome variables depended on whether the latter was categorical (e.g., at least one overnight hospitalisation during the study period), or continuous (e.g., number of hospitalisations during the study period) variable. For categorical variables, the outcome was cross-tabulated by sub-groups of interest, to describe the proportion in each level having the outcome. For continuous variables, the distribution of the values of the outcome was described for sub-groups of interest.
RESULTS
Of the 310 individuals with SB and their caregivers who were invited to participate in the study, 132 returned the questionnaires, including 66 individuals with SB and 66 caregivers.
Participant Characteristics
The majority of individuals with SB participating in the survey were of white/Caucasian ethnicity (77%, n=51), were under 20 years old (98%, n=65) and over half were female (62%, n=41). Almost half were full-time students (n=30) and about 10% were in either full- or part-time employment or voluntary work.
Individuals with SB were classified by disease with most having lesion in the lumbar area (n=30), followed by other area (n=17), occulta/sacrum (n=14), thoracic (n=4), and cervical (n=1). They were also classified by disease severity, with those in the cervical or thoracic group classed as more severe and those in the occulta/sacrum group as less severe. The mean age for this group was 13 years old with patients in the thoracic and cervical group being 11.63 years and the lumbar group having the lowest average age of 9.48 years. More than half of the patients with SB had presence of hydrocephalus (53.03%). The mean age of patients with hydrocephalus was 10.31 years.
Co-morbidities included abnormal bladder function and incontinence for over 65% of patients; more than 50% reported urological abnormalities; almost half of patients had orthopaedic problems and latex allergy reaction; and around 20% had Chiari malformation, eye problems, paralysis or were wheelchair-bound. Those in the more severe, cervical/thoracic group had a trend toward higher number of urological complications with 80% (n=4) reporting abnormal bladder function and incontinence and 60% (n=3) reporting urological abnormalities.
Overall, abnormal bladder function was more common in younger patients (n=33, patients younger than 15 years of age), and particularly high in the ‘11 to 15 years’ group (n=13). Urological abnormalities were also more prevalent in young and young adult patients (n=33, patients younger than 20 years of age) and was relatively higher in the ‘11 to 15 years’ and the ‘15 to 20 years’ groups (n=8).
Level of mobility for patients was limited with about a third of all patients reporting use of a wheelchair (n=19) or wearing braces on their feet or legs (n=18). Less than half (n=24) of patients could walk without assistance and three patients used a cane or other walking aid. Patients with hydrocephalus (53%, n=35) reported a higher rate of wheelchair use (46%, n=16) compared to those without and use of feet/leg braces was almost equal in patients with (26%, n=9) and without hydrocephalus (29%, n=10). Those without hydrocephalus were more likely to walk without assistance (55%) compared to patients with this condition (20%).
The majority of caregivers were female (n=64), most were the mother of a person with SB (n=62) and most lived with the person with SB (n=59) and a partner/spouse (n=38) or other member of the family who was not the patient (n=32).Over half (n=34) had a college degree and nearly a quarter (n=15) had studied at postgraduate level, but only 42% (n=28) were in full-time employment and those working part time (n=17) worked a mean of 23 hours per week and reported their role as care provider as the reason. Caregivers reported a variety of health conditions including lower back pain, joint problems, anxiety, high blood pressure and depression. In all, 76% (n=50) of caregivers reported that their health problems were the result of their role as carer for patients with SB.
Resource Use
Caregivers
Data on resource use were reported both for the period of the last year (all) and the most recent 10 years (individuals with SB only). Of the 66 caregivers in the study, during the past year 16 had visited a General Practitioner (GP) in office as a result of their care for the person with SB, six had visited another hospital specialist, five had visited a community physiotherapist or occupational therapists and four the orthopaedist. Among caregivers with at least one use of health care resources, there were six visits to outpatient services (hospital appointments), two day-patient visits and two emergency room visits.
Individuals with SB: previous year
During the year prior to survey administration, the majority of individuals with SB visited an urologist (71%, n=47), GP (66%, n=44) and an orthopaedist (64%, n=42). Among individuals with at least one visit, the most frequent were the outpatient appointments (64%, n=42), in-patient stay (30%, n=20), day-patient visit (29%, n=19), in-patient surgery (27%, n=18) and emergency room visit (26%, n=17). The mean length of in-patient stay per person with at least one visit was 7.15 days in a normal ward, and six days in the Intensive Care Unit (ICU).The most used items by individuals with SB during the last year were incontinence pads and urinary catheters (68%, n=45) or bowel incontinence products (45%, n=30).
On average, individuals with SB were driven around 52 times by a caregiver or other person, who was not paid for the service, to health care services. They used transport services to go to the hospital, doctor, specialist or rehabilitation visit around nine times a year and only once drove themselves to health care services. Some (12%, n=8) had to make changes to their house/apartment because of their condition, including bathroom renovations, installing ramp and railing, wheel in shower, grab bar in shower and new bed to improve function.
Individuals with SB: previous 10 years
In the past 10 years, hospitalisation was the most used health care resource (77%, n=51), with the overall mean length of rehabilitation stay being 135.50 days, and the mean length of stay per person being 32.79 days. Most individuals with SB resided full time in a private home, either with parents or a partner in the previous 10 years. Other resource use included 31 individuals with SB who used physical therapy services, 26 used orthopaedic shoes and 25 reported using a wheelchair. Among those with at least one health care resource use, there were 20.25 additional procedures, events or physician visits in the past 10 years.
In terms of productivity lost, in the past year, individuals with SB who attended a school had a mean of 15.17 sick days because of their condition, whereas those working full time only had a mean of two sick days.
Adult QoL Questionnaires for Individuals with SB
The results from the SF-36 questionnaire are presented in Figure 1. The lowest scores within the physical and mental components were physical function (35.84) and social function (46.33). Overall, the mean physical scales/component scores indicated worse than the US population but the mean mental scales/component scores indicated better than the US population. The pair-wise correlation analysis showed that there is an inverse correlation between all SF-36 subscales and the age; however, correlation coefficient was not statistically significant (see Table 1).
| Table 1: Pair-wise Correlation of Patient’s SF-36 Subscale and Component Score and Patient’s Age |
|
N |
Patient’s Age r |
p |
| Physical functioning |
14 |
-0.33620 |
0.2399 |
| Role-physical |
14 |
-0.09106 |
0.7569 |
| Bodily pain |
14 |
-0.31146 |
0.2784 |
| General health |
14 |
0.02322 |
0.9372 |
| Vitality |
14 |
-0.48156 |
0.0812 |
| Social functioning |
14 |
-0.19705 |
0.4995 |
| Role-emotional |
14 |
-0.15745 |
0.5909 |
| Mental health |
14 |
-0.12430 |
0.6720 |
| Physical health component score |
14 |
-0.26119 |
0.3671 |
| Mental health component score |
14 |
-0.08917 |
0.7618 |
| Correlation coefficients (r) represent the linear relationship between two variables and can range from -1.00 to +1.00. The value of -1.00 represents a perfect negative correlation while a value of +1.00 represents a perfect positive correlation. A value of 0.00 represents a lack of correlation.*If each p-value is lower than 0.05, then the correlation coefficient is statistically significant. |
Figure 1: Patients: SF-36 Subscale and Component Scores
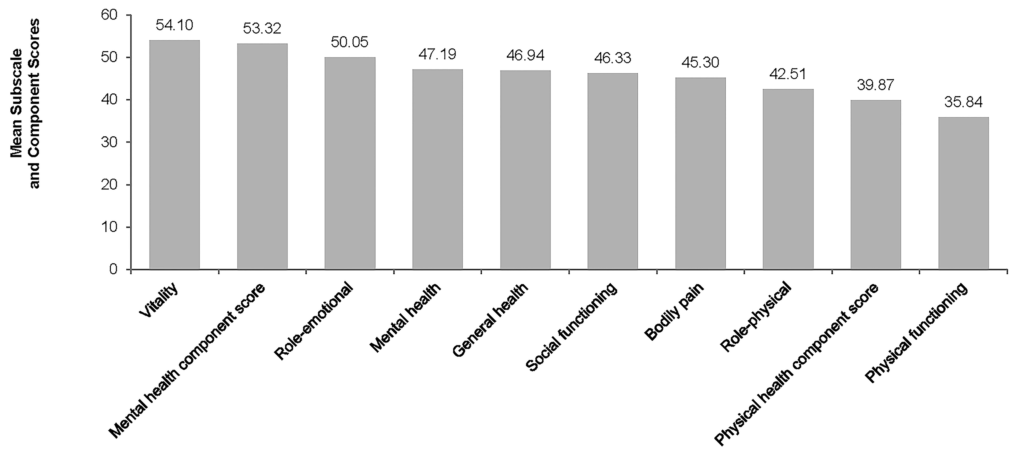
Norm-based scoring has been applied here as general population norms provide a much better basis for comparisons across scales. In norm-based scoring, each scale was scored to have same average (50) and the same standard deviation (10 points) and differences in scale scores much more clearly reflect the impact of the disease, in this study the impact of neural tube defects.
EQ-5D were reported by 93% (n=31) of responders (see Table 2). The mean EQ-5D utility score was 0.64 and mean EQ-5D Visual Analogue Scale (VAS) was 78.93. There were 3% and 7% of patients who reached the ceiling of utility and VAS scores, respectively. The majority of patients reported having ‘some’ (n=13) or ‘lots of’ (n=7) problems with mobility. There was no significant correlation between the EQ-5D scores and utilities and the patients’ age (see Table 3). Pain and discomfort subscales had a statistically significant and positive correlation with patients’ age (p=0.02, correlation co-efficient r=0.435).
| Table 2: EQ-5D Scores and Utilities of Patients |
| (N=29) |
N |
Mean |
SD |
Median |
Min |
Max |
% Ceiling |
% Floor |
N (%) Missing |
|
27 |
|
|
|
|
|
– |
– |
2 (6.90) |
| Mobility |
|
2.00 |
0.73 |
2.00 |
1.00 |
3.00 |
– |
– |
|
| Self care |
|
1.44 |
0.58 |
1.00 |
1.00 |
3.00 |
– |
– |
|
| Usual activities |
|
1.59 |
0.50 |
2.00 |
1.00 |
2.00 |
– |
– |
|
| Pain/discomfort |
|
1.67 |
0.62 |
2.00 |
1.00 |
3.00 |
– |
– |
|
| Anxiety/discomfort |
|
1.30 |
0.47 |
1.00 |
1.00 |
2.00 |
– |
– |
|
| EQ-5D utility |
|
0.64 |
0.31 |
0.79 |
0.15 |
1.00 |
3.45 |
0.00 |
|
| EQ-5D VAS |
|
78.93 |
16.20 |
85.00 |
30.00 |
100.00 |
6.90 |
0.00 |
|
| Average EQ-5D utility in general population is 87.3. Average EQ-5D VAS score in general population is 80.9. (16) |
| Table 3: Pair-wise Correlation of Patients’ EQ-5D and Patients’ Age |
|
N |
Patients’ Age R |
p |
| Mobility |
27 |
0.00000 |
1.0000 |
| Self care |
27 |
-0.26595 |
0.1800 |
| Usual activities |
27 |
0.05600 |
0.7814 |
| Pain/discomfort |
27 |
0.43459 |
0.0235* |
| Anxiety/discomfort |
27 |
0.25918 |
0.1917 |
| EQ-5D utility |
27 |
-0.18633 |
0.3521 |
| EQ-5D VAS |
27 |
-0.10612 |
0.5983 |
| Correlation coefficients (r) represent the linear relationship between two variables and can range from -1.00 to +1.00. The value of -1.00 represents a perfect negative correlation while a value of +1.00 represents a perfect positive correlation. A value of 0.00 represents a lack of correlation. *If each p-value is lower than 0.05, then the correlation coefficient is statistically significant. |
Child QoL Questionnaires for Individuals with SB
EQ-5DY and KIDSCREEN-10 reported by over 90% of responders (see Table 4). The mean EQ-5DY utility score was 0.50 and mean EQ-5DY VAS was 74.21. There were 14% and 5% of patients who reached the ceiling of utility and VAS scores, respectively and 10% of patients reached the flooring of utility score. Some patients reported having lots of problems with mobility (n=7) and some problems with usual activities (n=10).
| Table 4: EQ-5DY Scores and Utilities of Patients |
| (N=21) |
N |
Mean |
SD |
Median |
Min |
Max |
% Ceiling |
% Floor |
N (%) Missing |
|
19 |
|
|
|
|
|
|
|
2(9.52) |
| Mobility |
|
2.05 |
0.85 |
2.00 |
1.00 |
3.00 |
– |
– |
|
| Self care |
|
1.95 |
0.78 |
2.00 |
1.00 |
3.00 |
– |
– |
|
| Usual activities |
|
1.95 |
0.71 |
2.00 |
1.00 |
3.00 |
– |
– |
|
Pain/
discomfort |
|
1.74 |
0.73 |
2.00 |
1.00 |
3.00 |
– |
– |
|
Anxiety/
discomfort |
|
1.68 |
0.75 |
2.00 |
1.00 |
3.00 |
– |
– |
|
| EQ-5DY utility* |
|
0.50 |
0.42 |
0.70 |
-0.21 |
1.00 |
14.29 |
9.52 |
|
| EQ-5DY VAS |
|
74.21 |
20.02 |
80.00 |
25.00 |
100.00 |
4.76 |
0.00 |
|
| * No algorithm for the EQ-5DY exists; the EQ-5D algorithm for adults was used instead. |
The pair-wise correlation analysis showed that there is inverse correlation between self-care, anxiety/discomfort subscales of EQ-5DY, as well as EQ-5DY utility scope and VAS, and patients’ age; however, correlation coefficient was not statistically significant (see Table 5).
| Table 5: Pair-wise Correlation of Patients’ EQ-5DY and Patients’ Age |
|
N |
Patients’ Age r |
p |
| Mobility |
19 |
0.03983 |
0.8714 |
| Self care |
19 |
-0.00902 |
0.9708 |
| Usual activities |
19 |
0.06588 |
0.7887 |
| Pain/discomfort |
19 |
0.20724 |
0.3946 |
| Anxiety/discomfort |
19 |
-0.19912 |
0.4138 |
| EQ-5D utility |
19 |
-0.12258 |
0.6171 |
| EQ-5D VAS |
19 |
-0.37932 |
0.1092 |
| Correlation coefficients (r) represent the linear relationship between two variables and can range from -1.00 to +1.00. The value of -1.00 represents a perfect negative correlation while a value of +1.00 represents a perfect positive correlation. A value of 0.00 represents a lack of correlation. *If each p-value is lower than 0.05, then the correlation coefficient is statistically significant. |
For KIDSCREEN-10, 30 children and adolescents, and 29 parents completed the KIDSCREEN10 Health-related Quality of Life (HRQoL) questionnaire and had a mean score of 47.10 and 43.94 respectively.
Caregiver QoL Questionnaires
Overall, the mean physical scales/component scores indicated worse than the US population, and the mean mental scales/component scores indicated better than the US population (see Figure 2). Physical health component scores exhibited a trend towards higher values in caregivers of individuals with presence of hydrocephalus (50.36) compared to those without (49.25) as were the mental health component scores, 46.56 and 43.81 respectively.
Figure 2: SF-36 Subscale and Component Score of Caregivers
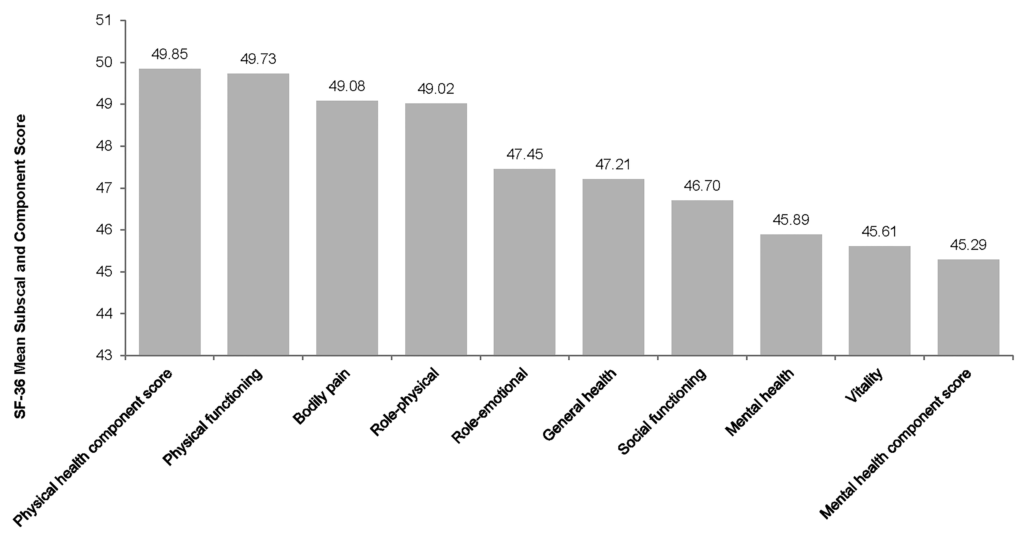
Note: Each scale was scored to have the same average (50) and the same standard deviation (10 points). With norm-based scoring, differences in scale scores more clearly reflect the impact of the disease
As shown in Figure 3, physical health component scores were lowest in caregivers of patients with cervical or thoracic disease severity (44.27) compared to occulta/sacrum (49.00) and lumbar (50.70). Caregivers of patients with occulta/sacrum disease severity had the lowest mental health component score (40.54), compared to patients with cervical or thoracic (44.18) and lumbar disease severity (47.46). The pair-wise correlation analysis reported in Table 6 showed statistically significant inverse correlation between bodily pain and physical health component scores of caregiver SF-36 subscales and patients’ age (p=0.03, correlation coefficient r=-0.43 and p=0.04 correlation co-efficient r=-0.032 respectively).
Figure 3: SF-36 Physical Subscale and Component Score of Caregivers-By Disease Severity
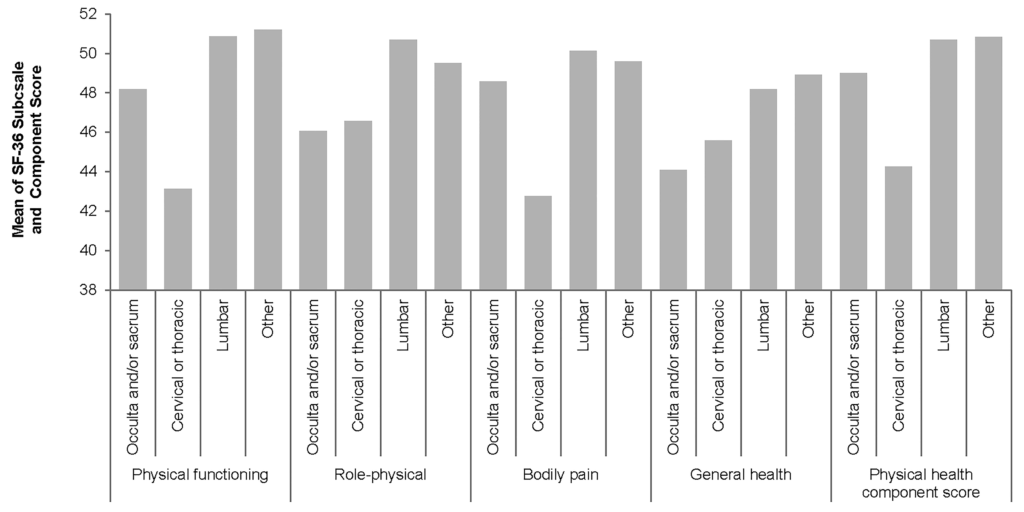
Note: Each scale was scored to have the same average (50) and the same standard deviation (100 points). With norm-based scoring, differences in scale scores more clearly reflect the impact of the disease
| Table 6: Pair-wise Correlation of Caregivers’ SF-36 Subscale and Component Score and Patients’ Age |
|
N |
Patients’ Age r |
p |
| Physical functioning |
65 |
-0.20985 |
0.0934 |
| Role-physical |
65 |
-0.10789 |
0.3923 |
| Bodily pain |
65 |
-0.26498 |
0.0329* |
| General health |
65 |
-0.19807 |
0.1137 |
| Vitality |
65 |
0.09457 |
0.4536 |
| Social functioning |
65 |
0.04127 |
0.7441 |
| Role-emotional |
65 |
-0.00570 |
0.9640 |
| Mental health |
65 |
-0.03266 |
0.7962 |
| Physical health component score |
65 |
-0.25348 |
0.0416* |
| Mental health component score |
65 |
0.07506 |
0.5523 |
| Correlation coefficients (r) represent the linear relationship between two variables and can range from -1.00 to +1.00. The value of -1.00 represents a perfect negative correlation while a value of +1.00 represents a perfect positive correlation. A value of 0.00 represents a lack of correlation. *If each p-value is lower than 0.05, then the correlation coefficient is statistically significant. |
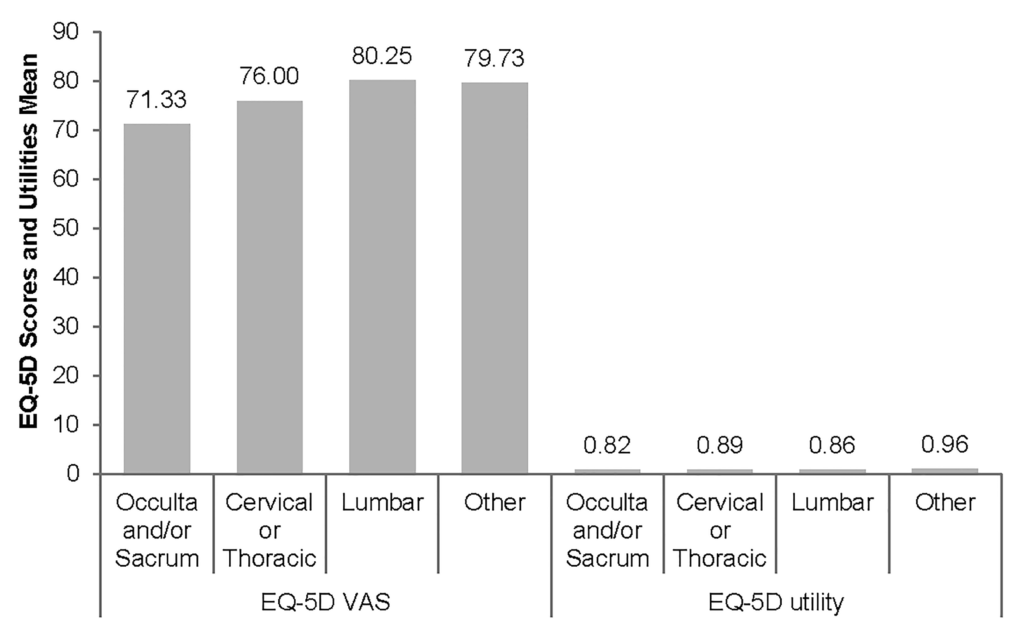
The mean EQ-5D utility and VAS scores for caregivers were 0.88 and 77.67, respectively (see Table 7). Forty-seven percent of caregivers reached the ceiling of utility and 8% VAS scores. The summary of the EQ-5D utility (0.89) and VAS (78.86) scores for caregivers of patients with SB with presence of hydrocephalus were slightly higher (see Figure 4), compared to those who were caring for patients without presence of hydrocephalus (0.86 and 76.18, respectively). The lowest EQ-5D utility (71.33) and VAS (0.82) scores were in caregivers of individuals with occult/sacrum disease severity (Figure 5). As reported in Table 8, the pair-wise correlation analysis showed statistically significant correlation between mobility of caregiver EQ-5D component score and patients’ age (p=0.017, correlation co-efficient r=0.29). There was a statistically significant correlation between the individuals’ and caregivers’ mental health component scores but correlation between the patients’ and caregivers’ physical health component scores, as well as EQ-5D utility and VAS, were not statically significant.
| Table 7: EQ-5D Scores and Utilities of Caregiver |
| (N=66) |
N |
Mean |
SD |
Median |
Min |
Max |
% Ceiling |
% Floor |
N (%) Missing |
|
64 |
|
|
|
|
|
|
|
2 (3.03) |
| Mobility |
|
1.20 |
0.41 |
1.00 |
1.00 |
2.00 |
– |
– |
|
| Self care |
|
1.05 |
0.21 |
1.00 |
1.00 |
2.00 |
– |
– |
|
| Usual activities |
|
1.23 |
0.46 |
1.00 |
1.00 |
3.00 |
– |
– |
|
| Pain/discomfort |
|
1.52 |
0.64 |
1.00 |
1.00 |
3.00 |
– |
– |
|
| Anxiety/discomfort |
|
1.34 |
0.54 |
1.00 |
1.00 |
3.00 |
– |
– |
|
| EQ-5D utility |
|
0.88 |
0.22 |
0.99 |
0.18 |
1.00 |
46.97 |
0.00 |
|
|
63 |
|
|
|
|
|
|
|
3 (4.55) |
| EQ-5D VAS |
|
77.67 |
14.90 |
80.00 |
35.00 |
100.00 |
7.58 |
0.00 |
|
Figure 4: EQ-5D Scores and Utilities of Caregivers—By Presence of Hydrocephalus
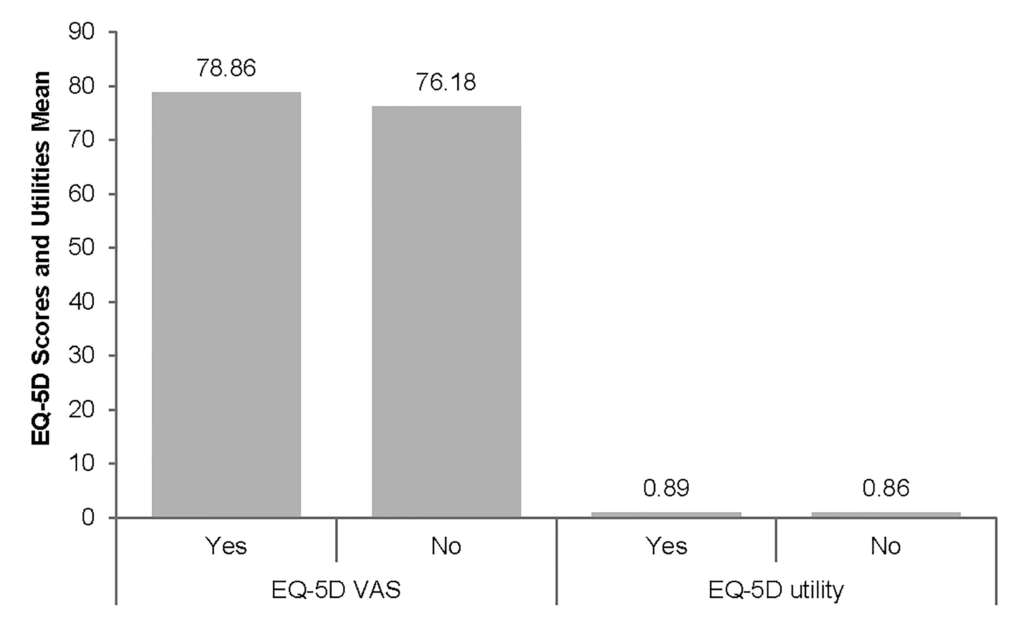
Figure 5: EQ-5D Scores and Utilities of Caregivers-By Disease Severity
| Table 8: Pair-wise Correlation of Caregivers’ EQ-5D and Patients’ Age |
|
N |
Patients’ Age r |
p |
| Mobility |
64 |
0.29572 |
0.0177* |
| Self care |
64 |
0.12025 |
0.3439 |
| Usual activities |
64 |
0.02868 |
0.8220 |
| Pain/discomfort |
64 |
0.22674 |
0.0716 |
| Anxiety/discomfort |
64 |
0.15642 |
0.2171 |
| EQ-5D utility |
64 |
-0.17455 |
0.1677 |
| EQ-5D VAS |
63 |
-0.14224 |
0.2661 |
| Correlation coefficients (r) represent the linear relationship between two variables and can range from -1.00 to +1.00. The value of -1.00 represents a perfect negative correlation while a value of +1.00 represents a perfect positive correlation. A value of 0.00 represents a lack of correlation. *If each p-value is lower than 0.05, then the correlation coefficient is statistically significant. |
DISCUSSION
The main objective of this paper was to highlight the overall burden of illness of NTDs in Canada, of which SB is the most common. Previous research has suggested that most individuals with SB are unable to function independently as adults due to life-long disabilities and medical problems, such as bladder and bowel dysfunction. In addition to physical handicaps, SB has been shown to cause significant neurocognitive and psychological morbidity in both affected children and their caregivers.6,7
When assessing the QoL, subscales and scores were standardised using a US general population to provide a better basis for comparison across scales. Results of the QoL analysis demonstrated that individuals with SB are lower on the physical component score compared to the US population, but better on the mental component score. Analysis of QoL among caregivers showed that the average mental component score was slightly lower in contrast to the physical component score, which was much worse than the US population. When comparing caregivers for those with and without presence of hydrocephalus, both physical and mental component scores were higher for caregivers of individuals with hydrocephalus, indicating a likely more severe nature and, as a result, burden for those with hydrocephalus. Subgroup analyses based on location of the lesion confirmed this assertion.
Our results demonstrate a substantial use of health care resources by individuals with SB and the need for assistance in accessing those resources due to mobility problems. Persons with SB sought care in all of the settings–beginning with frequent visits to the GP office, visits to specialists (urologists and orthopaedists, in particular) and relatively frequent and prolonged hospitalisations. Patients frequently used assistive devices such as wheelchairs, or orthopaedic shoes, and incontinence pads and urinary catheters were the most used items in the last year.
A literature review of cost of illness studies reported that the lifetime direct medical cost for patients with NTDs (including SB) is substantial, with the majority of cost being for in-patient care for treatment at initial diagnosis in childhood, and for comorbidities in adult life.8 Many studies have shown that achieving adequate folate levels around the time of conception has been beneficial in decreasing the potential risk of SB occurrence by 60% to 80%.14,15
Our results indicate that the majority of patients with SB saw a physician or a specialist in the prior year and that they visited health care professionals multiple times per year. They also had frequent hospitalisations with an extended length of stay. Consistent with our findings, a study of secondary care data in the US showed that, when compared with the general population, persons with SB who were hospitalised in 2004 had a significantly greater number of hospitalisations and number of hospitalisations associated with SB-sensitive conditions.16
Another US study evaluated the use of assistive technologies among patients with SB.17 Fifty-seven percent used wheelchairs, 35% used braces, and 23% used walking aids. In our study, although only around one third reported using a wheelchair, nearly a third wore braces on their feet or legs.
There were some limitations to this study. Response and selection bias are typically present in studies using survey methodology. In this study around a third of the eligible population participated. Those with greater mobility and in better health were more likely to be recruited and participate in the study due to the recruitment methodology. This indicates that the actual burden of the condition is underestimated, so estimates should be treated as conservative. Lack of generalisability due to a low number of patients should also be acknowledged. Finally, self-reported data on resource use are not considered as gold standard; patients tend to over-report more serious events (e.g., hospitalisations) and under-report those that they consider common or every day (e.g., scheduled visits). In addition, the reliability of data from the previous 10 years may not be high; however, the study design attempted to minimise the limitations associated with recall by allowing the use of medical or other records and by asking questions on only serious health use events.
Despite these limitations, the study has two considerable strengths. The sample size, though relatively small, is greater than in other studies reporting data directly from individuals with SB and includes data on both child and adult individuals. The resource use questionnaire provided a very detailed description of health care use both over the short and long term; thus, the results provide a very complete picture of the burden of SB.18
CONCLUSION
Findings from this study confirm that the burden associated with patients with SB in Canada is considerable. The physical component of QoL scores is lower compared to the mental component in patients with SB. In caregivers, both physical and mental component scores are higher for those with patients with hydrocephalus. Resource use is high in this population, with frequent GP and urologist visits. The burden is also high for patients who have to take days off school due to their condition. Overall, our study adds to a growing body of research highlighting the need for primary prevention and additional measures beyond health care campaigns.
ACKNOWLEDGEMENTS
Bayer provided funding to Evidera to conduct the study and for editorial services to support the preparation of this manuscript. At the time of study execution, authors MJ and MK were salaried employees of Bayer. Authors FvN, RW, DL, MHJ and RW were salaried employees of Evidera.


