INTRODUCTION
The prevalences of obesity and type 2 diabetes in the United States (US) are high. More than one-third of US adults are obese, but age-adjusted obesity in Hispanics is higher at 42.5%. In 2014, 9.3% of the US population was reported to have type 2 diabetes butthe age-adjusted rate of diagnosed type 2 diabetes in Mexican Americans nationally was also higher at 13.9%.1 CCameron County, Texas is a USA-Mexico border community with 80.5% Mexican Americans2 where we have a community-based cohort, the Cameron county Hispanic cohort (CCHC). Data from this cohort shows that the Cameron county population is characterized as having extremely high rates of obesity, type 2 diabetes, cardiovascular disease along with metabolic complications and other diseases.3,4,5,6,7,8 Obesity is a strong risk factor for type 2 diabetes9 and also plays a significant role in development of lowgrade inflammation.10 It has been shown that many low-grade inflammatory markers, including elevated levels of Interleukin 6 (Il-6), Interleukin 8 (IL-8), C-reactive protein (CRP) and Tumor Necrosis Factor alpha (TNF-α), are associated with insulin resistance and type 2 diabetes.11 Total white blood cell (WBC) count is another inflammatory marker which has been shown to be associated with obesity, impaired glucose tolerance, cardiovascular diseases and type 2 diabetes.12,13 However, there are a few studies that demonstrate association of inflammatory markers with development of type 2 diabetes.14,15,16 In particular, in some studies total WBC count and/or WBC differential counts, lymphocytes and granulocytes, were found to be independent risk factors for development of type 2 diabetes.17,18,19,20,21,22 In addition, the studies of total WBC counts and WBC differential counts and development of type 2 diabetes were conducted in different populations with respect to gender, ethnicity, and glycemic status; however there is no information of how total and differential WBC counts are associated with transition to type 2 diabetes in Mexican-American people of mixed European and Amerindian ancestry.
The aim of our study was to assess potential additive associations of total and differential WBC counts (lymphocytes, monocytes, and granulocytes), CRP, and Body Mass Index (BMI) with time to transition to type 2 diabetes in Mexican Americans using prospective data from the Cameron County Hispanic Cohort. We further evaluated effect modification of BMI and BMI levels on (a) total WBC counts, (b) lymphocytes, (c) monocytes, and (d) granulocytes, and (e) CRP in association with time to transition to type 2 diabetes.
METHODS
Study Population
The Cameron County Hispanic Cohort (CCHC), as previously described,4 was initiated in Cameron County, Texas in 2004 and now numbers more than 3000 participants of age 18 years or older. The initial purpose of the Cohort was to address the burden of chronic diseases such as obesity and type 2 diabetes and their related conditions in Mexican-Americans, one of the fastest growing ethnic groups in the United States. The participants in this nested study were drawn from the CCHC and included on the basis of completion of two or more visits, as follows: (1) participants in a nested study, the type 2 Diabetes Risk Study (DRS), consisting of cohort participants with pre diabetes, but not type 2 diabetes, at their initial visit (fasting blood glucose 100 to 125 gm/dl) and who then visited quarterly over 5 years, or (2) participants visiting the CRU for their regularly scheduled 5- or 10-year follow up visits. Six hundred and thirty six participants fulfilled the inclusion criteria and their data were therefore admitted to this study.
Data Collection
At their first visit all CCHC participants who agreed to participate in the cohort provided written informed consent including permission to be contacted for further studies and to visit again in 5 year intervals. After agreeing to join the DRS nested study a further consent form was signed by participants. All participants visited the Clinical Research Unit (CRU) where they received detailed physical evaluations and responded to questionnaires in either Spanish or English by choice. Socio-demographic and clinical characteristics, biomarkers, family medical history and medications were assessed by trained staff members4 and serial measurements of the variables were routinely entered into the database. Biological specimens and questionnaires were obtained at all visits according to standard CCHC protocols.4
The institutional review boards (IRBs) at The University of Texas Health Science Center and the University of Texas at Brownsville reviewed and approved the protocol and the informed consent forms with permissions to collect and store de-identified data and specimens for this and other studies.
Outcome Variable
The outcome variable of interest was time to first transition from no diabetes and pre-diabetes to type 2 diabetes. The time variable, measured in months, was created as the interval between the date of the follow-up visits and baseline visit. All participants without any evidence of type 2 diabetes after the baseline visit, death or lost-to-follow up were censored at their last observation dates. Type 2 diabetes was defined by the 2010 definitions of the American type 2 diabetes association (ADA)23 and includes a glycated Hemoglobin (HbA1c) of 6.5% or greater and or a fasting blood glucose >126 mg/dl. Participants were categorized to have type 2 diabetes if they answered that they had been told by a health care provider that they have type 2 diabetes, or if they were taking hypoglycemic medications or their laboratory findings met the 2010 ADA criteria for type 2 diabetes.
Independent Variables
The independent variables of interest were BMI, total and differential WBC counts (lymphocytes, monocytes, and granulocytes), and C-reactive protein (CRP) measured at the time of the event or censoring. Other covariates, such as age at the time of the event or censoring, gender, family history of type 2 diabetes, pre-diabetes status, smoking, and triglycerides were included in the regression analysis. Body mass index (BMI) was calculated as weight in kilograms divided by height squared in meters (kg/m2 ). Height was measured to the nearest 10th cm using a stadiometer. Weight (to the nearest tenths of a kilogram) was measured on a calibrated beam balance. BMI groups were created as BMI<25 (normal), 25≤BMI<30 (overweight), and BMI≥30 (obese). Family type 2 diabetes history (yes/no) was defined based on patients’ reported type 2 diabetes status or high blood sugar status ever diagnosed for biological father, biological mother, or siblings. Pre-diabetes was defined as participant having Impaired Fasting Glucose (IFG) between 100 and 126 mg/dl or HbA1c between 5.7% and 6.5%.
STATISTICAL ANALYSIS
Descriptive statistics of baseline demographics and clinical characteristics were conducted. Categorical variables were described using frequency and percentages. Continuous variables were described with mean and standard deviation. SI units are used throughout.
Cox proportional hazard regression model was conducted to estimate hazard ratios and 95% confidence intervals using person-period data. Since the time to type 2 diabetes was right-censored for the participants who did not transition to type 2 diabetes, Breslow’s method was used to handle ties in the data. We fit several univariable Cox proportional hazard regression models for the time to transition to type 2 diabetes including for BMI, total WBC counts, WBC differential counts and CRP. Next, we fit several multivariable Cox proportional hazard models for the time to transition to type 2 diabetes by each significant variable total WBC counts, WBC differential counts and CRP, while adjusting for (1) BMI, and (2) BMI, age, gender, pre-diabetes status, type 2 diabetes family history, smoking and triglycerides.24,25,26,27 In addition, the interactions between BMI and total WBC counts, and BMI and WBC differential counts were tested by including the product of the two variables in the models. The statistical significance of the interaction term in the models was assessed by the overall chi-square test (for interaction with categorical BMI) and the local chi-square test statistic of the coefficient estimates, and by using a likelihood ratio test for the nested models with and without an interaction term. Assessment for multicollinearity between the variables included in the models was performed using Spearman correlation coefficient and Variance Inflation Factors (VIF). The function form of the continuous covariates included in univariable and multivariable Cox proportional hazard regression models were evaluated and as a result, variable CRP was log-transformed and serum triglyceride level was included in the models along with its quadratic form. The proportionality assumption of the hazards in the final models was tested graphically using Schoenfeld and scaled Schoenfeld residuals. Since family type 2 diabetes history and pre-diabetes status did not satisfy the proportional hazard assumption, all models that included these two variables involved stratified analysis using strata statement in SAS Proc PHReg. In the stratified models, the regression coefficients are assumed to be the same in each stratum although the baseline hazard functions may be different.28 The key assumption of the stratified proportional hazards models that the covariates are acting similarly on the baseline hazard function in each stratum was tested by using likelihood ratio test.28 Cox-Snell residuals were used to assess the overall fit of the final models.
All statistical analysis was performed using SAS 9.4.29 All statistical tests were two-sided and were performed using significance (alpha) level of 0.05.
RESULTS
From the original cohort of 3002 subjects, 636 participants who were diabetes free at a baseline visit and had more than one follow-up were included in this study. These 636 subjects did not differ from the rest of the cohort participants in terms of gender, age, number of years lived in Brownsville, and household income. The maximum observation period was nine years and the mean follow-up was 4.4 visits. The participant’s main demographic, anthropometric and clinical baseline characteristics are presented in Table 1. The mean (SD) age of participants was 44.6(14.04) years. The majority of the participants were females (68.5%), born in Mexico (68.9%) and the average number of years lived in Brownsville, TX was of 20.7±15.45 years. More than half of the participants (52%) had no high school education and were full-time or part-time employed (53%). Only 26.6% of the participants had any form of health insurance, and 55% of these had private insurance.
On average, the participants at a baseline visit were overweight and obese with mean BMI 30.6±6.17 (48.8% obese and 36.1% overweight). More than half (53.2%) of the participants had pre-diabetes. Baseline mean WBC count, mean lymphocyte, monocyte and granulocyte counts were within the normal range.
We observed 107 participants (16.8%) who transitioned to type 2 diabetes over the entire follow-up period. Individuals who transitioned to type 2 diabetes compared to those who did not had higher baseline measurements of most clinical characteristics measured, with the exception of triglyceride and cholesterol levels. They were older with higher BMI and waist circumference measurements (Table 1).
| Table 1: Baseline demographic and clinical characteristics (SI units) for type 2 diabetes free participants at a baseline visit using Cameron county Hispanic cohort data, 2003-2014. |
|
Socio-Demographic Characteristic and Clinical Characteristic
|
Total n=636 |
Converted to Type 2 diabetes n=107 |
Not Converted n=529
|
|
Categorical variables
|
n(%) |
n(%) |
n(%) |
| Male |
200(31.5) |
34(31.8) |
166(31.4)
|
|
Female
|
436(68.5) |
73(68.2) |
363(68.6) |
| Born in Mexico |
438(68.9) |
74(69.2) |
364(68.8)
|
|
USA
|
198(31.1) |
33(30.8) |
165(31.2) |
| With no high school education |
328(51.6) |
62(57.9) |
266(50.3)
|
|
With high school education
|
308(48.4) |
45(42.1) |
263(49.7) |
| Employed |
334(52.5) |
52(48.6) |
282(53.3)
|
|
Unemployed
|
302(47.5) |
55(51.4) |
247(46.7) |
| Married |
429(68.6) |
65(60.8) |
364(68.9)
|
|
Not married
|
206(32.4) |
42(39.2) |
164(31.1) |
| Insured |
169(26.6) |
33(30.8) |
136(25.8)
|
|
Uninsured
|
466(73.4) |
74(69.2) |
392(74.2) |
| Smoke |
180(28.3) |
30(28.0) |
150(28.4)
|
|
Do not smoke
|
456(71.7) |
77(72.0) |
379(71.6) |
| Normal weight(BMI<25) |
96(15.1) |
6(5.7) |
90(17.0)
|
|
Overweight(25≤BMI<30)
|
229(36.1) |
28(26.4) |
201(38.1) |
| Obese(BMI≥30) |
309(48.8) |
72(67.9) |
237(44.9)
|
|
Pre-diabetes
|
337(53.2) |
89(83.2) |
248(47.1) |
| No type 2 diabetes |
296(46.8) |
18(16.8) |
278(52.9)
|
|
Continuous variables
|
Mean(SD) |
Mean(SD) |
Mean(SD) |
| Age |
44.6(14.0) |
47.9(13.2) |
44(14.1)
|
|
Years of education
|
11.2(5.3) |
10(4.9) |
11.5(5.4) |
| Years lived in Brownsville |
20.7(15.5) |
23.5(17.1) |
20.1(15.1)
|
|
Annual Household Income
|
$20, 404($22, 944.3) |
$16, 195.4($17, 424.0) |
$21, 221.4($23, 801.6) |
| Waist circumference(cm) |
100.1(13.5) |
106.8(15.0) |
98.8(12.8)
|
|
Hip circumference(cm)
|
110.1(11.8) |
114.2(13.2) |
109.2(11.4) |
| Waist-to-hip ratio |
0.9(0.1) |
0.9(0.1) |
0.9(0.1)
|
|
BMI
|
30.6(6.2) |
33.5(7.4) |
30(5.7) |
| Number of White Blood Cells x 109 /L (n=328) |
6.4(1.5) |
6.9(1.7) |
6.3(1.4)
|
|
Number of Lymphocytes x 109 /L (n=328)
|
2.2(0.6) |
2.3(0.6) |
2.2(0.6) |
| Number of Monocytes x 109 /L (n=328) |
0.4(0.2) |
0.4(0.2) |
0.4(0.2)
|
|
Number of Granulocytes x 109 /L (n=328)
|
3.8(1.2) |
4.2(1.3) |
3.8(1.1) |
| Triglyceride mmol/L |
1.8(1.5) |
2.0(1.6) |
1.8(1.4)
|
|
C reactive protein mmol/L
|
51.4(61.0) |
66.7(79.0) |
48.6(56.2) |
| Glycated hemoglobin(HbA1c)% mmol/mol IFCC /% |
5.4(0.6)
36(6.6) |
5.6(0.5)
38(5.5) |
5.3(0.6)
34(6.6)
|
|
Mean FBG mmol/L
|
5.3(0.6) |
5.8(0.5) |
5.2(0.5) |
| Low density lipoprotein mmol/L |
3.0(0.9) |
2.9(0.8) |
3.0(1.0)
|
|
High density Lipoprotein mmol/L
|
1.3(0.3) |
1.2(0.3) |
1.3(0.3) |
| Total cholesterol mmol/L |
5.1(1.1) |
4.9(0.7) |
5.1(1.2)
|
|
HOMA_IR: MMOL_GLUC*ins/22.5
|
22.2(16.2) |
28.8(18.1) |
21.0(16.2) |
| Insulin pmol/l |
93.6(65.5) |
112.2(66.8) |
89.4(64.7)
|
There is a weak (r<0.30) pairwise correlation between total WBC count, lymphocytes, granulocytes, monocytes and BMI, age, gender, smoking status, family history of type 2 diabetes, pre-diabetes, and triglycerides. However, the correlation analysis showed that there was a high dependency between total WBC counts and granulocytes (r=0.91, p-value<0.0001), total WBC counts and lymphocytes (r=0.60, p-value<0.0001), and between total WBC counts and monocytes (r=0.51, p-value<0.0001). A weak positive relationship was found between lymphocytes and granulocytes (r=0.31, p-value<0.0001).
Univariable Cox proportional hazard regression analysis showed that the total WBC count [HR=1.17, 95% CI (1.06-1.28), p-value=0.0011], lymphocytes [HR=1.79, 95% CI (1.32-2.42), p-value=0.0002], granulocytes [HR=1.14, 95% CI (1.02-1.27), p-value=0.0229], and BMI [HR=1.07, 95% CI (1.04-1.10), p-value<0.0001] were significantly associated with transition to type 2 diabetes (Table 2). When BMI was modeled as a categorical variable with three levels (normal BMI <25, overweight 25≤BMI<30 and obese BMI≥30) the chisquare test resulted in significant Hazard Ratio (HR) in obese compared to normal BMI group [HR=3.95, 95% CI (1.60-9.77), p-value=0.003] and in obese compared to overweight group [HR=1.77, 95% CI (1.14-2.73), p-value=0.0105]. Using family history and pre-diabetes stratified multivariable Cox proportional hazard regression models, after controlling for age, gender, smoking status, and triglycerides, the total WBC count, lymphocytes, granulocytes, and BMI, remained statistically significantly associated with the development of type 2 diabetes (Table 2). In the multivariable regression models (Table 3), controlled for other potential confounders, there was a significant interaction between total WBC counts and continuous BMI [HR=1.02, 95% CI (1.00-1.03), p-value=0.0203] which was confirmed with log likelihood ratio test for the nested models, with and without the interaction term (p-value=0.0439) (Figure 1). In addition, there was a significant interaction effect between granulocytes and BMI [HR=1.02, 95% CI (1.00-1.04), p-value=0.0147, log likelihood ratio test p-value=0.0331] (Table 3). Lymphocytes were significantly associated with development of diabetes (Table 3) with HR=1.68 [95% CI (1.22-2.32), p-value=0.0015].
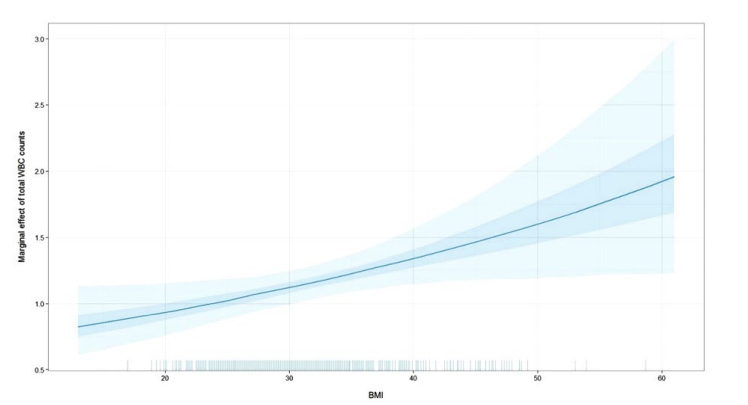
Figure 1: Simulated adjusted hazard ratio with the 95% probability interval of simulations of total WBC counts by unit increase in BMI.
|
Variables
|
Crude Hazard Ratios for developing type 2 diabetes |
Adjusted* Hazard Ratios for developing type 2 diabetes
|
|
HR(95% CI)
|
P value |
HR(95% CI) |
P value
|
|
Total WBC x 109 /L
|
1.17(1.06-1.28) |
0.0011 |
1.18(1.07-1.31) |
0.0008 |
| Lymphocytes x 109 /L |
1.79(1.32-2.42) |
0.0002 |
1.72(1.26-2.35) |
0.0006
|
|
Monocytes x 109 /L
|
2.58(0.78-8.56) |
0.1226 |
2.27(0.71-7.31) |
0.1692 |
| Granulocytes x 109 /L |
1.14(1.02-1.27) |
0.0229 |
1.16(1.04-1.30) |
0.0108
|
|
log(C reactive protein)
|
1.12(0.91-1.37) |
0.2993 |
1.11(0.97-1.27) |
0.1235 |
| BMI |
1.07(1.04-1.10) |
<0.0001 |
1.04(1.003-1.09) |
0.0365
|
|
BMI groups
|
|
|
|
|
|
25≤BMI<30 vs. BMI <25
|
2.23(0.86-5.79) |
0.098 |
1.96(0.75-5.13) |
0.1697 |
| BMI≥30 vs. BMI <25 |
3.95(1.60-9.77) |
0.003 |
3.15(1.25-7.94) |
0.0148
|
|
BMI≥30 vs. 25≤BMI<30
|
1.77(1.14-2.73) |
0.0105 |
1.61(0.99-2.60) |
0.0529
|
*Hazard ratios adjusted for age, gender, smoking, and triglycerides, and stratified by family history for type 2 diabetes and prediabetes status using strata statement in SAS Proc PHReg.
Table 2: Univariable and multivariable Cox proportional hazard regression analyses of time to first type 2 diabetes on follow-up measures of total WBC count, WBC count differentials, CRP and BMI using Cameron county Hispanic cohort data, 2003-2014.
|
Models
|
Models with X=WBC |
Models with X=Lymphocytes |
Models with X=Monocytes |
Models with X=Granulocytes |
Models with X=ln(CRP)
|
|
Variables
|
HR(95% CI) |
P value |
HR(95% CI) |
P value |
HR(95% CI) |
P value |
HR(95% CI) |
P value |
HR(95% CI) |
P value
|
|
X
|
0.67(0.41-1.08) |
0.1018 |
1.68(1.22-2.32) |
0.0015 |
1.85(0.53-6.38) |
0.3332 |
0.58(0.33-1.01) |
0.0553 |
1.04(0.90-1.20) |
0.6475
|
|
BMI
|
0.92(0.82-1.03) |
0.148 |
1.05(1.02-1.08) |
0.001 |
1.05(1.02-1.08) |
0.0007 |
0.94(0.85-1.03) |
0.1868 |
1.05(1.02-1.08) |
0.0012 |
| X*BMI |
1.02(1.00-1.03) |
0.0209 |
|
|
|
|
1.02(1.00-1.04) |
0.0147 |
|
|
|
Hazard ratio for X by the level of the interacting variable BMI
|
|
X and BMI=20
|
0.95(0.77-1.16) |
|
|
|
|
|
0.89(0.70-1.13)
|
|
|
|
|
X and BMI=25
|
1.03(0.89-1.20) |
|
|
|
|
|
0.99(0.83-1.17) |
|
|
|
| X and BMI=30 |
1.13(1.01-1.26)
|
|
|
|
|
|
1.10(0.96-1.26)
|
|
|
|
|
X and BMI=35
|
1.23(1.09-1.38) |
|
|
|
|
|
1.23(1.06-1.41) |
|
|
|
| X and BMI=40 |
1.34(1.14-1.57)
|
|
|
|
|
|
1.36(1.13-1.65)
|
|
|
|
*All models were stratified by family history for type 2 diabetes and pre-diabetes status using strata statement in SAS Proc PHReg and adjusted for age, gender, smoking, and triglycerides.
Table 3: Multivariable Cox proportional hazard regression models*for time to first type 2 diabetes on follow-up measures of total WBC count, WBC count differentials, CRP and BMI as continuous using Cameron County Hispanic Cohort data, 2003-2014.
In the multivariable Cox regressions conducted with BMI as a categorical variable (Table 4) a significant interaction effect was found between BMI and total WBC count (log likelihood ratio test p-value=0.0192). The hazard of transition to type 2 diabetes in thousands increase per microliter in total WBC count is 1.39[95% CI (1.07-1.81), p-value=0.0127] times higher in obese individuals compared to overweight individuals. This was also shown graphically in Figure 2 with estimated hazard ratios for total WBC counts by BMI levels. The line for BMI ≥35 lies above the lines for BMI<25 and 25≤BMI<35, respectively, and it was crossed with the line for 25≤BMI<35 but paralleled with the line for BMI<25. The local chi-square test in the adjusted models showed a significant HR 1.35[95% CI (1.01-1.81), p-value=0.0432] for increased levels in thousands granulocytes blood cells count per microliter comparing obese to overweight individuals (Table 4, Figure 3).
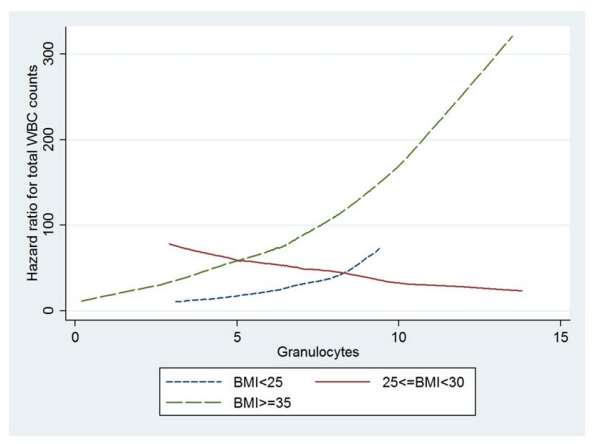
Figure 2: Figure 3: Estimated adjusted hazard ratios for granulocytes by BMI levels.
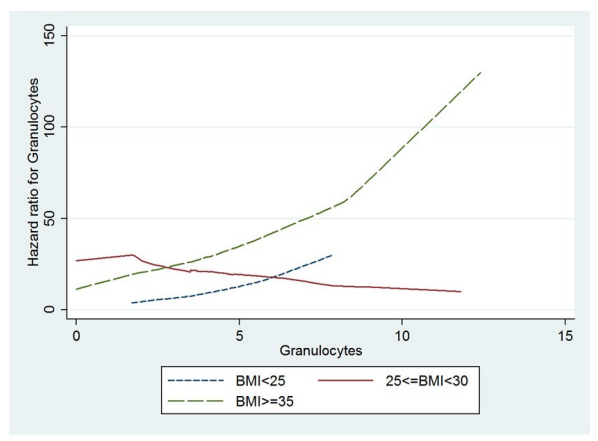
Figure 3: Estimated adjusted hazard ratios for granulocytes by BMI levels.
| Table 4: Multivariable Cox proportional hazard regression models* for time to first type 2 diabetes on follow-up measures of total WBC count, WBC count differentials, CRP and BMI categories using Cameron county Hispanic cohort data, 2003-2014. |
|
Models
|
Models with X=WBC |
Models with X=Lymphocytes |
Models with X=Monocytes |
Models with X=Granulocytes |
Models with X=log(CRP)
|
|
Variables
|
HR (95% CI) |
P value |
HR (95% CI) |
P value |
HR (95% CI) |
P value |
HR (95% CI) |
P value |
HR (95% CI) |
P value |
| X |
1.45 (0.89-2.35) |
0.1384 |
1.08 (0.25-4.72) |
0.9229 |
2.18 (0.66-7.19) |
0.1996 |
1.38 (0.86-2.23) |
0.1869 |
1.06 (0.92-1.22) |
0.4055
|
|
25≤BMI<30 vs. BMI<25
|
33.89 (0.81-1419.9) |
0.0645 |
2.39 (0.16-35.38) |
0.5265 |
1.92 (0.73-5.04) |
0.186 |
11.25 (0.73-172.51) |
0.0822 |
1.81 (0.69-4.77) |
0.2308 |
| BMI≥30 vs. BMI <25 |
6.34 (0.18-224.11) |
0.3097 |
0.96 (0.08-11.77) |
0.9757 |
3.12 (1.24-7.87) |
0.0158 |
4.97 (0.38-65.93) |
0.2239 |
3.02 (1.19-7.68) |
0.02
|
|
X*25≤BMI<30 vs. BMI<25
|
0.63 (0.37-1.09) |
0.0967 |
0.87 (0.16-4.56) |
0.8651 |
|
|
0.67 (0.39-1.15) |
0.1457 |
|
|
| X*BMI≥30 vs. BMI <25 |
0.88 (0.53-1.46) |
0.6227 |
1.9 (0.42-8.71) |
0.4078 |
|
|
0.9 (0.55-1.48) |
0.682 |
|
|
|
X* BMI≥30 vs. 25≤BMI<30
|
1.39 (1.07-1.81) |
0.0127 |
2.2 (0.96-5.04) |
0.0635 |
|
|
1.35 (1.01-1.81) |
0.0432 |
|
|
| Hazard ratio for X by the level of the interacting variable BMI |
|
X and BMI<25
|
1.45 (0.89-2.35) |
|
1.08 (0.25-4.72) |
|
|
|
1.38 (0.86-2.23) |
|
|
|
| X and 25≤BMI<30 |
0.92 (0.73-1.15) |
|
0.93 (0.44-1.99) |
|
|
|
0.92 (0.71-1.19) |
|
|
|
|
X and BMI≥30
|
1.27 (1.13-1.44) |
|
2.05 (1.42-2.94) |
|
|
|
1.25 (1.09-1.43) |
|
|
|
*
All models were stratified by family history for type 2 diabetes and pre-diabetes status using strata statement in SAS Proc PHReg and adjusted for age, gender, smoking, and triglycerides.
To further determine if granulocytes and lymphocytes were associated independently of each other with transition to type 2 diabetes, additional Cox proportional hazards models were fitted for (1) granulocytes and lymphocytes together and (2) for granulocytes and lymphocytes together controlled for BMI, age, gender, smoking status, family history of type 2 diabetes, pre-diabetes, and triglycerides. Table 5 shows that lymphocytes were independently associated with transition to type 2 diabetes after controlling for granulocytes and the other potential confounders. In addition, there was a significant interaction between granulocytes and BMI[HR=1.02, 95% CI (1.00-1.04), p-value=0.0177, log-likelihood ratio test p-value=0.0189] indicating that the effect of granulocytes on transition to type 2 diabetes is different for different values of BMI, after controlling for the effect of lymphocytes and the other potential confounders. More specifically, the HR for granulocytes was significant when BMI≥35 [HR=1.18, 95% CI (1.01, 1.37)] and the hazard ratio increased as the values of BMI increased.
| Table 5: Multivariable Cox proportional hazard regression analyses of time to first type 2 diabetes on follow-up measures of lymphocytes and granulocytes using Cameron county Hispanic cohort data, 2003-2014. |
|
Models
|
Model 1 |
Model 2 |
Model 3* |
Model 4*
|
|
Variables
|
HR(95% CI) |
P value |
HR(95% CI) |
P value |
HR(95% CI) |
P value |
HR(95% CI) |
P value |
| Granulocytes x 10^3 /uL |
1.1(0.97-1.24) |
0.1279 |
1.05(0.92-1.20) |
0.4413 |
1.1(0.97-1.26) |
0.1448 |
0.55(0.31-1.00) |
0.0489
|
|
Lymphocytes x 10^3 /uL
|
1.7(1.25-2.32) |
0.0008 |
1.57(1.13-2.17) |
0.0068 |
1.6(1.15-2.22) |
0.0054 |
1.58(1.14-2.21) |
0.0066 |
| BMI |
|
|
1.06(1.03-1.09) |
<0.0001 |
1.05(1.02-1.08) |
0.0022 |
0.93(0.84-1.03)
|
0.1768
|
|
Granulocytes x 10^3 /uL* BMI
|
|
|
|
|
|
|
1.02(1.00-1.04)
|
0.0177
|
|
Hazard ratio for X by the level of the interacting variable BMI
|
|
Granulocytes and BMI=20
|
|
|
|
|
|
|
0.85(0.66-1.10)
|
|
|
Granulocytes and BMI=25
|
|
|
|
|
|
|
0.95(0.78-1.15)
|
|
|
Granulocytes and BMI=30
|
|
|
|
|
|
|
1.06(0.91-1.23)
|
|
|
Granulocytes and BMI=35
|
|
|
|
|
|
|
1.18(1.01-1.37)
|
|
|
Granulocytes and BMI=40
|
|
|
|
|
|
|
1.31(1.07-1.61)
|
|
*Models adjusted for age at the time of the event or censoring, gender, smoking, and triglycerides and stratified for family history of type 2 diabetes and pre-diabetes status using strata statement in SAS Proc PHReg
DISCUSSION
Prospective data from our Mexican American population-based cohort revealed that total white blood cell counts, particularly lymphocytes and granulocytes were associated with risk of transition to type 2 diabetes. This remains true in both crude and controlled analyses using BMI and other potential confounders such as age, gender, smoking status, family history of type 218 diabetes, pre-diabetes, and serum triglyceride levels. Other studies conducted on different populations in respect to gender, geographic location, ethnicity, and glycemic status, have reported significant relationship between incidence of type 2 diabetes and the WBC count and WBC count differentials.17,18,19,20,21,22 In a multicenter, multi-ethnic study using a range of glucose tolerance levels in USA states population without type 2 diabetes, Lozeno, et al. reported a significant association between higher lymphocyte counts and incidence of type 2 diabetes, after controlling for smoking, family history of type 2 diabetes, fasting blood glucose and BMI but did not find significant association between total WBC count and incidence of type 2 diabetes after controlling for the other covariates.18 In a prospective cohort study of young, normoglycemic men with normal WBC counts, conducted in Israel, Twig, et al. reported that total WBC count was an independent risk factor for development of type 2 diabetes after controlling for age, smoking, family history of type 2 diabetes, fasting blood glucose, triglycerides and BMI.20 In a prospective cohort study of Pima Indians with baseline normal glucose tolerance, Volzorova, et al. also found total WBC counts to be an independent risk factor for development of type 2 diabetes, after controlling for age, gender and percent of body fat.17 Similarly, Jiang, et al. reported that elevated total WBC count was independently associated with deterioration in glucose metabolism in middle-aged and elderly Chinese.19 In addition, neutrophils, which comprise the majority of granulocytes, were found significantly associated with incident type 2 diabetes.30
Although it is hard to compare WBC differentials between people living in different environments our findings confirmed these previous findings that increasing total WBC counts, lymphocytes and granulocytes to be independent predictors of transition to type 2 diabetes in Mexican Americans when controlling for other potential confounders. Moreover, we further examined the presence of statistical interaction effects in the Cox proportional hazards regression models, towards better explanation of the development of the type 2 diabetes. Our study indicated that total WBC count and granulocytes and BMI were jointly associated with development of type 2 diabetes. Higher levels of total WBC and granulocyte count were stronger predictors of incident type 2 diabetes in obese in compare to overweight individuals. Similar findings were reported only for total WBC counts in the cohort study of young normal glycemic Israeli men conducted by Twig G, et al.20 Our results suggest that obese Mexican-American participants with higher levels of total WBC count had 1.39 times higher risk of transition to type 2 diabetes when compared to overweight participants. Likewise, obese Mexican-American with higher granulocytes counts had 1.35 times higher risk of conversion to type 2 diabetes when compared to overweight participants. Additionally we showed that lymphocyte and granulocyte count are independent risk factors for transition to type 2 diabetes, in particular, granulocyte count is a risk factor for categories II and III obese people (BMI>=35).
Though granulocytes (principally neutrophils) are considered the arm of the innate immune response and lymphocytes that of the acquired immune responses, it is now clear that there is considerable and complex cross-talk and collaboration between cells of both these systems both in acute and chronic disease.31 Both these systems are implicated in the chronic inflammatory syndrome of type 2 diabetes.32 Infiltration of visceral adipose tissues with neutrophils, macrophages and lymphocytes is now recognized to be associated with both obesity and type 2 diabetes.32,33,34 Whether this process is associated with increased numbers of circulating cells of these lineages is unknown, but in Table 2 it is interesting to note that increases in the lymphocyte lineages are noticeably associated with development of type 2 diabetes.32 Overall these observations suggest that it is reasonable to hypothesize that the increase in total and differential WBC counts that we observe may be markers of increase in the inflammatory syndrome and increasing insulin resistance prior to development of overt type 2 diabetes.32
STRENGTH AND LIMITATIONS
CCHC data is representative by design of this single ethnicity border population characterized with high prevalence of type 2 diabetes and other conditions and biomarkers for chronic diseases.3,4,5,6,7 Although many of the participants do not have the same follow-up time, the response rate of the CCHC participants is high. To our knowledge, this study was the first conducted in a Mexican-American population, to assess risk factors leading to the development of type 2 diabetes. In addition our study has some novel findings that in non-diabetic and pre-diabetic population lymphocytes is an independent of granulocytes factor of incident type 2 diabetes regardless of the levels of BMI, while granulocytes is an independent risk factor when BMI>=35.
Our study has some limitations. Based on the results from the analysis we did not find any association between CRP and transition to type 2 diabetes as shown in several studies.35,36,37,38 We did not find any interaction between continuous BMI and lymphocytes. The reason is that the study was performed based on available data of 636 participants and detecting statistically significant smaller interaction effects in the Cox proportional hazard regression models may be underpowered.39 Moreover, it is known, that larger sample sizes are needed to study interactions involving continuous variables.39
CONCLUSIONS
Increased total WBC and WBC differential counts, particularly lymphocytes and granulocytes, are associated with risk of transition to type 2 diabetes, particularly among the obese Mexican-American, after adjusting for other potential confounders. Our study emphasizes the predictive importance of total WBC counts, lymphocytes and granulocytes in obese participants, in particular the role of lymphocytes and granulocytes. Our observations emphasize the central role of chronic inflammation in the pathology of type 2 diabetes, and that this process is underway well before diagnosis. Since inflammation plays a role in the development of type 2 diabetes understanding its role is important in development of prevention strategies for type 2 diabetes. Since our study suggests that screening and monitoring the WBC counts, lymphocytes and granulocytes can help with predicting potential transition to type 2 diabetes administering anti-inflammatory medications in addition to life-style changes may bolster efforts in preventing this disease.
ACKNOWLEDGMENTS
Author Contributions: Research idea and study design: KPV, MHR, JBM; Data acquisition: JBM, SPF; statistical analysis/ interpretation: KPV; Wrote the manuscript: KPV; Reviewed/ edited manuscript: JBM, SPH, MHR, ML, RLO. Each author: provided intellectual content; contributed significantly to the preparation and/or revision of the manuscript; and approved the final version of the manuscript. KPV takes responsibility for the integrity of the data and the accuracy of the data analysis. This work was supported by the Center for Clinical and Translational Sciences, which is funded by National Institutes of Health (NIH), Clinical and Translational Award UL1 TR000371 from the National Center for Advancing Translational Sciences. The content is solely the responsibility of the authors and does not necessarily represent the official views of the National Center for Advancing Translational Sciences (NCATS) or the National Institutes of Health (NIH). We thank our cohort team particularly our Project Manager Rocio Uribe, we also thank the data management staff, Marcela Morris and other laboratory staff for their contributions, and Christina Villarreal for administrative support. We thank Valley Baptist Medical Center, Brownsville for providing us space for our Center for Clinical and Translational Science Clinical Research Unit. We thank the community of Brownsville and the participants who willing to participate in this study.
DISCLOSURE
None of the authors have any conflicts of interest to declare.


