INTRODUCTION
Malaria epidemics are an important public health problem for the populations of Sub Saharan Africa1,2,3,4,5 The influence of climatic factors on the genesis of malaria epidemics has been described in numerous studies.6,7,8,9 Early detection of these epidemics has been difficult; however, giving rise to high rates of morbidity and mortality that could be avoided with timely and effective detection and intervention measures.10-11 Initiatives such as the Malaria Early Warning Systems12 have been undertaken to develop and evaluate more precise methods for the definition, detection, early warning and forecasting of malaria epidemics.13,14,15 Both the definition and methods of detection of malaria epidemics are generally based on the estimation of measures of central tendency and dispersion of historic malaria morbidity to establish epidemic thresholds in order to make decisions about the application of contingency measures to control its spread.16,17 This approach suffers from serious methodological weaknesses, however, such as the arbitrary manner of deciding what morbidity rates to exclude from the calculation of the threshold because they are considered epidemic values, thus defining “epidemic” before hand in order to make a supposedly objective determination of what constitutes an epidemic. Another limitation is the use of statistical procedures for the treatment of random variables for measurements of incidence, when the variables are auto-correlated, because of these kinds of weaknesses; the epidemiologic thresholds for epidemic detection obtained by such methods are not reliable.
Our starting hypothesis is that environmental factors such as temperature, precipitation and vegetation levels, as estimators of the population density and infectivity of the vector and the development of the parasite, on the one hand, combined with the level of malaria incidence in a recent period, as an estimator of the magnitude of the parasite reservoir and population susceptibility, on the other, could explain variations in malaria incidence. This study aims to create a theoretical epidemiologic threshold i.e, endemic, non-epidemic, usually expected, normally, incidence, based on the behavior of the incidence rate predicted by a model that establishes the relations among the variables. The purpose is to obtain a simple and easily applied tool that provides a practical and reliable way to identify epidemics, so that health services can implement timely control measures to interrupt the spread of the disease or mitigate its effects, and to assess the effectiveness of health interventions to these ends. Considering the methodological purpose of this study we use only real data in order to verify the validity and accuracy of our theoretical elaboration. This verification uses as empirical material the available reports of monthly malaria cases treated by the medical services routinely collected by the surveillance system, together with monthly levels of rain, temperature and vegetation density in the province of Karuzi, Burundi, during a seven years period.
MATERIAL AND METHODS
Our model is based on factors related with malaria transmission described by MacDonald.18 According to this relation; the determining factors are vector population density, transmission capacity based on vector survival and duration of the extrinsic incubation period, and immunity in the susceptible human host. Rainfall influences the vector population by affecting larvae production and maturation capacity, and is reflected in the vegetation index; and temperature influences transmission capacity by affecting the extrinsic incubation period. Our hypothesis is based on the fact that in tropical areas at altitudes over 1,200 m, the most important factor limiting malaria transmission is minimum temperature, since under 16 ºC inhibit parasite maturation, sexual reproduction and sporozoite development. Tropical areas between latitudes 25 ºN and 25 ºS and at altitudes of 1,000-2,000 m have enough monthly precipitation to maintain abundant marshy areas where vector larvae can develop. In an epidemic situation, factors that can most plausibly explain fluctuations in transmission are: i) increased minimum temperature, which would permit a prolongation of seasonal transmission and a “staircase” effect of repeated superinfections with increasing parasitemia and anemia up to clinical thresholds; ii) increased maximum temperature, shortening the extrinsic incubation period with an exponential effect on vector transmission capacity; iii) increased rainfall, with consequent increase in vegetation density, resulting in a larger vector population and a transmission increase; and iv) increased population reservoir of the parasite, which induces faster transmission.
One way of symbolically representing these assumptions can be obtained by taking I t to mean the malaria incidence rate in month t; Rt as the cumulative level of precipitation in that month; Tt as the mean temperature in that month; Vt as the mean vegetation density in that month; p as the seasonal oscillation period for the previous three variables; and I t+k as the malaria incidence rate for a future month that is k months from month t. These variables would then be interrelated as follows:
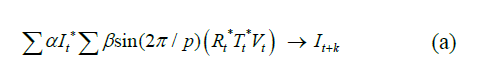
This relation represents a cumulative linear combination of previous values of the incidence rate, as an estimator of immunity or population reservoir, and the combination of past levels of rainfall, temperature and vegetation density, as estimators of vector capacity, combined to influence future values of the incidence rate. The term that includes rainfall, temperature and vegetation confers an oscillation in the malaria incidence with a period according to their common seasonality. In expression (a) α is the coefficient for the incidence rate, and β for the amplitude of seasonal oscillation estimated by regression. The use of * as an operator to link the components expresses the lack of a priori knowledge of how they are interrelated. The model combines all those terms having significant autocorrelation and cross-correlation coefficients with the incidence rate in their corresponding lags.
Data Processing
First we explored malaria rate series, together with temperature, precipitation and vegetation levels series, to identify regularities. Incidence rate trend analysis and periodogram obtained with Fast Fourier and Tukey Transforms help to identify the periodic oscillations to be modeled. The sub-series of the last seasonal period are separated. The shortened series is called “base” and the separate sub-series “complement”. Rainfall, temperature and vegetation series are shortened to the base period. Simple autocorrelation function (ACF) and partial autocorrelation function (PACF) graphics are obtained for these bases, with lags equal to their oscillation period. Then, we identified, adjusted and evaluated autoregressive integrated moving average (ARIMA) models, which explains the malaria rate by its past values, to introduce as a term in model (a). Periodograms are obtained for the bases of precipitation, temperature and vegetation series to identify seasonal oscillations and their period p in (a). Cross correlations are obtained of these three series with the ARIMA model residual in the malaria rate base series, to identify lags in the relationship. The ARIMA and oscillatory component terms are combined to form model (a). The coefficients of the terms and goodness-of-fit of the model are estimated. The model works by successively entering the previous rates predicted by the model itself, and the observed values for precipitation, temperature and vegetation in their corresponding lags, thereby obtaining each expected non-epidemic rate in the time series window. The 95% confidence thresholds are estimated with the base rate series white-noise residuals. Data processing was performed using the SPSSTM 21.0 and Statgraphics PlusTM 5.1. The usual two-tailed statistical significance level of p≤0.05 was established for all these tests.
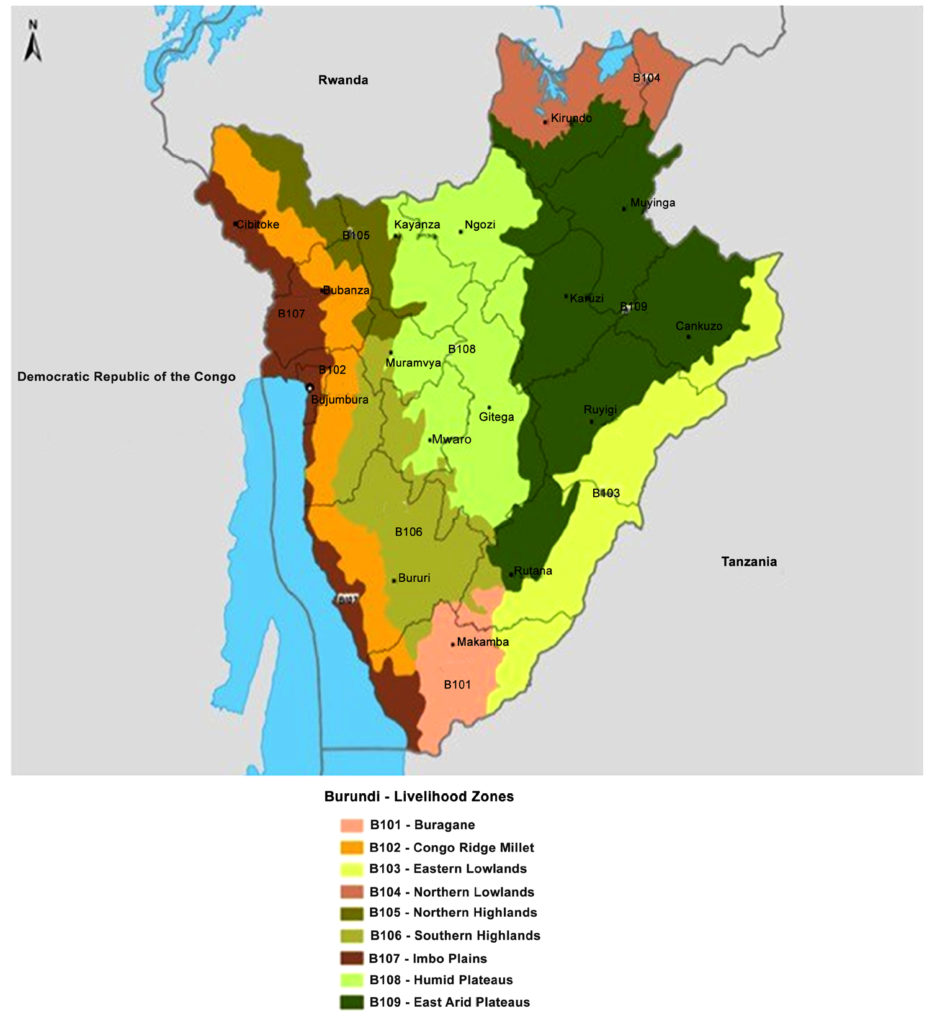
Information available for the model derivation and accuracy testing was obtained from Médecins Sans Frontières in Karuzi. Karuzi is a Burundi’s province located in the central eastern area of the country, with a population around 300,000 inhabitants, at an altitude of 1,500-1,900 m, with mean annual temperatures ranging from 10.5-13 ºC to 25.5-28.5 ºC. The area is characterized by a October-May wet season, with 141 mm mean monthly precipitation, and a June-September dry season, with 30 mm mean precipitation. The vegetation mass varies with a mean monthly Normalized Difference Vegetation Index (NDVI) of 0.36 in July-October, and 0.53 in November-June. In Figure 1 shows a typical Burundi vegetation map. Karuzi has a health network consisting of a 100-bed hospital and 11 health centers with a total of 311 beds.19 The monthly malaria incidence rate is estimated from medical consultations considering as a case the patient seeking medical care with a fever over 38 ºC, after excluding other causes. five hundred twenty percent of clinical cases had microbiological confirmation in non-epidemic periods, and <2% during outbreaks, depending on the health facility. For the incidence rate the monthly cumulative reports is the numerator and the denominator is the total population of the province according to the census adjusted for the growth factor. We use the cumulative monthly level of precipitation and the minimum and maximum mean monthly temperature recorded by the local meteorological stations, as well as the NDVI provided by the National Oceanographic and Atmospheric Administration satellites.20 The images of the vegetation index were processed using WinDisp 4. This available information covers the January 1997 through December 2003 period. During this period various epidemic events occurred in Karuzi.17,21 Moreover, at the end of 2003, Médecins Sans Frontières together with the Burundi Ministry of Health, launched an intervention to reduce transmission consisted of implementing a new protocol to diagnose and treat malaria, including rapid serologic diagnosis of suspected cases and first-line treatment with artemisinin compounds drugs22 that produced an important reduction in disease transmission, which is still under evaluation.23 To test the accuracy of the forecast obtained with the model, the expected and observed endemic rates are compared for the periods in which the epidemic events and reduced incidence occurred.
Figure 1: Burundi map of vegetation.
RESULTS
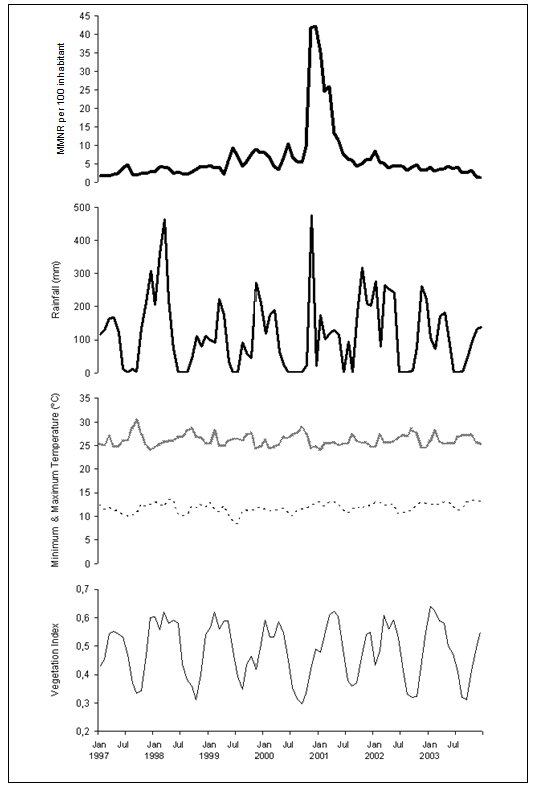
Figure 2 shows the 1997-2003 series used to construct the model. Its visual exploration does not seem to indicate any trend; for rain, temperature and vegetation, there is a certain seasonal-type oscillation with a 0, 5-1 year period. The results of the trend analysis and periodograms show neither trend nor periodic oscillation in the cumulative monthly rate of malaria reports, while for the rest of the series they confirm the trend absence, and yearly period seasonality. Consequently, for rainfall, temperature and vegetation series the 1997-2002 period is taken as the base, reserving their values during 2003 as the complement, and the malaria rate series is forced to the same cut-offs to form its base and complement.
Figure 2: Monthly Malaria Notification Rate per 100 inhabitants in Karuzi province, Burundi, from January 1997 to December 2003 (MMNR, first picture in heavy bold solid line); Monthly cumulative rainfall in mm (Rainfall, second pictures in light bold solid line); Maximum and Maximum monthly temperature in ºC (Maximum Temperature, third picture in bold dashed line; Minimum monthly, fourth picture in light dashed line); and Normalized Difference Vegetation Index (Vegetation Index, fifth picture in light solid line).
Correlograms of the base malaria rates show a non-seasonal configuration with significant coefficients only in lag 1 (ACF=0.82, PACF=0.82, both p<0.05) which indicates that ARIMA model (1, 0, 0) represents the influence of each preceding value on the following one. This model fits with a coefficient of 0.80 (p<0.011) and explains 80% of the observed variability in the rate, leaving a residual that is nearly white noise, but with hints of regular patterns.
The base periodograms of precipitation, temperature and vegetation show, similar to complete series, a seasonal oscillation with a period of 12 months, therefore term1 of the model takes the form sinβ (0.52 Rt Tt Vt). Cross-correlation of this term with the residuals of ARIMA (1,0,0) shows that only the lag 1 coefficient is significant, therefore the environmental influence on the malaria rate becomes sinβ (0.52Rt-1 Tt-1 Vt-1). With the addition of the term for the influence of the environmental variables to the autoregressive term, and after fitting the model, it takes the form:
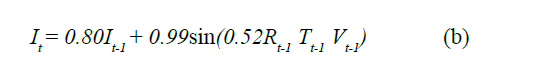
This model explains a 82% of the observed variability in the malaria rate (R2 adj, p<0.0001) with a 95% CI of 0.68-0.95 (p<0.0001) for the coefficient of the autoregressive term and of 0.97-1.00 (p<0.0001) for the environmental term. Model (b) leaves a white noise residual on the base malaria rates, normally distributed with a mean of 0 and 0.98 SD.
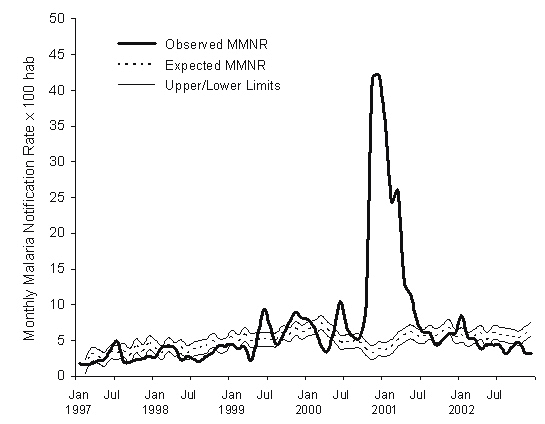
Figure 3 depicts the expected epidemiologic threshold for the malaria rate, with its 95% confidence interval, that is obtained with this model for the period February 1997-December 2002, using the rate for January 1997 as the initial value, and the precipitation, maximum temperature and vegetation density for each preceding month. Table 1 shows the expected nonepidemic monthly cumulative malaria case-reported rate for the base malaria series, the epidemiologic threshold, and the observed value for each month in the period 1997-2002. This epidemiologic threshold identifies four periods of an excess in malaria incidence rates: June-July 1999, October 1999-January 2000, June-July 2000, and October 2000-June 2001, corresponding to the four epidemics that occurred in the study period.13,19 The two values of the rate that exceeds the threshold of the epidemiologic threshold during a single month (July 1997 and January 2002) were not considered epidemic outbreaks, following the Serf ling’s criteria.24
| Table 1: Values predicted for the expected endemic cumulative monthly rate of malaria case reports per 100 inhabitants in Karuzi with the Upper Limit at 95% confidence for the epidemic threshold (Max) obtained by the forecasting model and the corresponding rates of monthly malaria cases reported during 1997-2002. |
|
Month
|
Expected |
Max |
Observed |
Month |
Expected |
Max |
Observed
|
|
Jan 1997
|
— |
— |
1.7 |
Jan 2000 |
6.6 |
7.5 |
7.9
|
|
Feb
|
1.3 |
2.3 |
1.6 |
Feb |
6.8 |
7.8 |
6.5
|
|
Mar
|
3.0 |
4.0 |
1.7 |
Mar |
7.4 |
8.4 |
4.2
|
|
Apr
|
2.7 |
3.7 |
2.2 |
Apr |
6.5 |
7.5 |
3.5
|
|
May
|
2.3 |
3.3 |
2.3 |
May |
5.8
|
6.8
|
6.5
|
|
Jun
|
3.3 |
4.3 |
3.8 |
Jun |
4.7 |
5.7
|
10.4
|
|
Jul
|
3.2 |
4.2 |
4.9 |
Jul |
4.8 |
5.8
|
6.8
|
|
Aug
|
3.6 |
4.6 |
2.1 |
Aug |
4.8 |
5.8
|
5.6
|
|
Sep
|
2.9 |
3.9 |
1.9 |
Sep |
4.8 |
5.8
|
5.4
|
|
Oct
|
4.2 |
5.2 |
2.3 |
Oct |
3.9 |
4.8
|
9.5
|
|
Nov
|
3.4 |
4.4 |
2.4 |
Nov |
3.2 |
4.2
|
41.6
|
|
Dec
|
4.6 |
5.6 |
2.8 |
Dec |
3.8 |
4.7
|
42.2
|
|
Jan 1998
|
4.0 |
5.0 |
2.7 |
Jan 2001 |
3.6 |
4.6
|
35.3
|
|
Feb
|
3.2 |
4.2 |
4.1 |
Feb |
4.0 |
5.0
|
24.4
|
|
Mar
|
4.3 |
5.3 |
4.1 |
Mar |
5.1 |
6.0
|
25.9
|
|
Apr
|
3.7 |
4.7 |
4.0 |
Apr |
5.7 |
6.6
|
13.2
|
|
May
|
4.0 |
5.0 |
2.3 |
May |
6.1 |
7.1
|
11.4
|
|
Jun
|
3.2 |
4.2 |
2.7 |
Jun |
5.6 |
6.6
|
7.7
|
|
Jul
|
3.7 |
4.7 |
2.4 |
Jul |
5.5 |
6.5
|
6.2
|
|
Aug
|
4.0 |
5.0 |
2.1 |
Aug |
6.1 |
7.1
|
6.0
|
|
Sep
|
4.2 |
5.1 |
2.8 |
Sep |
5.6 |
6.6
|
4.3
|
|
Oct
|
5.0 |
5.9 |
3.4 |
Oct |
6.2 |
7.1
|
5.0
|
|
Nov
|
4.2 |
5.2 |
4.3 |
Nov |
6.8
|
7.8
|
5.9
|
|
Dec
|
4.3 |
5.3 |
4.2 |
Dec |
5.5 |
6.5
|
6.0
|
|
Jan 1999
|
5.4 |
6.4 |
4.5 |
Jan 2002 |
5.7 |
6.7
|
8.4
|
|
Feb
|
4.8 |
5.8 |
3.8 |
Feb |
5.1 |
6.1
|
5.4
|
|
Mar
|
5.8 |
6.7 |
4.1 |
Mar |
5.5 |
6.5
|
5.2
|
|
Apr
|
4.9 |
5.9 |
2.2 |
Apr |
6.1 |
7.0
|
3.8
|
|
May
|
5.1 |
6.1 |
5.6 |
May |
5.1 |
6.0
|
4.4
|
|
Jun
|
5.1 |
6.1 |
9.4 |
Jun |
6.0 |
7.0
|
4.3
|
|
Jul
|
5.1 |
6.1 |
6.9 |
Jul |
5.8 |
6.8
|
4.3
|
|
Aug
|
5.1 |
6.0 |
4.4 |
Aug |
5.6 |
6.6
|
3.1
|
|
Sep
|
6.0 |
7.0 |
5.7 |
Sep |
5.5 |
6.5
|
4.1
|
|
Oct
|
5.8 |
6.8 |
7.6 |
Oct |
5.3 |
6.3
|
4.7
|
|
Nov
|
6.6 |
7.6 |
8.9 |
Nov |
5.9 |
6.9
|
3.2
|
|
Dec
|
6.1 |
7.1 |
8.1 |
Dec |
6.6 |
7.6
|
3.2
|
Figure 3: Expected and observed values for the Monthly Malaria Notification Rate (MMNR) per 100 inhabitants in Karuzi, Burundi, from January 1997 to December 2002. The upper and lower limits of the expected values are estimated for a 95% confidence endemic threshold.
The epidemiologic threshold predicted for the cumulative rate of malaria monthly reports for 2003, with its 95% threshold, is shown in Figure 4 and in Table 2. A change in the trend in the observed rate can be seen beginning in November 2003, with a more than 60% reduction with respect to the preceding month, which can be attributed to the health intervention that began in October of that year.22 This unusual decline in the months of November and December 2003 is captured by the lower threshold of the epidemiologic threshold obtained with the model, which reflects chance fluctuation in the rate.
Figure 4: Expected and observed values for the Monthly Malaria Notification Rate per 100 inhabitants (MMNR) in Karuzi, Burundi in 2003. The Upper and Lower Limits of the expected values are estimated for a 95% confidence epidemiologic threshold.
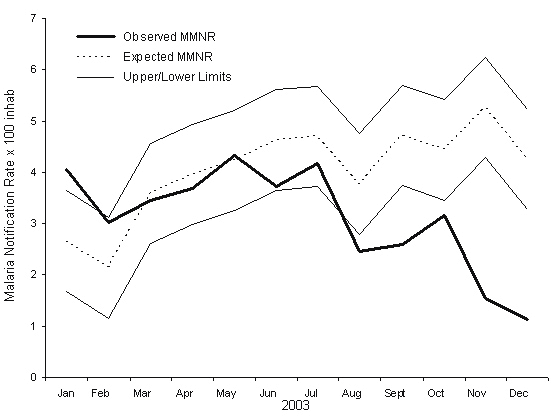
Table 2. Endemic values predicted for the expected cumulative monthly rate of malaria case reports per 100 population in Karuzi in 2003 according to the forecasting model, with the upper and lower 95% confidence limits of the epidemiologic threshold and the observed values for the period.
|
Month (2003)
|
Threshold Lower Limit |
Expected |
Threshold Upper Limit |
Observed
|
|
January
|
1.6 |
2.6 |
3.6 |
4.0 |
| February |
1.1 |
2.1 |
3.1 |
3.0
|
|
March
|
2.6 |
3.5 |
4.5 |
3.4 |
| April |
2.9 |
3.9 |
4.9 |
3.6
|
|
May
|
3.2 |
4.2 |
5.2 |
4.3 |
| June |
3.6 |
4.6 |
5.6 |
3.7
|
|
July
|
3.7 |
4.7 |
5.6 |
4.1 |
| August |
2.7 |
3.7 |
4.7 |
2.7
|
|
September
|
3.7 |
4.7 |
5.7 |
2.6 |
| October |
3.4 |
4.4 |
5.4 |
3.1
|
|
November
|
4.2 |
5.2 |
6.2 |
1.5 |
| December |
3.2 |
4.2 |
5.2 |
1.1
|
DISCUSSION
In this work we propose a tool for malaria surveillance that is simple in conception and easy to use in defining and detecting malaria epidemics, and to evaluate the impact of the measures for their control. Direct information about variables related to the intensity of malaria transmission, as anopheline density in relation to man, about the probability of mosquito survival or about the duration of the extrinsic cycle of the parasite in the mosquito is not available nor information regarding the state of the human population reservoir. This tool makes it possible to forecast an epidemiologic threshold for the cumulative monthly consultations rate of malaria for one year period based on the values preceding months and on the combination of temperature, rainfall and vegetation data observed in the preceding months. The estimation of the epidemiologic threshold with our model is based on the hypothesis that the malaria incidence rate is an estimator of the volume of the parasite reservoir in the human population, while rainfall, temperature and vegetation density are an estimator of vector transmission capacity.
Different methods for the definition and early detection of malaria epidemics, such as those proposed by Cullen25, Najera26 and CDC,27 use the monthly mean and median with their confidence intervals for preceding years, with a minimum of 5 years required, to identify an excess of reported cases. An evaluation of these methods in Kenya raises considerable doubts about their precision: their sensitivity and transparency are reduced when rates are transformed into logarithms; alert thresholds are established based on small samples (n=5) for which standard deviations are calculated; and they arbitrarily exclude “epidemic years” in these samples.10-11 From our point of view, moreover, these techniques do not consider the influence of an environmental component reflecting parasite and vector conditions that may result in increased malaria transmission due to climatic variations.
Our model for estimating the endemic, non-epidemic, threshold offers an explanation for much of the variability observed in the malaria rate. Its reliability was shown by the ability to identify four empirically-defined epidemics in 1997- 2002 and to detect the impact of a control program in 2003. It could generally be said that the expected incidence threshold through which the malaria consultations rate in Karuzi should pass between 1997 and 2003 is a theoretical representation of how this variable would behave, beginning with a particular initial number, given the influence of the environmental factors observed in that period. This implies that fluctuations in the incidence rate “outside” this threshold are not due to important variations in these climatic factors, but to factors related with other types of events that also determine the triggering and magnitude of malaria epidemics. Thus, for the same area and time period, Checchi have suggested as triggering factors for malaria epidemics: i) armed civil conflict with the consequent displacement of the non-immune population, and ii) the progressive expansion of rice cultivation in the valleys of central Burundi.28 This would explain why the expected rate in our model for the months of the large epidemic between October 2000 and June 2001 is lower than the expected rate for preceding months, so that the model would be able to detect epidemics that are produced mainly by increased transmission related with human activity rather than climatic variability. The same thing occurs with the identification in the model of an important decrease in the observed rate in the months of November and December 2003, when the previously mentioned health intervention was carried out. Again, a reduction in the base rate of reproduction, or mean number of secondary infections produced from a single infected individual, would lead to an incidence rate much lower than expected by the model, by reducing the population reservoir of gametocytes as a result of treatment with artemisinin derivatives, and not because of the influence of climatic variables.
The proposed model for the detection of epidemic events in this area can be evaluated using the CDC criteria for evaluating surveillance systems.27 That is, a) simplicity: health units routinely report malaria cases to the provincial office of the Ministry of Health; rigorous and ongoing collection of rainfall and temperature data which are relayed to the area epidemiologist; collection of vegetation data is not complex for a person with minimum training; channels for the flow of information are well established and have been improved; and the expected endemic threshold obtained for the province can easily be computed by putting all the components into the model; b) flexibility: Since the system is based on a computer program, it would be flexible enough to include changes in data collection that may occur among the different actors involved; c) acceptability: the malaria epidemic detection system would clearly be accepted since the persons involved in the process understand the repercussions of these events in their area; d) sensitivity: confirmation of cases by serological testing increases specificity, but not sensitivity; in contrast, using reports of suspected malaria cases would detect epidemics with higher sensitivity, albeit with a higher number of “false positives”; e) Positive Predictive Value (PVP): this system may detect epidemics that are not true epidemics, but if we use Serfling’s criteria,24 considering at least two consecutive months with an incidence above the established threshold, the PVP of the system increases considerably since this area is prone to malaria epidemics; f) representativeness: this may be limited when using reports of consultations for suspected malaria instead of microbiological confirmation; what is most important, however, is the historic stability of this form of reporting or notification that may be affected during period of conflicts or other issues outside the scope of the model; and g) timeliness: a limitation of the model is the minimum surveillance period it offers for the detection of epidemics but, as occurs in most epidemiological surveillance systems in rural areas of Africa, it is very difficult to obtain weekly reports of malaria cases that would permit earlier alerts. With appropriate changes in the forecasting model, the same methodology could be used with weekly cumulated reporting rates, and this approach would improve the timeliness of the epidemic early warning if this data would be obtained by the surveillance system of Burundi.
The combination of two modeling tools to predict malaria endemic-epidemic incidence rates, the described in this work for endemic, and another previously published for epidemic forecasting29 offers a complete surveillance system for detection and development prediction of malaria epidemics and the evaluation of control measures. Thus, the model establishing endemic thresholds makes it possible to know when an epidemic took place, at which time the epidemic forecasting model can be applied to estimate its magnitude and plan the type and intensity of control measures. Finally, the results of these measures can be evaluated using the expected endemic thresholds.
The design and development of these types of models constitute one more tool—and not the only on—in what should be an appropriate and balanced policy for preventive action in areas prone to malaria epidemics. Because the multifactorial nature of these epidemics makes them difficult to detect, Malaria Early Warning Systems are needed that take into account variables related with climate, environment and population susceptibility.14 With regard to the latter point, these Malaria Early Warning Systems should include components that go from rigorous and timely epidemiological surveillance and improved access to health services with adequate diagnostic and therapeutic measures, to monitoring the factors that may affect waning individual immunity, i.e. movements of the non-immune population or malnutrition.
Our model would need to be tested and evaluated before being proposed as an operational tool for malaria surveillance. Meanwhile, our research continues to focus on these techniques and their refinement in order to be able to define precisely when an excess of reported cases is a true malaria epidemic. Early warning of such epidemics would make allow time on time implementation of activities to reduce the suffering caused by these events. We can conclude that the application of this methodological tool permits the timely detection of malaria epidemics and the evaluation of the impact of measures for its prevention and control.
CONFLICTS OF INTEREST
The authors declare that they have no conflicts of interest.


