INTRODUCTION
Lung cancer is the most common cancer and leading cause of death from cancer in Canada. Lung cancer represented 14% (26,600) of all new cancers diagnosed in Canada and accounted for 27% (20,900) deaths in 2015. This results in the death of 57 Canadians every day and the numbers will continue to rise with the aging population. Non-Small Cell Lung Cancer (NSCLC) constitutes 85-90% of all lung cancers.1
Therapeutic options for many cancers, including advanced lung cancer, are generally limited to chemotherapies, for which response rates are typically 20-30% with only modest increases (3-5 months) in Progression-Free Survival (PFS). In contrast, personalized therapy based on patients genotypes offer much higher response rates (approximately 75%), longer PFS (9-13 months) and fewer side effects. Between 3-11% of patients have activating mutations caused by various rearrangements in the Anaplastic Lymphoma Kinase (ALK) gene, which are targetable by the tyrosine kinase inhibitor, crizotinib (Pfizer, PF-02341066).2 Additional second and third-generation ALK inhibitors are approved or in development such as ceritinib (Novartis), alectinib (Roche-GenenTech), lorlatinib (Pfizer), brigatinib (Ariad), entrectinib (Ignyta). Identifying patients with ALK rearrangements is currently expensive, time-consuming and subject to misinterpretation.3
Accurate diagnosis and selection of targeted therapies in lung cancer depends on robust detection of the molecular events that underlie its pathogenesis. It is known that patients having an activating mutation (rearrangement) in the ALK gene respond better to treatment with crizotinib (a tyrosine kinase inhibitor) than lung cancer patients with other etiologies of the disease. Therefore, identifying patients with ALK mutations becomes a prerequisite to successful and efficient treatment of lung cancer. The most common rearrangement of the ALK gene in NSCLC involves fusion with echinoderm microtubule-associated protein-like 4 (EML4) as the upstream partner.4 There are many known variants of EML4-ALK fusions depending on which EML4-exon is fused with ALK exon 20.4,5,6 For example, in the variant 1 EML4 exon 13 is fused with the ALK exon 20 (E13:A20) and in the variant 7 EML4 exon 14 is fused with ALK exon 20 (E14:A20). Other known upstream partner genes that are fused with the ALK gene in NSCLC are TFG,7 KIF5B8,9 and KLC1.10 However, the existing methods that detect only specific, e.g. EML4-ALK translocations or those with known upstream fusion genes, are of limited scope.
The current testing methods for the EML4-ALK rearrangement are immunohistochemistry (IHC)11,12,13 and/or Fluorescence In Situ Hybridization (FISH) using the Vysis Break Apart Probe.14 These tests use a solid tissue biopsy and can be very subjective due to high operator variability. They require expert interpretation by a pathologist and have a long turnaround time (TAT). The ALK IHC test, which measures expression of protein, is only semi-quantitative. The staining intensity score (1-4) that is used to determine ALK-positive or negative samples,varies depending on the fusion points (EML-ALK) and the promotor strength of the upstream partner. An upstream partner of similar promotor strength as ALK would give a negative result by IHC but positive result by FISH. In contrast, epigenetic changes in the promotor region may also cause higher expression of an unrearranged ALK gene resulting in positive IHC but negative FISH. The FDA-approved FISH test has been shown to lack sensitivity and is generally acknowledged to fail to detect rearrangements in up to 60% of patients.15,16 The FISH test also fails to identify cases where epigenetic change may cause upregulation of an unrearranged ALK gene.
Reverse Transcriptase-Polymerase Chain Reaction (RT-PCR) methods allow the detection of gene rearrangements using RNA extracted from a patient’s tumor.4,5,6 They have been shown to be more accurate in determining rearranged ALK compared to FISH,17 enable rapid processing and are highly specific for particular rearrangements depending on the primers used, but will not detect unknown rearrangements. Here, we have adapted a method described by Wang et al18 and optimized it for use with degraded RNA obtained from Formalin-Fixed Paraffin-Embedded (FFPE) sections. This method is based on the unbalanced expression of 5’- and 3’-regions (exons) of the ALK gene. In the normal unrearranged ALK gene, the expression levels of both 5’- and 3’- exons are equal, whereas in the rearranged-ALK gene, expression of the 3’-region (kinase domain) is higher than that of the 5’-region. It is also notable that ALK-positive patients identified by RT-PCR and Next Generation Sequencing show similar responses to crizotinib as those identified by FISH.18,19
The robust and quantitative RT-PCR (qRT-PCR) method we have developed can detect unbalanced 5’-and 3’-exon expression indicative of ALK rearrangement. Since the primers used to amplify the exons are not based on specific fusion-points, the test detects all known and unknown variants and all upstream fusion partners of ALK can be determined by sequencing amplicons if necessary. In addition, the test can also identify high ALK-expressers that may be caused by epigenetic changes or mutations in the promoter region. This unbalanced 5’-and 3’-exon expression approach is also applicable for detection of other cancer-relevant gene rearrangements that result in increased expression of the 3’-kinase domain, e.g. ROS1 or RET. This is particularly relevant to patients with these rearrangements as they have been shown to respond to crizotinib20 and cabozantinib,21 respectively. This method is reproducible, quantitative, sensitive (to 1% positive cells), requires only 50-100 ng RNA, does not require highly trained personnel and can be performed in any clinical laboratory with access to a qPCR instrument. Here we present the protocol for the method and validation with 197 clinical samples.
MATERIAL AND METHODS
Clinical Samples and Cell Lines
Fifteen FFPE slides containing 2×10 µm sections from Canadian ALK (CALK) centers were provided by Dr. Ming Tsao, Department of Pathology, University Health Network, Princess Margaret Cancer Center and University of Toronto, ON, Canada. A second set of 182 specimens of 20 µm curls from FFPE sections were obtained from our tissue bank at the Nova Scotia Health Authority and Dalhousie University, Halifax, NS, Canada.
The lung adenocarcinoma cell line A 549 harboring the normal unrearranged ALK gene was obtained from the American Type Culture Collection and propagated as recommended. The lung adenocarcinoma cell line H3122 harboring a rearranged ALK gene (EML4 exon13: ALK exon20; ALK Variant 1) was a kind gift from Dr. Jeffrey Engelmann, Massachusetts General Hospital, Boston, MA, USA. The lung adenocarcinoma cell line HCC78 carrying the SLC34A2 exon4: ROS1 exon 32 fusion was obtained from Dr. John D. Minna, The University of Texas Southwestern Medical Center, Dallas, TX, USA. This study was approved by the Capital Health Research Ethics Board (CDHA-RS/2013-090) and all participating individuals signed inform consent.
Primers and Stock Preparation
Primers were designed to span exon-exon boundaries to minimize amplification from contaminating genomic DNA (Table 1, Suppl. Table 1). Primers were obtained from IDT (Coralville, IA, USA) and resuspended in RNase-free water to a working stock concentration of 10 µM.
| Table 1. List of primers used for ALK exon-expression assay. |
| Primer |
For/Rev |
Sequence (5’ > 3’) |
Amplicon Size (bp) |
| Assay optimization with cell lines |
| ALK-Ex-1 |
For |
GAGGCGATCTTGGAGGGTTG |
154 |
| ALK-Ex-1 |
Rev |
CCACTTCCGACGCCTTCTTC |
|
| ALK-Ex-29 |
For |
AAAGAAGGAGCCACACGACAG |
185 |
| ALK-Ex-29 |
Rev |
CGTAATTGACATTCCCACAAGG |
|
| GAPDH 102-F |
For |
CAAGATCATCAGCAATGCCT |
193 |
| GAPDH 192-R |
Rev |
CTCTCCAGAACATCATCCCT |
|
| Assay validation with clinical samples |
| ALK14-15-FP |
For |
GTGAACAGAAGCGTGCATGAG |
91 |
| ALK14-15-RP |
Rev |
GCACCGGCACTCCATCCTTC |
|
| ALK17-18-FP |
For |
CCACTGGGCATCCTGTACACC |
112 |
| ALK17-18-RP |
Rev |
CCATGTGACATTCGTCTACCTCAC |
|
| ALK22-23-FP |
For |
CCTGAAGTGTGCTCTGAACAGG |
87 |
| ALK22-23-RP |
Rev |
GCGAACAATGTTCTGGTGGTTG |
|
| GAP4-5-FP |
For |
GCCAAGGTCATCCATGACAAC |
92 |
| GAP4-5-RP |
Rev |
GGGCCATCCACAGTCTTCTG |
|
Total RNA Isolation
Tumor-containing tissue was scraped from FFPE slides (1×20 µm or 2×10 µm sections) into a 1.5 mL Eppendorf tube using a fresh scalpel blade treated with RNA-Zap (Ambion Inc., Austin, TX, USA). Deparaffinization was achieved by the addition of 1 mL xylene, vigorous vortexing for 10 s, and centrifugation at 14000 rpm for 2 min. The supernatant was carefully removed by pipetting without disturbing the pellet and the pellet washed with 1 mL 100% ethanol, vortexed, and centrifuged at 14000 rpm for 2-5 min. The supernatant was again removed by pipetting without disturbing the pellet and any residual ethanol was removed using a fine pipet tip. The tube was then incubated at room temperature (15-25 °C) or at 37 °C for 10 min or until all residual ethanol had evaporated. Care was taken that deparaffinization was complete and the tissue pellet was not over-dried preceding lysis.
Total RNA was extracted from FFPE sections using the RNeasy® FFPE Kit (Qiagen, Mississauga, ON, Canada) following the manufacturer’s instruction. Total RNA was eluted into 50 μL of RNase-free water. Total RNA from fresh cells was purified using the RNeasy® kit (Qiagen, Mississauga, ON, Canada) according to the manufacturer’s instructions. Human reference RNA was obtained from Life Technologies (Waltham, MA, USA). RNA concentration was determined using a NanoDrop-1000 (Nano Drop Technologies, Wilmington, DE, USA) and stored at -80 °C.
Reverse Transcription
Total RNA (500 ng), unless indicated otherwise, was reverse-transcribed using the Superscript III kit (Invitrogen, Burlington, ON, Canada) according to the manufacturer’s instruction. cDNA was used immediately for qPCR or stored frozen at -20°C.
RT-qPCR: qPCR reactions (10 µL) contained 5 µL 2X Kapa CybrFast qPCR mix (Kapa Biosystems, Boston, MA, USA), 10 pmol each of forward and reverse primers and 1 µL of undiluted cDNA. All reactions were performed in triplicate. The control cDNA was from the A549 cell line. The positive controls were cDNA from the ALK-positive H3122 cell line or the ROS1-positive HCC78 cell line. The negative control was RNase-free water.
qPCR was performed in a Light Cycler® 480 Real-Time PCR System (Roche Applied Science, Laval, QC, Canada) in 384-well plates according to the Kapa CybrFast qPCR kit cycling conditions (once at 95 °C for 3 min; 45 times at 95 °C for 20 sec, 60 °C for 20 sec, 72 °C for 20 sec) followed by melt-curve analysis.
DATA ANALYSIS
The raw data was exported from the Light Cycler-480 software and an average Ct was calculated for each triplicate reaction. Fold-change was calculated using ΔΔCt method22 as below:
ΔCt = Ct (Target A-Treated) – Ct (Ref B-Treated),
ΔCt = Ct (Target A-Control) – Ct (Ref B-Control),
Therefore, the fold-change for ALK exon14-15 using GAPDH as reference and A549 as control will be:
ΔΔCt = ΔCt (ALK exon14-15 FFPE – GAPDH FFPE) – ΔCt (ALK exon14-15A549– GAPDHA549)
The fold change = 2 (-ΔΔCt)
The ALK 14-15 exon served as the normalizer. Fold-change for the glyceraldehyde 3-phosphate dehydrogenase (GAPDH) exon 4-5 was used to assess the level of degradation of the FFPE-derived RNAs compared to the cell line controls. For validation set 1, fold-change of the ALK exon 22-23 was determined after normalization with the ALK exon 14-15 to identify ALK rearrangement-positive or -negative samples. For highly degraded FFPE samples (validation set 2), normalization with ALK exon 14-15 and/or 17-18 gave inconsistent results. This was mainly because of RNA degradation. In an unrearranged ALK gene, normalized expression values decrease from the 5’- to the 3’-end. However, in a rearranged ALK gene, expression of the 5’-exon will be higher than that of the middle exon, but expression of the 3’-exon will be higher than the middle despite the effect of RNA degradation. Therefore, GAPDH exon 4-5-normalized expression of ALK exon 14-15, 17-18 and 22-23 was used to determine ALK-positives. A sample was called positive when ALK exon 22-23 expression was higher than the ALK exon 17-18, which is at the 5’-position to the fusion point (ALK exon 20). The identity of the upstream fusion partner is not known; only the presence of a rearrangement resulting in up-regulation of the 3’ kinase domain of ALK is determined.
The utility of the exon-expression assay for the detection of the ROS1 gene fusion was demonstrated using HCC78 cell line containing the SLC34A2: ROS1 rearrangement. Primers designed for the ROS1 5’-end (exon 7 and 12) and ROS1 3’-end (exon 35 and 39) and GAPDH were used (Supplementary Table 1). Fold-change was derived as described above after normalization with GAPDH.
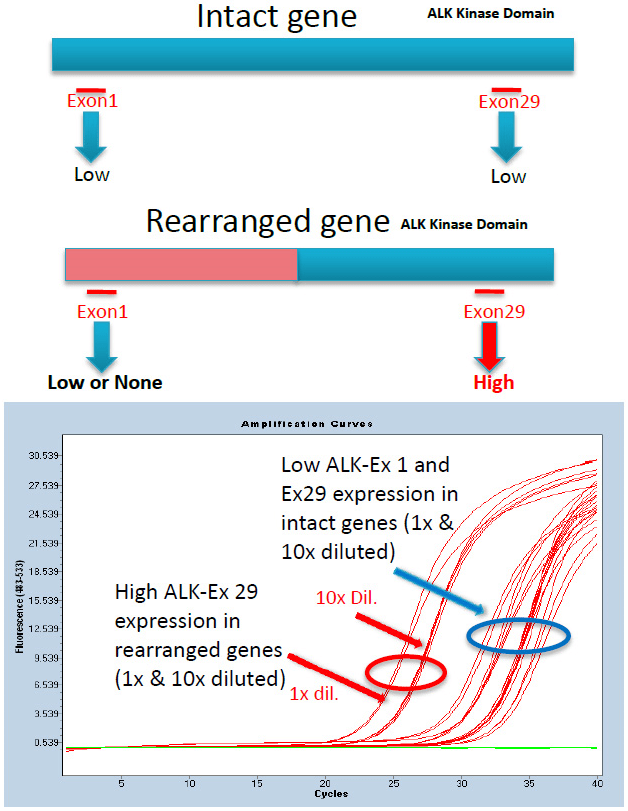
RESULTS AND DISCUSSION
As shown in Figure 1, expression of both 5’-exon 1 and 3’-exon 29 of intact ALK is similar and lower (higher Ct value; blue circle and arrow) compared to the 3’-exon 29 in a rearranged ALK (red arrows). The two groups of amplification curves in both groups are due to undiluted and 10-fold diluted starting template cDNA used in the qPCR reactions. Unbalanced expression is observed when the ALK gene is rearranged irrespective of the rearrangement partner or fusion points in the case of EML4-ALK variants. Therefore, the greatest advantage of this method is the ability to detect not only known but also unknown EML4-ALK variants as well as fusion with other known and unknown upstream partners (e.g. KIF5B, TFG, KLC1), which upon further study may prove sensitive to crizotinib. Identification of fusion points and upstream partner can be determined, if desired, by qPCR of each ALK-exon and sequencing of the amplicon containing the fusion partner.
Figure 1: ALK exon-expression assay for rearrangements. Amplification curves are shown for RNA isolated from cell lines containing unarranged and rearranged ALK genes as described in Material and Methods.
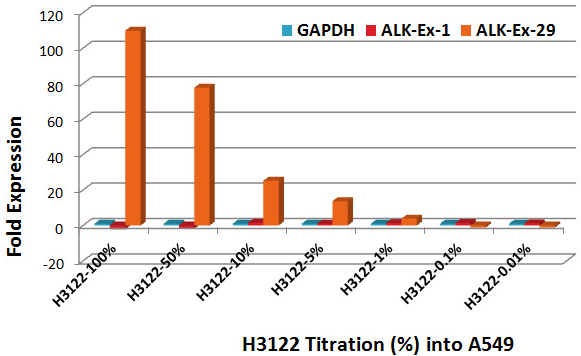
To determine the sensitivity of detection of the test, a titration was performed with the known EML4-ALK rearranged cell line H3122 into the A549 cell line containing the unrearranged ALK (Figure 2). ALK unbalanced 3’-exon29 expression can be detected with high confidence (p-value 0.0025) with as few as 1% H3122 cells in A549 background. In contrast, since tumors are heterogeneous, FISH-positive cell count variations are inherent.23 For example, 5-95% FISH-positive cells were scored for the sample CALK-FFPE-11 by 2 individual operators at twelve centers. The accepted cutoff value is 15% FISH positive cells. This sample was confirmed negative for ALK rearrangement using RT-PCR method (Table 2). However, in RNA extracted from a 10-20 µm FFPE section, all RNA species are available for detection by qPCR, and RNA contributed by as little as 1% ALK-positive cells is detected.
Figure 2: Determination of sensitivity of detection of rearranged ALK gene by dilution. H3122 RNA (EML13:ALK20) was diluted into A549 (intact ALK). All p-values for assays down to 1% H3122 RNA were 0-0.0025.
| Table 2: Validation of ALK exon expression assay using clinical FFPE samples from CALK centers. Fold change of GAPDH represents the amount of RNA degradation compared to H3122 cell line RNA, which is relatively intact (-1.32). Fold change of ALK represents the expression of the 3’-exon22-23 relative to the 5’-exon17-18 after normalization with ALK exon14-15 as described in the Materials and Methods. ALK positive tumors have a fold change of greater than 2 with a p-value <0.05. N/A, FISH test was not performed. |
|
ALK Exon-Expression qRT-PCR |
|
FISH* |
| Sample Name |
GAPDH |
ALK– 3’-exon |
Positive / Negative |
FISH- % Positive cellsa |
Positive / Negative |
| Fold Change |
p value |
Fold Change |
p value |
| H3122 (Pos. Ctr.) |
-1.32 |
0.009 |
219.79 |
0.0000 |
Positive |
N/A |
N/A |
| CALK-FFPE-1 |
-49.52 |
0.00029 |
14.12 |
0.015 |
Positive |
50-99 |
Positive |
| CALK-FFPE-4 |
-134.67 |
0.00002 |
4.42 |
0.000328 |
Positive |
25-70 |
Positive |
| CALK-FFPE-7 |
-29.31 |
0.000028 |
4.84 |
0.00007 |
Positive |
15-80 |
Positive |
| CALK-FFPE-8b |
-105.17 |
0.000025 |
2.25 |
0.0381 |
Positive |
24-70 |
Positive |
| CALK-FFPE-9 |
-27.22 |
0.00002 |
2.54 |
0.236 |
Negative |
0-5 |
Negative |
| CALK-FFPE-10 |
-171.65 |
0.000025 |
2.8 |
0.0053 |
Positive |
5-75 |
Positive |
| CALK-FFPE-11 |
-15.17 |
0.000047 |
1.92 |
0.1427 |
Negative |
5-95 |
Negative |
| CALK-FFPE-12 |
-2.68 |
0.00165 |
240.51 |
0.000004 |
Positive |
25-90 |
Positive |
| CALK-FFPE-13 |
-130.99 |
0.000025 |
1.45 |
0.19844 |
Negative |
5-12 |
Negative |
| CALK-FFPE-14 |
-30.69 |
0.000028 |
1.47 |
0.126358 |
Negative |
5-10 |
Negative |
| CALK-FFPE-15c |
-434.54 |
0.000024 |
-1.25 |
0.22542 |
Negative |
10-60 |
Positive |
| CALK-FFPE-17 |
-88.85 |
0.000025 |
14.16 |
0.000051 |
Positive |
20-90 |
Positive |
| CALK-FFPE-19 |
-33.2051 |
0.000304 |
58.35 |
0.000005 |
Positive |
30-90 |
Positive |
| CALK-FFPE-23 |
-168.89 |
0.000025 |
2.32 |
0.077846 |
Negative |
5-10 |
Negative |
| CALK-FFPE-27 |
-123.06 |
0.000025 |
5.72 |
0.000759 |
Positive |
15-60 |
Positive |
| CDHA-A4d |
-23.16 |
0.00032 |
16.45 |
0.000212 |
Positive |
N/A |
N/A |
| CDHA-C-1d |
-6.96 |
0.000491 |
43.31 |
0.0023 |
Positive |
N/A |
N/A |
Note: A549 Negative control and reference sample; H3122-ALK Positive control sample
a: Distribution of % abnormal ALK signals from 200 nuclei counted by 2 technologist from 12 Centers
b: only 160ng RNA available for RT
c: FFPE section was very bloody; GAPDH >400-fold degraded
d: Known Positive FFPE from Dr Zhaolin Xu*: From Reference17 |
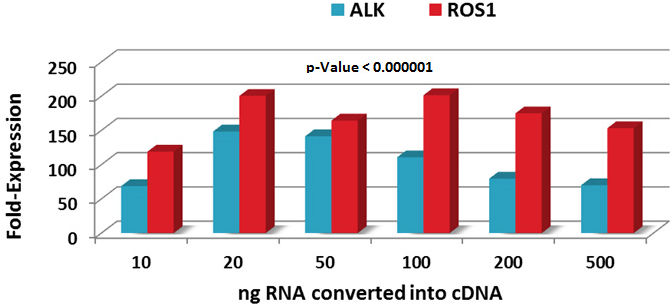
Due to the limited availability of patients’ FFPE samples together with limited amounts of total RNA available after purification, a titration experiment was performed to determine the minimal amounts of RNA required for cDNA conversion prior to qPCR. Most reverse transcription kit protocols suggest using 500-1000 ng total RNA for cDNA synthesis. We converted 10-500 ng total RNA into cDNA and evaluated unbalanced exon-expression using H3122 and HCC78 cell lines harboring rearranged ALK and ROS1, respectively (Figure 3). Total RNA amounts from 10-500 ng showed >50-fold higher 3’-end expression compared to the 5’-end with very high confidence (p-value 0.000001). However, total amounts of 20-100 ng RNA converted into cDNA provided optimal performance. This demonstrates an additional advantage of this method where a single 10 µm FFPE section or a very small biopsy sample may be sufficient to determine rearranged ALK and/or ROS1 gene.
Figure 3: Determination of sensitivity of detection of rearranged ALK and ROS1 genes. Decreasing amounts of total RNA were used in the assay as described in the Materials and Methods.
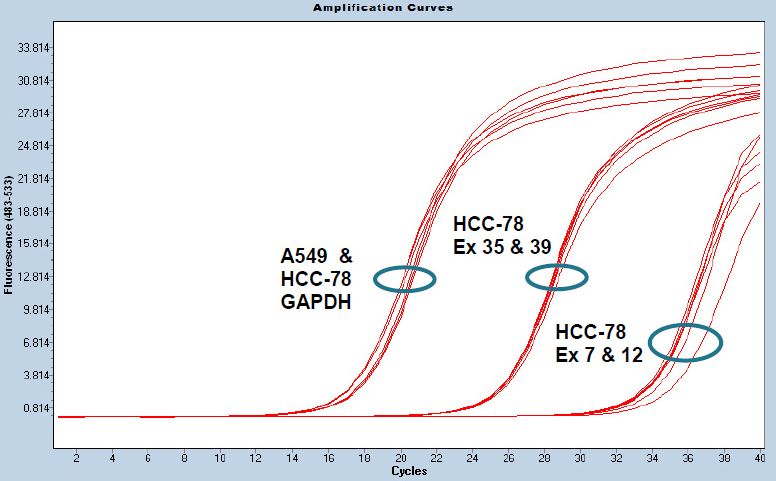
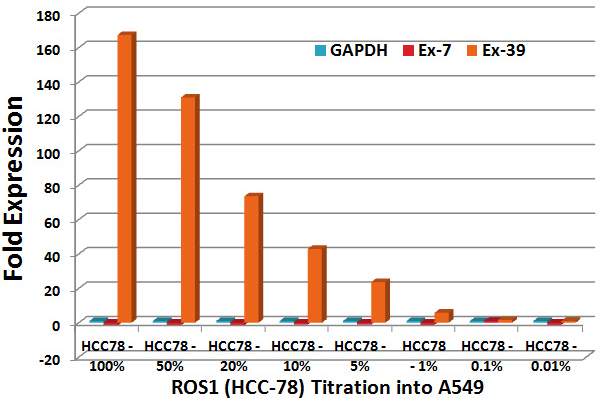
The ROS1 5’-end exons (7 and 9) have a higher Ct value (lower expression) compared to ROS1 3’-end exons (35 and 39) in HCC78 cell line (Supplementary Figure 1). As expected, expression of the housekeeping gene GAPDH is similar in the A549 cell line containing intact ROS1 gene and HCC78. The sensitivity of the ROS1 exon-expression assay was determined by titration of HCC78 RNA into A549 RNA (Supplementary Figure 2). As little as 1% HCC78 RNA in A549 RNA was detectable (p-value 0.000001). Validation of the ROS1 exon-expression assay was not performed due to unavailability of clinical samples.
The ALK exon-expression assay was validated in a blinded manner using 15 FFPE samples from NSCLC patients from CALK centers (Validation set 1). Two known positive FFPE samples were also included. We were unable to obtain amplification using ALK exon1 and ALK exon29 and GAPDH 102F and 192 R primers (Table 1), indicating that RNA from FFPE samples was degraded to sizes smaller than these amplicons (154-193 bp). To address this, new exon-exon spanning primers for ALK exons 14-15, 17-18 and 22-23 were designed that generated smaller amplicons (87-112 bp; Table 1). The ALK exon 14-15 was used to normalize and determine relative expression of ALK exon 17-18 and ALK exon 22-23 and also to determine the amount of RNA degradation in FFPE samples compared to cell line RNA. H3122 RNA exhibited no degradation (fold-change of -1) whereas FFPE RNAs showed varying amounts of degradation (Table 2). Samples that had >2-fold higher expression of 3’-exon 22-23 and a p-value 0.05 or lower were scored as ALK-positive. Of the 15 CALK samples, 14 were concordant with FISH results (Table 2). CALK-FFPE-11 was ALK-negative using the exon-expression assay. Interestingly, this sample showed very high variability by FISH (5-95% cells FISH-positive as scored by two technologists at 12 centers) but was called negative when subsequently tested by RT-PCR17 in agreement with our results (Table 2). Similar heterogeneity in FISH results has been reported previously.23 CALK-FFPE-15 exon-expression assay results were not concordant with the FISH results; this is probably because the FFPE section for this sample was very bloody and also showed a very high level of RNA degradation (GAPDH fold-change; -434-fold), making it impossible to assess with certainty.
A second set of 182 validation samples were single 20 µM curls (Validation set 2). Good concordance was seen between the exon-expression assay and FISH. Similar to Validation set 1, A549 and H3122 cells were used as negative and positive controls and relative GAPDH expression was used to assess RNA degradation in the FFPE samples. Table 3 shows the results of six samples that had equivocal results. These samples showed varying and high levels of RNA degradation when compared with cell line RNA (Table 3). When RNA is highly degraded, the accuracy to assess fold-changes between 5’-end and 3’-end expression by ΔΔCt method is compromised. However, the test still yields a result and can be confirmed with IHC and/or FISH. Degradation of any transcript starts from the 3’-end and proceeds towards the 5’-end which is capped to prevent degradation. Sample RE-12-04 T RNA showed RNA degradation of >500-fold and did not clearly show >2-fold change with high confidence when normalized with ALK exon 14-15/ 17-18. However, GAPDH-normalized expression values (284 for exon 22-23 compared to 156 for exon 17-18) indicated that this sample is ALK-positive (p-value<0.05; Table 3). Similarly, sample RE-12-04 AB showed ~185-fold degradation of RNA and only 2.3-fold higher expression of 3’-end ALK with p-value 0.09 when normalized with ALK exon14-15/17-18. Again, GAPDH-normalized expression (312 for exon 22-23 compared to 100 for exon 17-18) suggests this sample is ALK-positive (p-value <0.01; Table 3). Both RE-12-04 T and RE-12-04 AB samples were ALK-positive by the FISH test with 48-74% and 56-80% abnormal cells, respectively (Table 3).
| Table 3: Results of ALK exon-expression assay for Validation set 2 samples. Fold change of GAPDH exon4-5 represents the amount of RNA degradation compared to H3122 cell line RNA, which is relatively intact (-1.32). ALK-positive tumors have a fold change >2 with a p-value <0.05 (shown in red). For GAPDH exon4-5 normalized data, ALK positive tumors have higher fold change for ALK 3’-exon22-23 relative to ALK 5’-exon17-18 with a p-value <0.05 (shown in red). qPCR results are scored positive (Pos.) or Negative (Neg.) and concordance with FISH result is scored YES or NO. |
| Sample Name |
FISH |
ALK Exon-Expression by qRT-PCR (ALK exon14-15 and 17-18 normalizer) |
Concordance with FISH |
ALK Exon-Expression by qRT-PCR (GAPDH exon4-5 normalizer) |
Concordance with FISH |
| % Abnormal cells |
FISH results -NSHA |
GAPDH Exon 4-5 |
ALK Exon 22-23 |
Result qPCR method |
ALK Exon 14-15 |
ALK Exon 17-18 |
ALK Exon 22-23 |
Result qPCR method |
|
Read 1 |
Read 2 |
Read 3 |
Read 4 |
Read 5 |
Fold-Change |
p value |
Fold-Change |
p value |
Fold-Change |
p value |
Fold-Change |
p value |
Fold-Change |
p value |
| RE-12-04 T |
48% |
74% |
NA |
NA |
NA |
Pos. |
-513.00 |
0.0008 |
-1.01 |
0.8963 |
Neg. |
NO |
299.55 |
0.0003 |
156.50 |
0.0170 |
284.05 |
0.0154 |
Pos. |
YES |
| RE-12-04 AB |
56% |
80% |
NA |
NA |
NA |
Pos. |
-185.00 |
0.0013 |
2.29 |
0.0900 |
Neg. |
NO |
185.25 |
0.0000 |
99.96 |
0.0000 |
312.27 |
0.0169 |
Pos. |
YES |
| RE-12-04 BL |
9% |
14% |
1% |
34% |
NA |
Neg. |
-2.50 |
0.0311 |
3.54 |
0.0178 |
Pos. |
NO |
2.50 |
0.0124 |
-2.85 |
0.0003 |
3.33 |
0.0064 |
Pos. |
NO |
| RE-12-04 W |
8% |
4% |
9% |
16% |
NA |
Neg. |
-316.00 |
0.0008 |
2.68 |
0.0130 |
Pos. |
NO |
135.92 |
0.0310 |
41.45 |
0.2410 |
54.06 |
0.0012 |
Pos. |
NO |
| RE-12-04 BV |
41% |
36% |
4% |
6% |
26% |
Neg.a |
-3.56 |
0.0035 |
2.02 |
0.0195 |
Pos. |
NO |
9.36 |
0.0017 |
1.33 |
0.0074 |
7.11 |
0.0005 |
Pos. |
NO |
| RE-12-05 AU |
15% |
18% |
8% |
8% |
12% |
Neg.a |
-72.58 |
0.0010 |
1.56 |
0.4207 |
Neg. |
NO |
74.88 |
0.0461 |
70.36 |
0.0080 |
113.50 |
0.0042 |
Pos. |
NO |
| aAdditional confirmatory FISH test performed at CALK center Toronto. This was also scored as Negative. |
Sample RE-12-04-BL was positive by exon-expression assay using both normalization methods (Table 3). This sample was negative by FISH even though average of the 4 reads is ~15% abnormal cells. Two other samples, RE-12-04-W and RE-12-04-BV were also positive with both normalization methods. However, these samples were negative by the FISH with positive cell counts of 9±5% and 23±16% (average±standard deviation), respectively (Table 3). Sample RE-12-05-AU was found positive by using GAPDH as normalizer (113.5 for exon 22-23 compared to 70.36 for exon 17-18) but not when exon 14-15/17-18 was used. This sample was negative by the FISH test with 12±5% counted as FISH-positive (Table 3). It is possible that an epigenetic modification of the ALK gene or a rearrangement that alters FISH probe binding would not be detected by FISH and caused relative up-regulation of exon 22-23 in this tumor.
Clearly, the sensitivity of the assay depends on the quality of the RNA. As seen for the validation samples, high levels of RNA degradation can lead to a decrease in the ability to determine ALK-positivity by the exon-expression assay. Therefore, we compared the RNA quality from ten representative FFPE samples and RNA isolated from a fresh-frozen lung tumor sample and a commercially available human reference RNA. We used a qPCR method measuring 93bp and 193bp amplicons of the highly expressed housekeeping gene, GAPDH. Average Ct values of three replicates for both amplicons are shown in Suppl. Table 2. The Ct values for both amplicons from fresh-frozen lung tumor and reference human RNA are similar and lower, indicating little or no degradation of RNA, whereas RNA from all FFPE samples showed 10-15 Ct value higher or not even detectable (Ct>35). This translates into 1000-100,000-fold degradation of RNA obtained from FFPE samples compared to fresh-frozen samples. Such samples may necessitate confirmation with another method.
CONCLUSION
The qPCR-based exon-expression assay we have developed is demonstrably objective, robust and sensitive for the detection of rearranged ALK genes when compared to FISH and IHC. As shown by our preliminary results with ROS1, this method also shows great promise as generalized test for rearranged genes implicated in various kinds of cancer. This is particularly relevant since ROS1-positive patients also respond to crizotinib. Since detection of rearranged genes in patient samples uses RNA, the sensitivity and robustness of this test is compromised when RNA is highly degraded, and can result in false-negative calls. We have observed this phenomenon with two sets of validation FFPE samples showing high degrees of RNA degradation. However, fresh patient samples may have less RNA degradation, which would minimize false-negative calls; therefore, we highly recommend using fresh-frozen or RNA Later-preserved biopsies for this assay.
ACKNOWLEDGEMENTS
This work was supported by the National Research Council of Canada and an unrestricted grant from Pfizer Inc. We gratefully acknowledge support from Dr. Ming Tsao, CALK center, University of Toronto, Ontario, Canada for providing clinical samples for validation set 1. Authors also acknowledge technical and bioinformatics support from Dr. Evelyn Teh and Susanne Penny. This is publication NRC-HHT-53325.
CONFLICTS OF INTEREST
The authors declare that they have no conflicts of interest.