INTRODUCTION
Considering the current increasing aging population, understanding of elderly individual’s body composition, well-being and health promoting and damaging behaviors are important.2 After retirement people are generally more sedentary, resulting excess calories intake, making them prone to degenerative diseases and obesity.2 As a consequence of aging populations, countries need to define policies to reduce their burden on society. Promotion of research providing policymakers with data on the needs of their aging population is the main objective of the World Health Organisation’s (WHO’s) International Aging Programme.3
Body Composition in the Elderly Population
With age, it is suggested that body composition changes, altering the percentage of fat, bone, water and muscle within the human body.4 Sarcopenia (the loss of skeletal muscle mass and strength through ageing) and increasing body fat are trademarks of the aging process.5 The percentage of fat-mass increases, the percentage of fat-free mass decreases, and muscle strength decreases.6 Kvell et al7 claimed that body weight increases gradually by 8-9 kg until 45-55 (this is predominantly an increase in fat-mass with maintained muscle-mass), then after stagnation until the age of 65-75, a decline (1-2 kg/decade) in all tissue types is seen without any apparent cause e.g. a fat loss diet. During this period fat-mass is decreased somewhat, but the loss of muscle mass is dominant. Furthermore, it has been suggested by Cook et al8 that between twenty and seventy years of age, human stature plateaus then slowly decreases in both males and females because of senile kyphosis, shortening of the spinal vertebrae and thinning of weight bearing cartilages. Therefore understanding patterns of body composition change and the factors that influence it will assist appropriately timed and effective strategies to optimise body composition for health and function in the elderly, while promoting well-being.5
Body Mass Index of elderly participants
Body mass index (BMI) is an index of body mass-for-height, commonly used to classify obesity and under nutrition in various populations. Tables of normative values give little credibility to the widespread variation between individuals. However, comparisons are often made between the individual and a population. The norms used are derived from different ethnic and geographical data or historical population statistics, and the values will vary considerably depending on age, gender and ethnicity.9 With this in mind, it can be argued that BMI is not an appropriate tool for use with individuals or in populations for whom body composition may be different from that of healthy younger adults, such as elderly participants.
There has been an increase in average stature and body mass over recent generations and with physiological changes, equipment variability and observer error can lead to BMI measurement inaccuracy with elderly samples.9 The practicality of such a measure is also questionable when considering elderly individuals. If stature and body mass measurements are requested in care home or inpatient settings, they frequently are not carried out because of work pressures, the practicalities of measuring stature on the non-ambulatory or unwell older participant or the lack of equipment. Aging populations can struggle to stand up straight or attain good positioning in order to take measures due to poor joint movement and inability to fully extend limbs and spine. Professionals can often rely on self-reporting of adult stature because of a lack of staff or difficulty measuring ill or immobile patients. However, it has been shown that stature is often over-reported and body mass is often under-reported and, if translated to BMI, this discrepancy would give an inaccurate value.10
Hughes et al11 used stature collected in the elderly to calculate BMI in elderly participants aiming to minimise the limitations of body composition changes with age and the immobility of participants. However, the use of an historic stature and a current stature in the same individual provided a different BMI reading. These two measurements are different and so clarification is required on the appropriate stature measurement to select in this population. These practical limitations have also been encountered in larger-scale studies in older participants.12 This challenges the view of the Malnutrition Advisory Group (British Association for Parenteral and Enteral Nutrition Malnutrition Advisory Group, 2000) that BMI is a simple and reproducible measure for assessing malnutrition in older participants.
Further development of appropriate reference ranges for body mass could be established for older participants. These reference ranges could be regularly updated to reflect changing population trends, as data are collected at 10-yearly intervals. Until reference ranges based on such data are defined, it is recommended that acceptable minimum-maximum body mass values be adopted in practice.13 Evidence from practice, and literature searches, does not support the use of BMI when assessing under nutrition in older participants. Disease history and physical changes, including body mass measurement where possible, need to be considered.
Despite disadvantages of undertaking BMI, such as measure error and the little credibility it gives to the variation between individuals, BMI methodology remains well established universal practice that provides simple, low cost and easily comparable data. When taking elderly body composition measures, BMI the practicality of measures is less invasive and more feasible than alternative option, such as hydrostatic weighing.14 Until more advanced, yet still feasible protocol to easily measure participants body composition at low cost arises, gathering stretched stature and body mass measures to calculate an elderly individual’s BMI seems appropriate.
METHODS
Participants and Recruitment
A convenience sample of twenty participants was obtained via letter invitations to Gloucester, UK elderly people’s care homes, which consisted of eight females (x±s; age=75.38±9.58 years; stretched stature=1.60±0.06 m; body mass=69.54±13.30 kg) and twelve males (x±s; age=73.75±6.90 years; stretched stature=1.68±0.07 m; body mass=79.46±9.07 kg). Each participant was informed as to the nature of the study, and provided with an information cover sheet outlining the data collection process in a clear manner. Consent was then secured with a participant signature. Participants had the right to withdraw their data at any given time of the study and anonymity ensured with all participants’ number coded. Confidentiality was ensured with data accessed electronically via a password protected laptop.
Data Collection
Body mass index (BMI) can only be measured quantitatively through acquisition of participants stretched stature and body mass. Although minimal clothing is desired whilst undertaking anthropometric measures, in this case, this was not feasible. Removal of shoes was desired, yet this proved difficult for the frail participants and so footwear (mainly lightweight slippers) were weighed and the mass was subtracted from total body mass post body mass measure. Each participant’s stretched stature (m) and body mass (kg) measures using a portable stadiometer and digital weighing scales (SECA gmbh and co Ltd, Hamburg Germany). Participant’s BMI measurement was calculated by body mass (kg) divided by stature (m) squared (kg/m2).15
Questionnaires were employed to assess participant’s lifestyle habits. The questionnaire gained quantitative data using Likert scales (1-10, 1=healthier option and 10=unhealthier option) to measure participants’ lifestyle habits, which included variables including diet, sleep pattern, physical activity, mobility, balance, alcohol consumption, tobacco use and well-being, that followed a pre-validated questionnaire similar to that of Ansari et al.1
Data Analysis
The quantitative measures of BMI and quantitative lifestyle characteristic Likert scales results were analyzed using Microsoft Excel (2010) spreadsheet with the mean, standard deviation and range calculations for the overall sample, as well as for each gender were generated using the formulas tool. Scores from the eight Likert scale questions were added, divided by eighty and multiplied by one hundred to produce percentage data. Breakdown analysis of each of the questionnaire questions was undertaken to identify gender differences and individual lifestyle factors and their relationship with BMI measures. BMI measures and Lifestyle questionnaire percentage scores within each gender were then compared using paired samples t-test (α=0.05) producing a Pearson’s Correlation figure to determine the strength of the correlation present between the variables.
RESULTS AND DISCUSSION
Each question of the questionnaire has been summarized and related to BMI measures across genders. BMI results have been evaluated then correlation has been detected between overall lifestyle characteristics score and BMI across both genders.
Diet
When evaluating the health of participant’s diet, a scale was used from 1-10, (1 representing an extremely healthy diet and 10 representing an extremely unhealthy diet), 70% of participants rated their diet between points 2 and 4 suggesting healthy diet. Then 25% of participants between points 5 and 6, followed by one female (5%) report at scale 9 suggesting an unhealthy diet. The mean score rating of the overall sample was 3.95(±1.79), males 4(±1.48) and females, slightly less at 3.88(±2.30). A correlation coefficient of 0.8 was detected when undertaking a paired samples t-test comparing male diet ratings against male BMI measures showing a strong positive correlation. A correlation coefficient of 0.5 was proved by running a t-test comparing female diet rating and BMI measures, suggesting a moderate positive correlation. Strong correlation was detected between the health of participant’s diet and BMI in elderly males and a moderate correlation was shown in females. Much research considers dietary supplementation within elderly samples with little consideration of overall diet. However it is well known that consuming a higher calorie intake, positively correlates with higher BMI measures, as possibly supported (assuming a poorer diet reflects high calorie intake) by the correlation coefficients produced in this research.13 However, it is important to consider how participant may have rated their diet as unhealthy due to low calorie intake.
Physical Activity
When evaluating participant’s physical activity levels, a scale was used from 1-10 (1 representing extremely active and 10 representing extremely inactive), 65% of the participants rated their physical activity levels between points 5 and 9 suggesting they were not so active, with just 3 out of these 13 being female (Figure 1). The remaining 7(35%) participants rated between points 1 and 4 suggesting higher physical activity levels. The mean physical activity score rating of the overall sample was 5.4(±2.56), males 6(± 2.00) and females, less at 4.5(±3.16).
Figure 1: Participant physical activity responses showing male and female responses at each scale point.
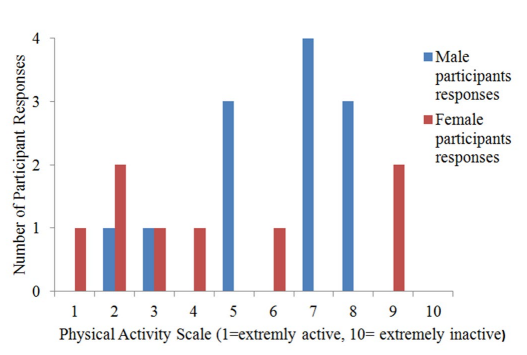
A correlation coefficient of 0.6 was detected when undertaking a paired samples t-test comparing male physical activity ratings against male BMI measures showing a moderate positive correlation. However, a correlation coefficient of 0.1 was proved by running a t-test comparing female physical activity rating and BMI measures, suggesting no correlation. The moderate correlation detected in the male participants is supported by research by Heyn et al,16 as it was concluded that higher physical activity levels among elderly have a positive influence on BMI. The weak correlation found in females supports research by Burke et al,17 who struggled to determine whether frequency of walking reduces obesity prevalence in elderly.
Mobility
When evaluating the participant’s mobility, 60% of participants scored between points 1 and 5 (1=extremely mobile and 10=extremely immobile) suggesting they were somewhat mobile. The mean mobility score rating of the overall sample was 5.05(±2.68), males 5.58(± 2.31) and females, less at 4.25(±3.15). A correlation coefficient of 0.8 was detected when undertaking a paired samples t-test comparing male mobility ratings against male BMI measures showing a strong positive correlation. A correlation coefficient of 0.1 was proved by running a t-test comparing female mobility ratings and BMI measures, suggesting a weak positive correlation. Although females proved a weak correlation, the stronger correlation represented in males could be supported by La Croix et al18 who reported risk of losing mobility was higher in those with higher BMI levels.
Balance
When evaluating the health of participant’s balance, results indicated that balance levels varied greatly across participants and genders. The mean balance score rating of the overall sample was 4.85(±2.43), males 5.33(±2.31) and females, less at 4.13(±3.59). A correlation coefficient of 0.7 was detected when undertaking a paired samples t-test comparing male balance ratings against male BMI measures showing a strong positive correlation. A correlation coefficient of 0.2 was proved by running a t-test comparing female balance ratings and BMI measures, suggesting a weak positive correlation. Limited research is available considering the effects of elderly individual’s balance on BMI. Results from this study would suggest that improved balance could encourage physical activity amongst elderly people, thus improve BMI measures. Bruce et al19 show how fear of falling is common in healthy, high-functioning older women due to poor balance and independently associated with reduced levels of participation in recreational physical activity. In turn it is evident higher physical activity levels among elderly have a positive influence on BMI.16
Sleep Attainment
When evaluating how often participants attained the recommended eight hours of sleep a night, a scale was used from 1-10(1 representing every night and 10 representing never) 85% of participants rated between 1 and 3 suggesting they regularly get the recommended 8 hours sleep (35% did every night). The mean sleep score rating of the overall sample was 2.45(±1.75), males 1.92(±0.79) and females, higher at 3.23(± 2.43). A correlation coefficient of 0.8 was detected when undertaking a paired samples t-test comparing male sleep attainment ratings against male BMI measures showing a strong positive correlation. A correlation coefficient of 0.5 was proved by running a t-test comparing female sleep attainment ratings and BMI measures, suggesting a positive correlation. These positive correlations are supported by Van den Berg et al,20 as conclusions suggest that elderly individuals who undertake short sleeping patterns or sleep that is highly fragmented are associated with having a higher BMI. Research undertaken by Patel et al,21 also supports the above correlations. It was detected that elderly individuals that slept for less than five hours a night showed greater adiposity and produced a BMI on average 2.5 kg/m² than participants who gained eight hours sleep. Other conditions as well as obesity, such as, arthritis, diabetes, lung diseases, stroke and osteoporosis have been associated with sleep-related problems such as breathing pauses, snoring, daytime sleepiness, restless legs and insufficient sleep (<6 hours nightly) in elderly participants.22
Smoking
When evaluating participant tobacco smoking habits of participants, a scale was used from 1-10 (1 representing an extremely never and 10 representing very often), 80% of participants stated that they never smoke. The mean smoking score rating of the overall sample was 1.7(±1.5), males 2.0(±1.86) and females, lower at 1.25(±0.71). A correlation coefficient of 0.4 was detected when undertaking a paired samples t-test comparing male tobacco smoking ratings against male BMI measures showing a moderate positive correlation. A correlation coefficient of 0.4 was also proved by running a t-test comparing female tobacco smoking ratings and BMI measures, again suggesting a moderate positive correlation. Possible reasoning for the weaker strength of the correlations between smoking and BMI may be related to the theory that smoking reduces BMI. Allison et al23 reported that elderly smokers had a mean BMI of 23.6(±4.4) compared to a mean BMI of 25.1(±4.2) for non-smokers. They concluded that it is plausible that at least some of the increased mortality observed with low BMIs in their study could be due to cigarette smoking.
Alcohol Consumption
When evaluating how often participants consumed alcohol, a scale was used from 1-10 (1 representing never and 10 representing very often) 20% stated they never drink alcohol, 55% rated 2 suggesting very irregular drinking, 20% stated between 3 and 4, with 1 male rating 7 suggesting fairly regular drinking habits.The mean alcohol score rating of the overall sample was 2.4(± 1.4), males 2.6(±1.78) and females, lower at 2.00(± 0.53). A correlation coefficient of 0.7 was detected when undertaking a paired samples t-test comparing male alcohol consumption ratings against male BMI measures showing strong positive correlation. A correlation coefficient of 0.3 was proved by running a t-test comparing female alcohol consumption ratings and BMI measures, again suggesting a weak positive correlation.
CONCLUSION
When considering the strength of the correlation between elderly body mass index results and overall lifestyle characteristics, a paired sample t-test produced a strong positive coefficient of 0.86 when considering male’s overall lifestyle characteristics questionnaire score and BMI measures, in contrast with a weak negative coefficient of -0.18 produced in females. This suggests that male’s lifestyle habits have a greater influence on their BMI measures than females.
Addressing the second aim of this research, although overall a strong positive correlation was detected in males compared to a very weak negative correlation in females, when breaking each lifestyle factor down to detect correlations with BMI, positive correlation coefficients ranging from 0.1-0.5 (weak to moderate) were highlighted among females. Stronger coefficients were produced when comparing male characteristics and BMI measures ranging from (0.4-0.8). Strong correlations (above 0.7) were detected suggesting a positive correlation between male’s diets, mobility, sleep, alcohol and well-being with BMI. Moderate correlations were shown between female’s diets, sleep and smoking habit with BMI. It can be argued that tailored manipulation of such variables may have a positive effect on one’s BMI. When considering means and standard deviations from such means, little difference was shown between genders in overall questionnaire score and BMI measures. The overall mean average questionnaire score was 39.25% (±14.84) with a range of 49%, from 19-68%. On average females scored very slightly higher 39.6% (±16.4) than males 39% (±14.45). Males had a slightly higher mean BMI of 28.14±3.27, with a range of 9.4 kg/m2, as the female mean BMI was 27.65±5.06, with a range of 13.1 kg/m2.
In conclusion, it is evident that particular lifestyle habits show positive correlations (of differing strengths) with BMI measures in both males and females. These characteristics should be manipulated and optimised to improve BMI measures, promoting healthier lifestyles and hopefully reduce the suggested burden of the aging population. As this research has proven, stronger correlations are detected when breaking individual’s lifestyle habits down to compare them to BMI, more advanced and comprehensive breakdown could suggest the most beneficial adaptions to elderly individual’s lifestyle to promote healthier BMI readings and could aim to detect which factors have the greatest influence on BMI measures. Reflecting the correlation proved between BMI and well-being ratings in males (coefficient of 0.8), improvements in BMI will not only reduce the financial and practical burden of the aging population on society, but shall hopefully improve overall well-being among elderly individuals.5
Further investigation into BMI measures and lifestyle characteristics within the elderly population is undoubtedly required. Improvements establishing the sample could be made in order to strengthen the generalisability of the results. A larger sample form differing cities (possibly even countries to represent the effect of ethnicity and culture on body compositions) could be attained to reduce ethnocentricity. If a large enough sample pool is gathered then a randomized design could be employed to increase representation. If a longitudinal design was feasible, results could take into account the elderly participant’s BMI measures and lifestyle characteristics beyond the snap shot in time. This could make the possibility of detecting patterns in data higher, and strengthen the generalisability of data.
Conflicts of Interest
The authors declare that they have no conflicts of interest.
CONSENT
The authors have obtained written informed consent from the participants for submission of this manuscript for publication.


