INTRODUCTION
Leg Length Discrepancy (LLD) has been defined as an observable difference in the limbs1 and has been classified as mild (10-30 mm), moderate (30-60 mm) and severe (> 60 mm) with regards to measured differences.2 Reported occurrences of LLD amongst the general population range from 45-70%.3,4 It is known that LLD patients are more prone to a number of injuries5 including: lower back pain;6 hip pain;7 trochanteric bursitis1 patellofemoral joint incongruence’s8,9 and meralgiaparesthetica.10 All of which could be transferable to the mechanics of endurance cycling which consists of repetitive and constrained movement over prolonged periods.8 A typical 90 minute ride pedaling at a cadence of 90 rpm would involve 8,100 cycles of the lower limbs making overuse injuries common.11,12 The foundation of such injuries are typically related to poor technique and/or imbalances of force generation brought about by incorrect bicycle setup and erroneous training.11 Considering their occurrence, anatomical imperfections including LLD are a likely contributor to such injuries as the rider(s) may tilt the pelvis in a compensatory manner towards the shorter leg creating differences in the function of the ankles, knees, hips, pelvis, torso and extension of the arms.13 These technical imperfections may well be due to a birth difference (true LLD) or functional LLD (FLLD) due to altered mechanics of the lower limb(s) including muscle-joint tightness and/or muscle weakness. While general consensus suggests 20-30 mm differences are fundamental to making adjustments, the functional outcome (comfort, decreased injury risk, and performance) should be the emphasis. To this end the numeric of LLD are somewhat irrelevant to an individual athlete, as there is evidence to support even minor LLD affecting biomechanical measures.14
Interestingly, a number of cycling specific companies have responded to an increased demand for LLD equalizing strategies, yet there is little evidence to support such practice. Database searches found no cycling specific studies in relation to such strategies with reference to force production equalizing capabilities in participants with LLD. However, it has been shown that equal Ground Reaction Forces (GRF) experienced during walking or running have been related to a normal gate and no LLD15 yet the presence of LLD creates asymmetries in GRF with larger GRF’s occurring in the longer leg.16,17 In a closed chain activity like cycling, where the feet are fixed to the pedals and the hands remain on the handlebars, any manipulation to lower extremity joint angles will potentially alter cycling performance through the effect on moment arm length and thus subsequent torque production for the specific leg involved.18 Studies investigating positional componentry of bicycles and their subsequent effects on performance have shown optimal values for saddle height19,20 and crank lengths.18,21,22 Others have analyzed and identified torque asymmetries amongst elite and recreational riders without reference to measures of participant’s limb lengths.23,24 Possible explanations for torque asymmetries focus on long term adaptations involving neuromuscular coordination and/or muscle fiber development of the dominant leg with little regard for LLD or FLLD. Likewise, bicycle-fitting services at point of purchase are common practice yet LLD are typically not considered. This is important, as a symmetrically built bicycle could result in joint angle asymmetry due to compensatory mechanisms, which could plausibly decrease rider efficiency, and subsequently decrease performance. Therefore, the aim of this study was to assess pedal mechanical asymmetries of trained cyclists with minor LLD (5-10 mm) and to examine both the mechanical and physiological effects of compensatory strategies including crank length adjustment and cleat wedges.
We hypothesized that LLD or FLLD would produce mechanical asymmetries and that compensatory strategies implemented would equalize mechanical differences while increasing the overall efficiency of the cyclist. In addition, the cleat wedge was expected to equalize torque asymmetries and thus further improve efficiency as a direct response of artificially decreasing LLD as opposed to alterations to a single crank arm length.
METHOD
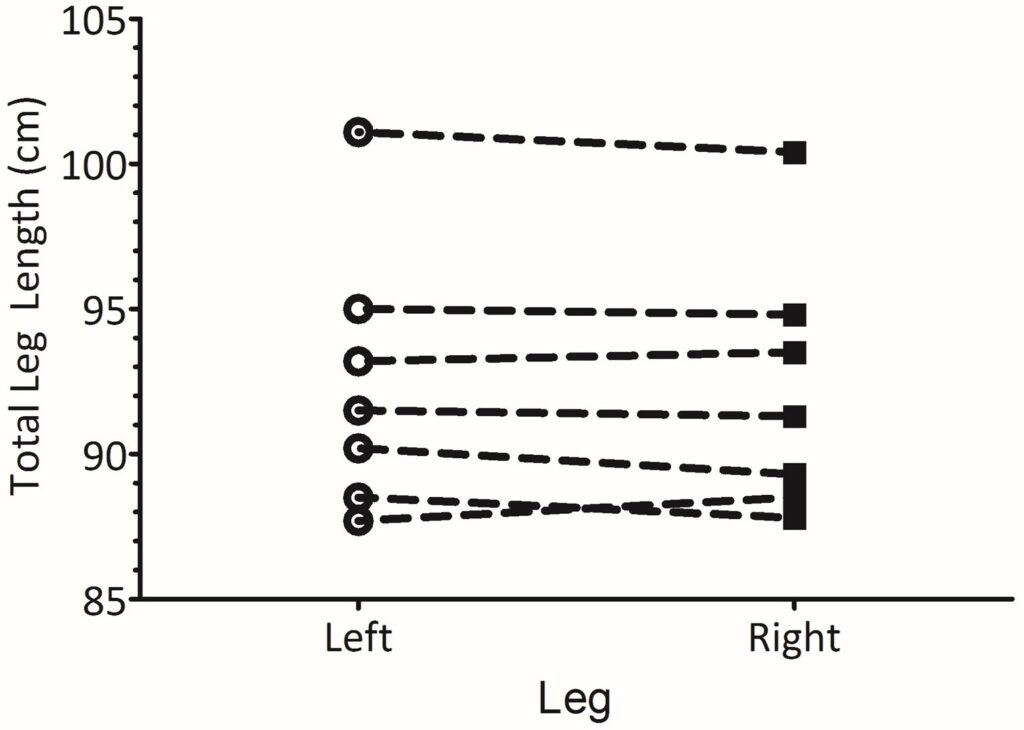
Seven endurance trained, competitive cyclists (mean±SD: age 34±3 years, height 180±7 cm, mass 68.6±9.6 kg) at different time points of their training season due to individual goals, were selected to participate in the study based upon a minimum minor LLD classification with a mean between total leg length difference of 5.4±2.9 mm (Figure 1).
Figure 1: Total leg length of individual participants
All participants provided written consent in accordance with the NZ Central Region Ethics Committee.
Experimental Design
Participants reported to the laboratory on three occasions, including two preliminary sessions and the main trial session. A repeated measures design was used to compare the effects of three conditions including: 1) Normal bike set-up considered as the control (Con), 2) Crank Length (CL), and 3) Cleat Wedge (CW). Each condition was performed in a single blind (participants) and balanced order with a 15 min recovery period between each condition. All subjects were asked to maintain normal weekly training volumes leading up to each trial and refrain from strenuous training and the consumption of alcohol or caffeine 24 h prior to each test.
On the day of each trial, subjects reported to the laboratory at the same time of day.
Preliminary Trial
Visit 1: On arrival at the laboratory each subject’s height (cm) and body mass (kg) were taken followed by an examination of LLD. Leg length was determined using ISAK accredited methods for segmental lengths25 of both left and right legs using a segmometer (Lufkin, USA) and performed by an ISAK accredited level 3 anthropometrist. Measurements included the trochanterion-base height and the tibialelaterale – base height25 and involved the participant standing on a measuring platform with all measurements taken parallel to the long axis of the bone.
Once anthropometric measures were obtained the laboratory cycle ergometer (SRM, Germany) was set in accordance to measurements taken from the participants bicycle and finetuned according to individual preference as part of the warm up on the ergometer. These measurements were recorded and standardized for subsequent visits. Participants were then asked to perform a standard ramp test22 starting at 100 W and increasing by 25 W·min-1 until exhaustion (Wmax). Throughout this test expired air (Parvomedics Truemax 2400) data were logged, averaged every 15 s in order to enable the calculation of O2 max and Ventilatory Threshold (VT). VT has been used in the past as a reliable indicator of endurance performance26 and an intensity performed in large volumes by professional road cyclists.27 As such the corresponding power output achieved at VT was used to determine exercise intensity for the main experimental trials. For participant characteristics of the Wmax test see Table 1.
Table 1. Subject Characteristics for the Maximal Laboratory Ramp Test
|
V̇O2max
(ml·kg-1·min-1)
|
Wmax (W)
|
Power output at VT
(W)
|
Power output at RCP
(W)
|
|
62.1±6.1
|
405±60
|
236±14
|
289±31
|
Visit 2: Following ergo meter set-up and confirmation of correctness the participant completed a self-selected warm-up followed by familiarization of the main trial including: the isokinetic 50 rpm (ISO50) test typically used to determine the strength of a cyclist,22 though in this study it was used for EMG normalization.28 This involved recording the peak EMG value during the ISO50 and reporting EMG data during the main trial as a reference value (%) in relation to maximal activity. After a 5 min recovery period participants then completed 15 min at power output associated with VT (15@VT) and a Peak power-cadence test (PPC) used to determine sprint capability29 as per Figure 2.
Figure 2: Schematic representation of the performance protocol
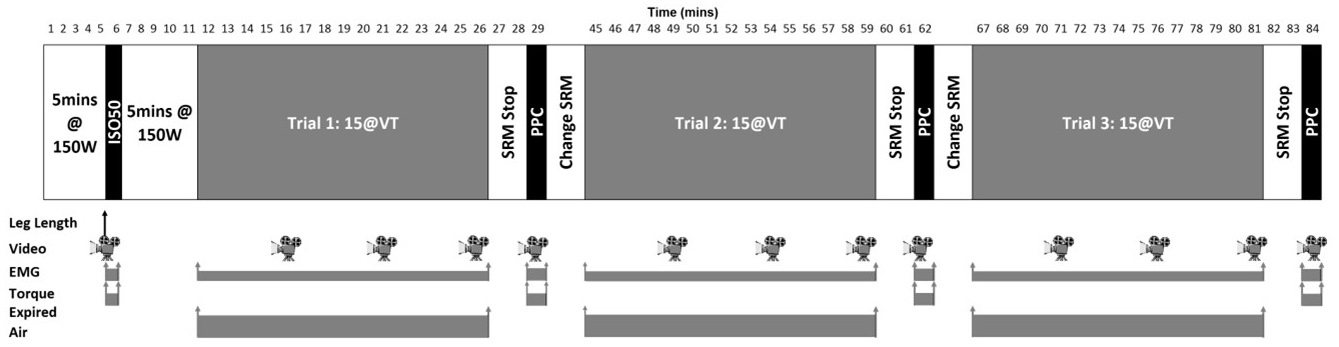
The PPC test is a 6 s maximal effort cycle ergometry test that requires the participant to reach peak power (W) at the onset of the initial effort when inertia is greatest, whilst peak cadence (rpm) should be attained during the latter part of the test when inertia is minimal. This test is performed in a seated position from a stationary start with participants leading from their preferred starting foot set at a fixed crank angle of +15º from the top dead center.
The ISO50 test demands the ergo meter to be set to isokinetic mode. The participant is required to pedal at a cadence of 50 rpm for 30 s with minimal resistance, wherein a 10 s countdown is given prior to commencement of the test upon which the participant applies maximal effort for 10 s at the fixed cadence of 50 rpm.
Main Trial
Visit 3: After arrival at the laboratory subjects were weighed, completed a standardized warm-up and protocol (Figure 2) involving an ISO50 test for EMG normalization, and 15@VT preceding a 2 min break before performing the PPC test. The 15@VT and the PPC tests were performed on two further occasions for one of the three conditions (Con, CL, or CW). Trials were undertaken in a balanced order. Prior to performing each condition there was a 15 min period where the participant removed their cycling shoes and left the laboratory long enough to enable changes to either shoe cleats or crank length. Once this procedure was complete the participant returned to the laboratory and used the remainder of the time to adjust to the particular intervention through pedalling on the ergo meter at intensity lower than the main trial. This period was considered sufficient to adapt to changes in crank length, as muscle co-ordination adaptation to changes in crank mechanics has been shown to occur within the first 10-20 revolutions.30
Data Collection
Torque (Nm), EMG (RMS) and digitized video were synchronized for the ISO50 test and 10 s epochs taken during the 5th, 10th and 15th minute between 40-50 s of the main trial (Figure 2).
Torque analysis measured via the SRM ergo meter, SRM medical cranks (SRM, Welldorf, Ger) was analyzed via the Power control IV unit connected to a PC, sampling at 200 Hz. While the SRM cranks provide net torque for a complete pedal cycle it has been used previously as a reliable method for assessing pedaling asymmetries.23 Calibrations of the SRM cranks were performed prior to each trial as per the manufacturer recommendations.
EMG analysis focused on the Vastuslateralis (VL) muscle, which is a major contributor to force development during cycling and knee extension. The period of pedaling where VL muscle activation and subsequent contraction occurs, is referred to as the propulsive or down stroke phase.31,32 EMG activity from both the left and right leg was recorded using surface electrodes 10 mm diameter, located 12 mm apart and placed 5 cm proximal to the superior lateral border of the patella33,34 at an angle in line with the approximate muscle fiber pennation angle.35 In order to improve contact and decrease impedance, the participant’s skin was shaved, abraded and cleaned with alcohol swabs. The electrodes were taped and participants lycra shorts placed over the top to decrease movement artifacts. The raw EMG signals were band-pass filtered between 20 and 480 Hz, amplified, and converted from analog-to-digital at a sampling rate of 1 kHz. All raw EMG data was converted to RMS and normalized28 in relation to data collected from the ISO50 test and expressed as a percentage of maximum dynamic EMG activity.
Two synchronized digital video cameras (Casio Exilim Pro EX-F1, Japan) were set up at a distance 3 m perpendicular to the SRM ergometer in order to capture movement in the sagittal plane. Video capture (300 Hz) was digitized (SiliconCoach Digitizer, NZ) enabling 2D analysis including mechanical angles (°): Horizontal – Greater Trochanter – Lateral Condyle (H-GT-LC); Greater Trochanter – Lateral Condyle – Lateral Malleolus (GTLC-LM); Lateral Condyle – Lateral Malleolus – 5th Phalange (LC-LM-P).
To determine the condition effect on mechanical efficiency of pedaling, physiological measures including heart rate (Polar Electro, Kempele, Finland) and expired air analyzed for measures of V̇O2 and V̇CO2 (TrueOne, Parvomedics, USA), were sampled over the whole trial and averaged for the last 2 min of each 5 min epoch. Gross Efficiency (GE) was calculated as the mean of all data collected in the last 2 min of each condition and calculated as previously described,36 equation 1.
Equation 1
GE (%)=((Work Rate (W)/EE (J.s-1))×100
Where EE equals energy expenditure calculated as:
EE (J.s-1)=[(3.869×V̇O2)+(1.195×(V̇CO2)]×(4.186/60)×1000
STATISTICAL ANALYSIS
Data recorded throughout the laboratory trial were transmitted to a conventional personal computer and analyzed with the respective software. Due to the differences in direction of any possible changes as a direct result of LLD, all data is expressed as percentage (%) differences between legs. Descriptive data (mean±SD) were calculated for all dependent variables using Graph Pad Prism (version 5.0). Differences between conditions (CON; CL; CW) for all dependent variables were assessed via two-way repeated-measures analysis of variance (ANOVA), with two within-subject variables condition*time, while threeway ANOVA was used for condition*joint location*time. Significance level for statistical analysis was set at the P<0.05 level. In consideration that worthwhile differences37 may not reach statistical significance due to small participation numbers and the potential for small but variable outcomes we decided to use measures of meaningfulness to allow practitioners a more thorough and detailed view of data analysis.38 As such the effect size (Cohen’s d) were also reported where applicable.39
RESULTS
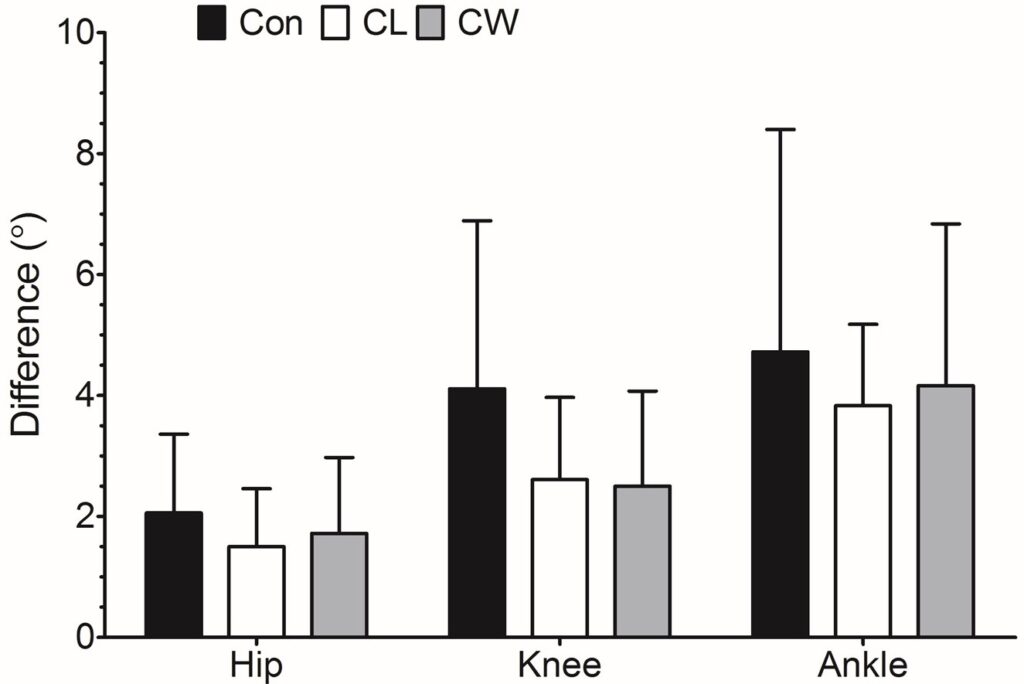
Under the control condition participants exhibited a 2.255±1.581% bilateral difference for torque production and a 6.250±3.858% difference for normalized EMG data. The bilateral mechanical angle differences at 90º of a crank revolution were 3.17±2.20, 4.11±3.23, and 4.33±3.52º for Hip (H-GTLC), knee (GT-LC-LM) and ankle, respectively.
Repeated measures one-way ANOVA for all conditions within the study showed the mean overall power output and cadence remained unchanged (p=0.6424 and p=0.4819) for each condition. Mean±SD values of power output were 208±47, 209±48 and 209±48 W while values for cadence were 85±6, 86±6 and 86±5 rpm for Con, CL, CW, respectively.
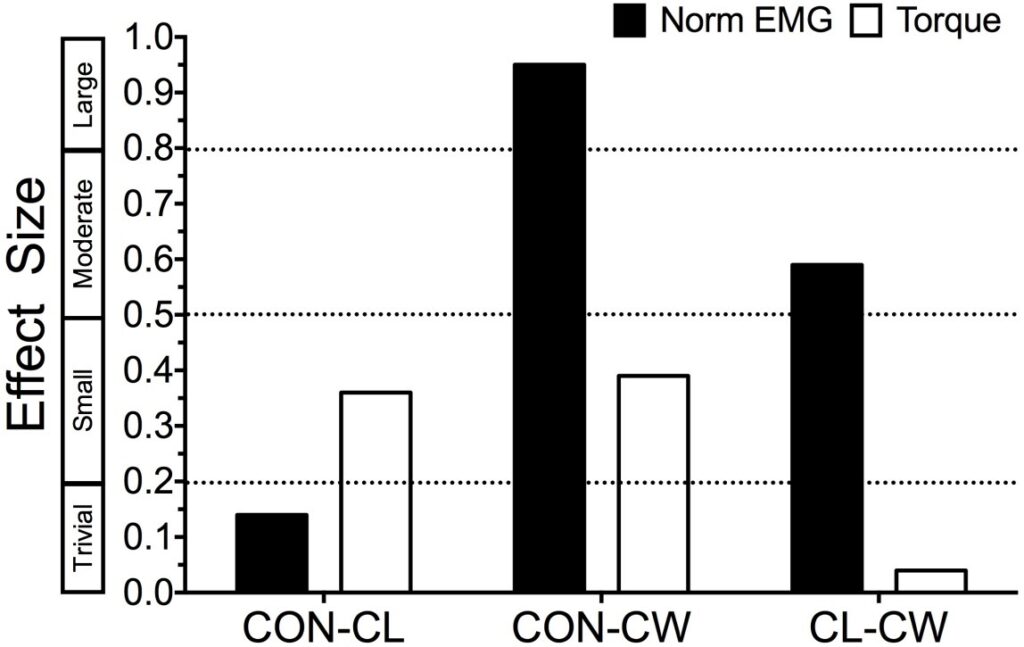
Repeated measures two-way ANOVA showed no interaction between condition*time period (p=0.6381; p=0.3969) and no main effect of either condition (p=0.6424; p=0.3944) or time (p=0.5507; p=0.2298) for torque or normalized EMG differences, respectively. Overall differences for the complete 15 min period were 6.25±3.86, 5.87±3.53, and 3.87±1.64 for normalized EMG while torque (Nm) exhibited differences of 2.26±1.58, 1.74±1.74, and 1.68±1.64 %. Effect size analysis comparing conditions identified small positive effects with regards to equalizing differences between legs for both CL and CW when compared with the control condition (Figure 3).
Figure 3: Comparisons of conditions for the overall differences between legs of normalized EMG (%) and torque (Nm), expressed as effect size with descriptive categorization of effect size provide on the y-axis39
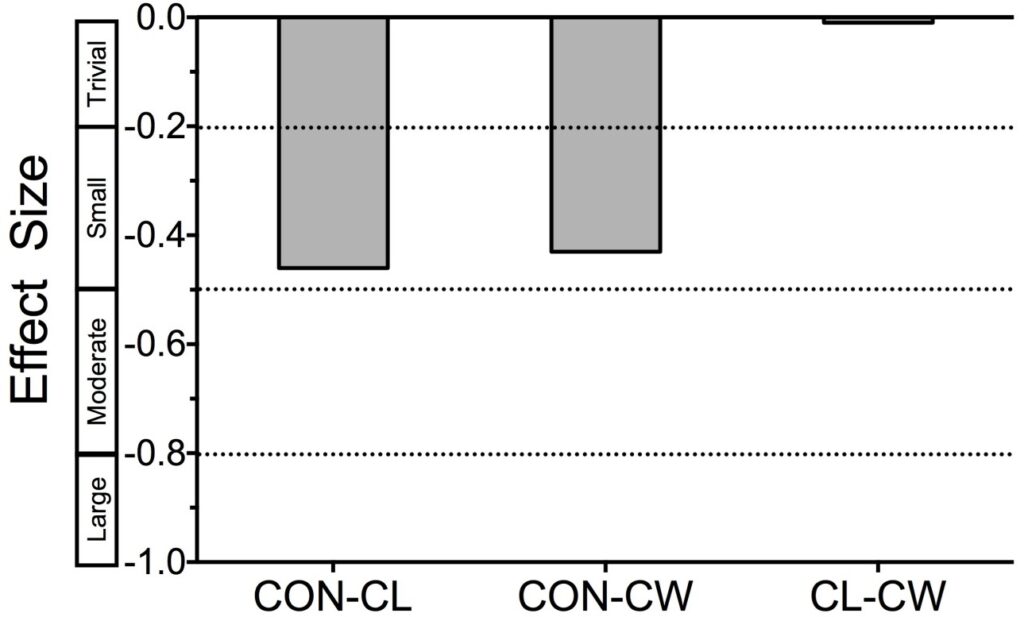
Resultant physiological responses calculated as the overall mean for each condition showed no significant differences for heart rate (132±15, 134±17, 136±21 bpm, p=0.5165),O2 (2.69±0.52, 2.74±0.52, 2.77±0.54 L⋅min-1, p=0.5247) or GE (22.52±1.72, 21.74±2.04, 21.72±2.37 %, p=0.3426). However, effect size calculation showed that the experimental intervention had a small effect on reducing gross efficiency in both the CL and CW conditions (Figure 4).
Figure 4: Difference in gross efficiency between conditions expressed as effect size (Cohen’s d)
Three-way ANOVA was used to examine the main effects and interactions of condition, angle location and time epoch (each 5 min within the overall 15 min period) as they relate to RMS difference between left and right sides for a complete crank cycle. There were no significant difference for the dependent variable (RMS differences) for Condition*Time*Location (F(2,21)= 0.224, p=0.986) while no significant differences were observed for the main effect of condition (F(2,8)= 1.916, p=0.151) and time (F(2,8)= 0.587, p=0.712). Similar analysis for mechanical angles at a typical point of peak torque production (90° of crank cycle40 produced no interaction for Condition*Time*Location (F(2,21)= 0.925, p=0.498) or main effects of condition (F(2,8)= 2.824, p=0.063), time (F(2,8)= 0.036, p=0.965) or location (F(2,8)= 2.314, p=0.103). Figure 5 shows the overall mean±SD angle differences for each of the design conditions for which effect size calculations identify moderate effects of the interventions on reducing differences at the hip (Con-Cl d=0.52, Con-CW d=0.51 and CL-CW d=-0.04) and large effects at the knee (ConCl d=1.25, Con-CW d=1.58 and CL-CW d=0.44) when compared to the control condition.
Figure 5: Overall mean ± SD for each condition and mechanical location. Where, Hip equals Horizontal – Greater Trochanter – Lateral Condyle (H -GT-LC); knee equals Greater Trochanter – Lateral Condyle – Lateral Malleolus (GT-LC-LM); and ankle equals Lateral Condyle – Lateral Malleolus – 5th Phalange (LC-LM-P)
 DISCUSSION
The main aim of this study was to identify the extent of asymmetries in trained cyclists with mild LLD and whether acute implementation of two compensatory strategies (CL and CW) would alter rider mechanics and their physiological response to a sub maximal riding intensity.
The main findings were: a) participants with a mean LLD of 5.4±2.9 mm showed asymmetries with regards to mechanical angles, torque production and muscle activity imbalance; and b) compensatory interventions (CL and CW) used to equalize mild LLD made small but potentially worthwhile differences to imbalances in torque production and muscle activity, but negative changes to physiological markers of gross efficiency as a result of changes to long-term compensatory mechanisms acquired. c) the proposed mechanism for these changes is related to equalizing differences in joint angles at point of maximum torque application.
Within the cohort of participants used for this study initial analysis identifying whether minor LLD amongst cyclists produced kinetic difference was justified, and if corrected would potentially benefit performance and reduce overuse injuries. Imbalances in the moment arms of the cyclist could lead to increased muscle mass due to inequity in work performed to compensate for mechanical inefficiencies. Either way the athlete’s performance could be limited due to a discrepancy that could easily be remedied. Therefore, any intervention aimed at addressing imbalances such as alteration to crank length or via orthosis is worth investigating under controlled conditions. Accordingly, participants of this study successfully completed the three conditions at identical power outputs and cadences suggesting that any changes to differences between legs with regards to mechanical angles, torque, knee extensor activity and subsequent physiological variables could be largely attributed to the particular condition rather than any difference in power output or cadence of participants.41
Previous work18 has acknowledged the importance of the interaction of lower extremity mechanics and moment arm in optimal cycling performance. The importance of the hip, knee and ankle to cycling performance is further supported via the contribution of muscle loading (hip extensors (27%); hip flexors (4%); knee extensors (39%); knee flexors (10%); and ankle plantar flexors (20%)) via flexion and extension towards total positive work.42 The synchronized, digitized 2D video analysis of participants in this study identified a small but escalating difference at the hip, knee and ankle, respectively (Figure 5) under normal conditions. This combined with the knowledge that torque production imbalance was 2.3±1.6 % and normalized EMG of vastuslateralis was 6.3±3.9% highlights an increased total work output by one leg over the other. Such discrepancies are expected to either limit performance capabilities of cyclists.
While LLD’s effects on cycling performance have not been investigated prior to this point, walking studies show LLD’s corrected to within 10 mm during walking do not produce favorable outcomes.16 Suggested reasons for such outcomes lie with the fact that longitudinally, people develop compensatory mechanisms to overcome such differences.17,43 There is no reason to believe that this would be different for cycling and in fact it is plausible that acute interventions would cause increased negative imbalances. Compensatory mechanisms within cycling could involve an increased downward or upward pelvic obliquity leading to an asymmetric position on the saddle; increasing or decreasing knee extension/flexion throughout one crank cycle; and greater plantar flexion or dorsiflexion of the foot. As such our findings support the assumption that any alteration to long-term compensatory mechanisms while improving mechanical imbalances as shown by both torque and normalized EMG discrepancy attenuation (Figure 3) in the short-term.
The intervention produced an acute small negative effect on gross efficiency (Figure 4). This is important to know, as we would expect an increase in performance and/or efficiency as a result of changes to work output. Although impossible to prove from acute interventions such as this it is conceivable that the link between expected increased efficiency would be related to the adaptation period required to overcome long-term compensatory mechanisms obtained by the cyclists. It could also be construed that the addition of any acute correctional interventions combined with the likely longitudinal compensatory adaptation to LLD would serve to increase short-term injury risk with the addition of a possible negative performance effect. To this end any intervention causing change to the moment arm must be viewed from a progressive, long-term approach rather than an immediate-permanent change. As such it is important to perform a study where participants are assessed acutely but followed on a longitudinal basis in order to ascertain whether the assumption that compensatory mechanisms require time to adapt with resultant improvements in gross efficiency.
CONCLUSION
An acute strategy to balance LLD had small positive effects on imbalances of mechanical angles at joints involved in cycling and such changes were enough to rectify discrepancies of torque and muscle activity between legs. However, these acute responses triggered a negative response in physiological measures of efficiency. It is felt that participants would require an adaptation period to remedy any neuromuscular compensatory adaptations that have previously taken place.


