INTRODUCTION
Given the accessibility of subcutaneous fat around the body, may be a reason which has led to the proliferation of formulae and equations to estimate whole body density (g.ml-1) from various components of body composition.1,2 The formulae are normally subdivided into regression equations generally developed on anthropometric based formulae that predicts the dependent variable (whole body density (g.ml-1)) from a series of independent variables such as body mass, stretched stature, skinfolds, girths, breadths, depths and widths.2,3,4 Within scientific literature these regression equations are correctly termed calibration models, and the development of generalised calibration models provides a wealth of body composition information relating to different ages, sex and ethnicity.4,5 From a sport science research perspective, questions remain about measurement validity issues and in retrospective can affect the confidence of what sport scientists have to say about their meaningfulness of their measurement data. Therefore, if these calibration models for the estimation of whole-body density are to be useful in a football or indeed a sporting context, their validity must be established. When further scrutinising the methodological approaches to the design and development of some of the most popular calibration models, various limitations quickly become apparent. These limitations are no means exhaustive and could be replicated in other limitations, never-the-less they account for four main areas of concern:
Limitation 1: The Number of Variables Used as Individual Components within a Calibration Model
Questions have risen relating to the restrictive range of anthropometric measures used within a calibration model and in particular, the anthropometric site location.4,6 What is evident is that of the most commonly used approach of four main skinfold sites of the biceps, triceps, suprailiac and subscapular which have been all or partly used within calibration models for young adult men.7,8,9,10 The reason why these specific measures were used in their models is likely to be because of their impact on the estimation of whole body density (g.ml-1). Another possible reason could be the recommendations from previous research indicating that the site location provides an accessibility advantage, although this is unclear.
Limitation 2: The Emphasis of How Variables are Used Interchangeably within a Calibration Model
In some instances, the manner in which the body composition variables are used interchangeably within the calibration model regression equation can provide an outcome with a different bias, which can result in significant errors in whole body density (g.ml-1).11,12,13 Examination of various calibration models found that some variables were provided as stand-alone outcomes, some as a combination of summed variables, some squared or even logged. What is often not discussed in calibration studies, is whether there have been any collinearity issues. As collinearity can potentially have an impact on the validity of the predictors in the models, what is concerning that given the wide range of anthropometric variables that are used within the development of these calibration models, that this has not been flagged as a concern or appear to be addressed by the authors in their findings.14,15
Limitation 3: The Sample Size Employed when Developing a Calibration Model
Too frequently the restrictive nature of the sample sizes raises concern over its practical use with a given population due to its predictive nature of the calibration model.16,17 It is important to consider recommendations by Atkinson17 and Sun et al18 where the larger the sample size, the more statistical
power, with recommendations to achieve 9 participants per variable.17,18,19 Yet, literature investigated indicated that this this is not the case, thereby questioning the confidence and usefulness of such calibration models on a population of professional footballers.18
Limitation 4: The Use of Inappropriate Analytical Methods and the Lack of Cross-Validation Approaches When Designing a Calibration Model
If these calibration models are to be useful in a football context, their predictive accuracy for the estimation of whole body density must be established through careful examination using the most appropriate analysis methods.6,20,21 The majority of the calibration studies investigated used stepwise linear regression analyses as a method of choice, and none of them employed the Bland et al26 95% limits of agreement analyses. Given that this approach was first introduced in the biostatistics literature by Altman and Bland22 and recommended to the sport science community by Nevill et al23 previous calibration models did not have access to these analyses. On another note, the calibration model(s) should be cross-validated by comparing values in a different sample of participants drawn from the population of interest, than those originally used to develop the calibration model, in order to test the accuracy of the prediction results.4,5 Too frequently however, the sample sizes for cross-validation, and the range of variables considered, have been too restrictive to be effective indicators of the predictive nature of the existing calibration models.16,17 Of the fourteen most commonly used calibration models within the literature, only the Jackson et al24 model was found to have cross validated their model, where they used a sample of n=308 male participants to develop and n=95 to cross validate their model. Yet the remaining 13 calibration studies did not cross-validate their models and one plausible reason was due to their low sample sizes and cross-validation was not an option. What is disappointing is none of these studies discussed why cross-validation was not conducted, which in itself is a fundamental error.
With these limitations in mind and the number of calibration models available, it is still questionable to whether the majority of these calibration studies are robust when estimating whole body density (g.ml-1) in professional footballers. Therefore, careful examination of the validity of the whole body densities predicted by these models is warranted. Hence, the aim of this study was to determine the agreement and subsequent validity from a range of previously published calibration models used to predict whole body density (g.ml-1) determined from hydrostatic weighing as the criterion measurement method. The data entered into the models were gained from careful measurements with known reliability from Mills et al25 study, the sample size was large (n=206 participants) and the criterion validity was determined with reference to Bland et al26 95% limits of agreement approach.
MATERIALS AND METHODS
Participants and Recruitment
Participants included two hundred and six Fédération Internationale de Football Association (FIFA) registered contracted professional football players ( ±s; age=24.1±5.4-years, body mass=78.8±8.4 kg, stretched stature=180.1±7.0 cm and whole body density=1.075±0.010 (g.ml-1) who were all over 18-years of age and free from disease. They were recruited from eight professional football clubs that represented Barclays Premiership, npower Championship, npower League One, npower League Two and Blue Square Premier Leagues during the 2007-2008, 2008-2009 and 2009-2010 playing seasons. All participants completed a health screening questionnaire and agreed to take part in the study by giving their informed consent. Ethical approval was granted from the University of Gloucestershire (UK) Research Ethics Committee (MIL-UOGREC/10).
Procedure
This study needed to interrogate the degree to which models could potentially be applied to the present population of male professional football players. All potential calibration models were considered, and a selection criterion was put in place for accepting or rejecting them for further investigation (Table 1). Of the 18 models identified, 4 models were rejected on the basis that they required the chest skinfold to be measured, which is considered outdated in relation to International Society for the Advancement of Kinanthropometry (ISAK) accreditations. Subsequently, 14 calibration models and the process via air displacement plethysmography were accepted to predict whole body density (g.ml-1) in professional football players.
Table 1. Calibration Models for Consideration
|
Author(s)
|
Sample No
|
Sample Characteristics
|
Country
|
Ethnicity
|
Skinfold Caliper
|
Age
|
Body Mass
|
Stretched Stature
|
Accept or Reject Model
|
| Brožek et al45 |
159
|
University students
|
USA
|
Undisclosed
|
Undisclosed
|
20.4
|
69.1
|
177.8
|
Rejected
|
| Pascale46 |
88
|
Soldiers
|
USA
|
Caucasian
|
Medical Nutrition
|
17.0-25.0
|
49.7-109.8
|
94.0-193.0
|
Rejected
|
| Durnin et al7 |
60
|
Volunteers
|
Scotland
|
Undisclosed
|
Harpenden
|
18.1-33.8
|
43.6-95.6
|
154.8-192.0
|
Accept
|
| Sloan31 |
50
|
University students
|
South Africa
|
Undisclosed
|
Medical Nutrition |
18.0-26.0
|
57.8-85.7
|
163.0-191.0
|
Accept
|
| Wilmore et al32 |
133
|
University students
|
USA
|
Undisclosed
|
Lange
|
16.8-36.8 5
|
53.2-121.2
|
159.0-193.4
|
Accept
|
| Sloan et al35 |
50
|
Volunteers
|
Scotland
|
Undisclosed
|
Medical Nutrition |
18.0-26.0
|
Undisclosed
|
Undisclosed
|
Accept
|
| Forsyth et al36 |
50
|
University sports students
|
USA
|
Undisclosed
|
Lange
|
19.0-22.0
|
68.5-85.9
|
178.4-179.6
|
Accept
|
| Forsyth et al30 |
50
|
University sports students
|
USA
|
Undisclosed
|
Lange
|
19.0-22.0
|
68.5-85.9
|
178.4-179.6
|
Accept
|
| Katch et al33 |
53
|
University sports students
|
USA
|
Caucasian
|
Lange
|
18.0-21.0
|
62.8-80.0
|
169.4-183.4
|
Accept
|
| Behnke et al37 |
54
|
University students
|
USA
|
Undisclosed
|
Undisclosed
|
Undisclosed
|
Undisclosed
|
Undisclosed
|
Accept
|
| Durnin et al8 |
209
|
Sports enthusiasts
|
Scotland
|
Undisclosed
|
Harpenden
|
17.0-72.0
|
49.8-121.4
|
150.0-193.0
|
Accept
|
| Wickkiser et al38 |
65
|
American footballers
|
USA
|
Undisclosed
|
Lange
|
17.2
|
88.0
|
182.5
|
Accept
|
| Pollock et al24 |
95
|
Volunteers
|
USA
|
Undisclosed
|
Lange
|
18.0-22.0
|
74.6-82.2
|
179.6-179.8
|
Rejected
|
| Jackson et al24 |
403
|
Volunteers
|
USA
|
Undisclosed
|
Lange
|
18.0-61.0 5
|
54.0-123.0
|
163.0-201.0
|
Accept
|
| White et al38 |
58
|
American footballers
|
USA
|
Undisclosed
|
Undisclosed
|
19.9
|
89.7
|
182.0
|
Accept
|
| Lohman9 |
61
|
University students
|
USA
|
Undisclosed
|
Undisclosed
|
Undisclosed
|
Undisclosed
|
Undisclosed
|
Accept
|
| Thorland et al10 |
141
|
Athletes of national calibre
|
USA
|
Undisclosed
|
Lange
|
16.5-18.4
|
56.2-78.8
|
167.9-185.1
|
Accept
|
| Withers et al47 |
207
|
State representatives
|
USA
|
Undisclosed
|
Harpenden
|
15.4-39.1
|
53.3-117.3
|
154.1-215.1
|
Rejected
|
Table 2 provides the components of the calibration model regression equations for the accepted pre-published calibration models used in this study. It is important to note that none of the models were designed specifically for use within professional football players.
Table 2. Calibration Models for the Prediction of Body Density (g.ml-1)
| Durnin et al7 |
Db=1.1610-0.0632 X Where X=log10 of the ∑of biceps, triceps, subscapular and suprailiac skinfolds |
| Sloan31 |
Db=1.1043-0.001327 (X1)-0.001310 (X2) Where X1=front thigh skinfold, X2=subscapular skinfold |
| Wilmore et al32 |
Db=1.08543-0.000886 (X1)-0.00040 (X2) Where X1=abdominal skinfold, X2=front thigh skinfold |
| Sloan et al35 |
Db=1.1043-0.00133 (X1)-0.00131 (X2) Where X1=anterior thigh skinfold, X2=subscapular skinfold |
| Forsyth et al36 |
Db=1.10647-0.00162 (X1)-0.00144 (X2)-0.00077 (X3)+0.00071 (X4) Where X1=subscapular skinfold, X2=abdominal skinfold, X3=triceps skinfold, X4=mid-axilla skinfold |
| Forsyth et al30 |
Db=1.03523-0.00156 (X1)+0.00207 (X2)-0.00140 (X3) Where X1=subscapular skinfold, X2=biiliocristal breadth, X3=abdominal skinfold |
| Katch et al33 |
Db=1.09665-0.00103 (X1)-0.00056 (X2)-0.00054 (X3) Where X1=triceps skinfold, X2=subscapular skinfold, X3=abdominal skinfold |
| Behnke et al37 |
Db=1.08543-0.00086 (X1)-0.00040 (X2) Where X1=abdominal skinfold, X2=anterior thigh skinfold |
| Durnin et al8 |
Db=1.1765-0.0744 (log10X1) Where X1=∑4 skinfolds (triceps, biceps, subscapular and iliac crest) |
| Wickkiser et al38 |
Db=1.10148-0.00118 (X1)-0.00114(X2)+0.00044 (X3 ) Where X1=waist circumference, X2=triceps skinfold, X3=stretched stature |
| Jackson et al24 |
Db=1.0982-0.000815 (X) +0.0000084 (X)2 Where X=∑3 skinfolds (triceps, abdomen and subscapular) |
| White et al38 |
Db=1.0958-0.00088 (X1)-0.00060 (X2) Where X1=suprailiac skinfold, X2=anterior thigh skinfold |
| Lohman9 |
Db=1.1091-0.00052 (X1) +0.00000032 (X1)2 Where X1=∑7 skinfolds (triceps, subscapular, mid-axilla, iliac crest, abdominal, front thigh and medial calf) |
| Thorland et al10 |
Db=1.0988-0.0004 (X1) Where X1=∑7 skinfolds (triceps, subscapular, biceps, supraspinale, abdominal, front thigh and medial calf) |
Statistical Analysis
In order to establish the requisite indices of validity for each calibration model for participants whole body density (g.ml-1), there were some major elements to be determined: (i) the systematic bias in the whole body density (g.ml-1) values between each calibration model, (ii) establish the degree of random variation, (iii) the degree of heteroscedasticity (the condition of un-equal residual variance) which would be investigated by the application of the Bland et al26 95% limits of agreement method, finally, (iv) to identify whether the quantification of agreement was narrow enough for the whole body density (g.ml-1) to be providing practically valid values, thereby, would it have any detrimental effect of the practical use for this population of participants. Therefore a priori was established for the Bland and Altman 95% LoA method that presented acceptable tolerable limits within the context of this study and set at ±3.8% (p≤0.05).25,27,28,29 For instance, whole body density of 1.075 g.ml-1 could be considered average within the context of this study, therefore ±3.8% acceptable limit, whole body density ranged from 1.034 to 1.116 g.ml-1 in the studied population. Reports from Mayhew et al,20 Cooper21 and Heyward6 suggest that too high whole body density (g.ml-1) could pose a possible impact on team selection, conversely too low could be deemed a definite danger to the health and wellbeing of the participant if their training prescription is not carefully considered. When illustrated in this manner, it is clear that the acceptable limits can be used interchangeably with the criterion measurement method to assess whole body density (g.ml-1) in professional football players.
RESULTS
Table 3 provides an overview of bias, random variation and heteroscedasticity of 95% limits of agreement for all calibration models. Inspection indicated that in 13 of the calibration models (on average) whole body density (g.ml-1) derived from hydrostatic weighing, was greater than whole body density (g.ml-1) derived from the models, so there was a positive bias.
Table 3. Overview of 95% Upper and Lower Limits of Agreement and Bias Indicators
for (n=14) Calibration Models Plus Air Displacement Method
|
Calibration Models
|
Bias (g.ml-1)
|
(95LoA)
|
|
Lower Limit (g.ml-1)
|
Upper Limit (g.ml-1)
|
| Durnin et al7 |
+0.009
|
-0.018
|
+0.036
|
| Sloan31 |
+0.000
|
-0.027
|
+0.028
|
| Wilmore et al32 |
+0.008
|
-0.019
|
+0.034
|
| Sloan et al35 |
+0.001
|
-0.027
|
+0.029
|
| Forsyth et al36 |
+0.006
|
-0.023
|
+0.034
|
| Forsyth et al30 |
+0.015
|
-0.015
|
+0.045
|
| Katch et al33 |
+0.001
|
-0.026
|
+0.027
|
| Behnke et al37 |
+0.007
|
-0.019
|
+0.033
|
| Durnin et al8 |
+0.015
|
-0.012
|
+0.043
|
| Wickkiser et al38 |
+0.001
|
-0.028
|
+0.029
|
| Jackson et al24 |
-0.006
|
-0.033
|
+0.021
|
| White et al38 |
-0.005
|
-0.031
|
+0.021
|
| Lohman9 |
+0.004
|
-0.024
|
+0.032
|
| Thorland et al10 |
+0.003
|
-0.024
|
+0.030
|
| Air displacement plethysmography |
+0.004
|
-0.024
|
+0.033
|
Results from the 95% limits of agreement analyses indicated bias (systematic errors) between criterion measured whole body density (g.ml-1) and whole body densities predicted by calibration models ranged from 0.005 to 0.009 g.ml-1 and random errors ranged from 1.012 to 1.079 g.ml-1. Thirteen (13) of the 15 calibration models were normally distributed and within acceptable limits thus suggesting underestimation of whole body densities (g.ml-1) of professional football players. In contrast, 2 of the calibration models by Forsyth et al30 and Durnin et al8 found that (on average) whole body density (g.ml-1) was lower than whole body density (g.ml-1) derived from the models, so had a negative bias. Results from the 95% limits of agreement analyses indicated negative bias (systematic errors) between criterion and densities predicted by calibration models ranged from
0.009 to 0.015 g.ml-1 and random errors ranged from 1.027 to 1.090 g.ml-1 thereby indicating overestimation of whole body density (g.ml-1) of professional football players.
Figure 1 exhibits the scatter plots of heteroscedasticity to demonstrate the relationship between the criterion method of hydrostatic weighing and each calibration model. The extent to which heteroscedasticity is present in these scores can be quantified by correlating absolute differences against mean scores for calibration model and criterion method values and can be illustrated on a scatter plot of these two variables. Heteroscedasticity for all calibration models demonstrate r values ranging from -0.064 to 0.374% and R2 (%) coefficients ranging from 0.00000005 to 0.1398%. All models illustrated heteroscedastic data with deviations from the line of identity between the whole body density (g.ml-1) values.
Figure 1. Scatter Plots for the Heteroscedasticity of Hydrostatic Weighing (criterion method) Compared to (a) Durnin et al,7 (b) Sloan,31 (c) Wilmore et al32 (d) Sloan et al35 (e) Forsyth et al,36 (f) Forsyth et al,30 (g) Katch et al,33 (h) Behnke et al,37 (i) Durnin et al,8 (j) Wickkiser et al,38 (k) Jackson et al,24 (l) White et al,34 (m) Lohman,9 (n) Thorland et al,10 and (o) Air Displacement Plethysmography Calibration Model (means) for Whole Body Density (g.ml-1)
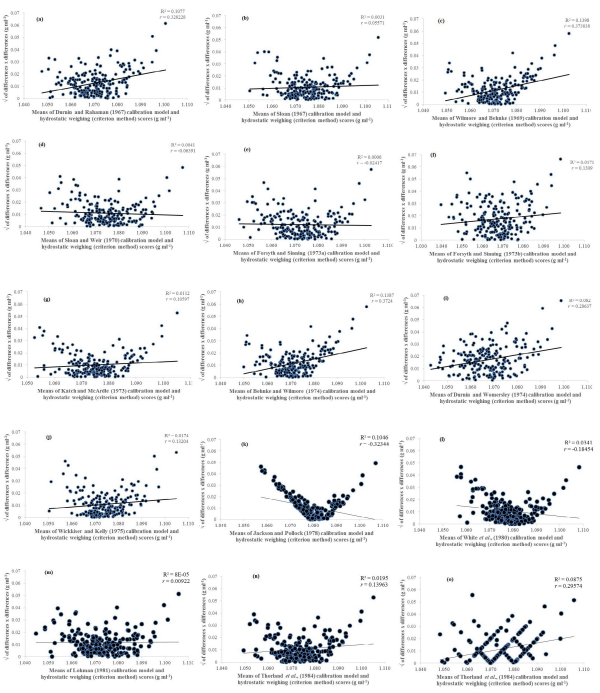
Figure 1 exhibits the scatter plots of heteroscedasticity to demonstrate the relationship between the criterion method of hydrostatic weighing and each calibration model. The extent to which heteroscedasticity is present in these scores can be quantified by correlating absolute differences against mean scores for calibration model and criterion method values and can be illustrated on a scatter plot of these two variables. Heteroscedasticity for all calibration models demonstrate r values ranging from -0.064 to 0.374% and R2 (%) coefficients ranging from 0.00000005 to 0.1398%. All models illustrated heteroscedastic data with deviations from the line of identity between the whole body density (g.ml-1) values.
Overall, 7 models indicated statistical significance of p=0.017,24,31,32,33,34 compared to 8 models which indicated a statistical significance of p=0.05.8,9,10,30,35,36,37,38 Wider deviation from the line of identity was particularly prevalent with the model developed by Sloan et al35 and Jackson et al24 and provided deviation from the line of identity and demonstrated heteroscedasticity. Furthermore, the air displacement plethysmography demonstrates an ordinal scale visual that discriminates intervals between the range, thereby not reflecting visuals like the remaining calibration models and as such can be seen as a deviation.
At this point of statistical analysis, it was worth considering the issue of heteroscedasticity and whether there is a need to find the cause and resolve it. Given that the Jackson et al24 was the only calibration model which demonstrated heteroscedasticity from Figure 1, a judgement was made not to log transform and therefore keep the data in its present condition. As there can be obvious patterns of distribution within each case, it is therefore important to obtain some clarity over the most appropriate calibration model to use. To avoid repetition when reporting outcomes, Table 4 reports the hypothetical predictions of whole body density (g.ml-1) of 1.045 g.ml-1 for each model and presented in rank order from lowest to highest in terms of differences of agreement indicators.
Table 4. Rank order of 95% Upper and Lower Limits of Agreement and Differences Indicators for (n=14) Calibration Models Plus Air Displacement Method for Whole Body Density of 1.045 (g.ml-1)
|
Calibration Models
|
Lower Limit (g.ml-1)
|
Upper Limit (g.ml-1)
|
Difference (g.ml-1)
|
| Behnke et al37 |
1.026
|
1.078
|
0.052
|
| White et al38 |
1.014
|
1.066
|
0.052
|
| Wilmore et al32 |
1.026
|
1.079
|
0.053
|
| Katch et al33 |
1.019
|
1.072
|
0.053
|
| Durnin et al7 |
1.027
|
1.081
|
0.054
|
| Jackson et al24 |
1.012
|
1.066
|
0.054
|
| Thorland et al10 |
1.021
|
1.075
|
0.054
|
| Sloan31 |
1.018
|
1.073
|
0.055
|
| Durnin et al8 |
1.033
|
1.088
|
0.055
|
| Sloan et al35 |
1.018
|
1.074
|
0.056
|
| Lohman9 |
1.021
|
1.077
|
0.056
|
| Air displacement plethysmography |
1.021
|
1.078
|
0.057
|
| Wickkiser et al38 |
1.017
|
1.074
|
0.057
|
| Forsyth et al36 |
1.022
|
1.079
|
0.057
|
| Forsyth et al30 |
1.030
|
1.090
|
0.060
|
Examination of the calibration models indicated that Behnke et al37 (lowest) and Forsyth et al30 (highest) models found there is a bias of 0.007 g.ml-1 and 0.015 g.ml-1 and 95% limits of agreement of 0.019 g.ml-1 to 0.033 g.ml-1 and 0.015 g.ml-1 to 0.045 g.ml-1 respectively.
Based on these findings, the issue is whether an error of this magnitude would detrimentally affect anything this research has to say about the participants’ whole body density (g.ml-1) derived from the chosen calibration models. In other words, could this research replace hydrostatic weighing method with the calibration model. It is important to stress that it is unlikely that the calibration models will agree exactly for estimated whole body density (g.ml-1) amongst themselves, but these findings suggest a need to provide an explanation as to why 13 calibration models (on average) under-reported and two calibration models (on average) over-reported body density for a group of professional footballers. The statistics provided here cannot answer this question. Indeed, the question that this research needed to ask is, are the 95% limits of agreement narrow enough for measurements to be of practical use.
Whilst reviewing the literature, various limitations with the design and development of their calibration models became apparent. Five main limitations were identified. Firstly, the most frequently used measures that were used as part of the components of the calibration models included the subscapular, triceps, supraspinale, iliac crest, abdominal and anterior thigh skinfolds, biacromial and biiliocristal breadths and chest and waist girths (Table 2). Yet further scrutiny found that half of the models did to incorporate of any limb measures which failed to support empirical studies and recommendations in the literature about the value that skinfolds from the lower limb account for a significantly greater proportion of variance in body fat.39,40,41 Secondly, in some instances some variables were provided as stand-alone outcomes some as a combination of summed variables, some squared or even logged (Table 2), thereby providing the outcome with a different bias and if used indiscriminately, the strength of the outcome is lost.11,12,13,42 Thirdly, too frequently the sample sizes have been too restrictive to be effective indicators of the predictive nature of the existing calibration model and therefore raises concern over its practical use.16,17 Ten studies investigated had less than n=100 participants in their sample and in some instances as low as n=50 participants. Fourthly, evidence that cross-validation has either been ignored or used on very low restrictive sample numbers can raise doubt over the models specificity and validity.4 Examination of the 14 published calibration models found that 10 failed to cross-validate their data with another sample from the population of interest, 3 crossvalidated but with other published calibration models and only one model24 cross-validated their data. The fifth limitation was arguably the inappropriate analytical methods to develop these models. Correlation coefficients and linear regression methods as indices of the equations’ validity and decisions based upon outcomes generated from employing the 95% limits of agreement analyses are the preferred analysis of choice. Furthermore, the decision to log transform heteroscedastic data has also become an area of debate, particularly when considering whether there is a need to find the cause and resolve heteroscedasticity.43
DISCUSSION
The aim of the present study was to gain some insight into the validity of estimating whole body density (g.ml-1) from 15 calibration models that already exist in the public domain by comparing them to those gathered from the criterion hydrostatic weighing method in a large sample of professional footballers. The Bland and Altman 95% limits of agreement approaches findings were too wide to state with authority that these calibration models can be used interchangeably with the criterion method to assess whole body density in professional football players. Thirteen (13) calibration models found that (on average) estimated whole body density (g.ml-1) derived from hydrostatic weighing was greater than whole body density (g.ml-1) derived from the models. Bias ranged from -0.005 to +0.009 g.ml-1 and random errors ranged from 1.012 to 1.079 g.ml-1. Furthermore, Bland et al26 95% limits of agreement approaches were used to determine heteroscedasticity. Of the 15 calibration models used within this study only Jackson et al24 model illustrated heteroscedasticity with r values of -0.323 and R2 (%) coefficients of 0.1046% and p=0.01.
Given that the Jackson et al24 was the only calibration model which demonstrated heteroscedasticity from Figure 1, a decision was needed whether to log transform all data. As there was no measurement error or reliability issues across the variables or calibration models, a judgement was made not to log transform and therefore keep the data in its present condition. Due to the obvious patterns of distribution for whole body density (g.ml-1) from 15 calibration models, a hypothetical whole body density value of 1.045 g.ml-1 was applied for each individual calibration model via limits of agreement. A rank order of 95% upper and lower limits was determined to provide an overview that would best identify the best model to use for the current population of professional footballers. The model developed by Forsyth et al30 was considered the best where bias ranged from -0.015 to +0.045 g.ml-1 with whole body density values ranging from 1.025 to 1.081 g.ml-1.
Whilst reviewing the literature, it became apparent that the researchers cited had various limitations with the design and development of their calibration models. Nonetheless, what is questionable is the reason why the literature does not have any calibration models to estimate whole body density (g.ml-1) available for professional football players, especially given the popularity and income generation with the sport. Generally speaking, results indicated that most models that were used had high reliability values, but exploitation of whole body density values occurred with severe underestimation of whole body density (g.ml-1) of professional footballers, thereby raising doubt over the validity of such calibration models for use within the current population. Therefore, sport scientists that are cognisant that calibration models have the potential to provide an insight into players’ body composition, thus contributing towards the optimisation of performance potential.44 Yet, in reality there are no hard-set rules on what calibration models to use for a specific population sample, but care must be taken by the sport scientist when selecting an appropriate calibration model for application in a professional football context by considering the most appropriate criteria about what constitutes practical significance. For instance, by considering (i) circumstances of initial validation and any collinearity issues (ii) a large enough sample size even after the division of gender and age groupings and (iii) at least 9 variables per participant.6,20,21
In essence, the 95% limits of agreement of this study’s findings were not narrow enough for measurements to be of practical use. In most instances, the error (the disagreement) was too great, and as such it would be detrimental to what this study can conclude about professional players’ whole body density (g.ml-1). Therefore, there is a need to develop a sport specific calibration model for use with professional football players which is both warranted and desirable.2,42 Moreover, new models should ideally be based on measures from large sample sizes and these should also include the entire playing spectrum of football players and above all, decisions about the calibration model’s specificity should be established with reference to sound research principles such as crossvalidation procedures.
DECLARATION OF INTEREST STATEMENT
N/A.
CONFLICTS OF INTEREST
The authors declare that they have no conflicts of interest.


