INTRODUCTION
Anthropometry is an important way to evaluate a child’s growth pattern. The measurement of sitting height helps to define body proportion. Every country should have its own normal data and use it as a national reference.1 These may even have to be ethnic-specific. In assessing body proportion for the reference charts of sitting height (SH), sub ischial leg length (SILL) and the sitting height/leg length ratio (SH/SILL) are useful tools for clinicians and researchers in related areas.2 In the evaluation of body proportions the dependency of the SH/H ratio (SDS) on height SDS has to be taken into consideration in exceptionally short or tall children.3 The ratio of sitting height to height (SH/H) related to age is widely used as a method of judging body proportions. There may be a drawback of this method that only one derived variable is used and a pair wise consideration of the original measurements provides more information.4
Auxological studies are considered as an important tool utilized in clinical diagnosis of SHOX haploinsufficiency in school children.5 This is often used to detect the presence of abnormal growth especially in school-aged children the measurement of upper lower segment ratio is a component of growth anthropometric measurement in children.6 In school age children, the change of upper lower segment ratio which leads to the abnormal body proportions can affect psychological aspect.7 The measurement of upper lower segment ratio is affected by several factors, such as age, gender, and race that can affect the measurement of upper lower segment ratio.6 The upper lower segment ratio in obese and normal children may not always be dissimilar in different ethnic groups as reported in a study among the Indonesian children aged 7 to 10-years of age.8 New centile curves as the new British reference after studying 2632 boys and girls from Southeast England was proposed by Dangour and others.9 In a longitudinal study for 3 consecutive years among the individuals from Toronto and London, Ontario, Canada, showed that, short leg length, a marker of early childhood deprivation, may increase the risk of developing diabetes.10 In a study on the effects of socio-economic factors on secular trends among the Bengali school aged children it is noticed that height (Ht), SH, SILL and other traits have positive secular trends which are pronounced among boys and also the increase in SILL has contributed more than Upper (upper trunk length (UTL)) trunk length.11 There is the evidence of selecting the female skaters for competitive level depending on their various body segments like Ht, SH, SILL, UTL and various ratios in USA.12 The leg length (SILL), one of the components of total height may be associated with cancer, the taller the individuals, higher the risk.13
Objectives
The objective of the present study was to study the age variations and sexual dimorphism in linear body segments among the Bengalee pre-school children from Arambagh, West Bengal, India.
MATERIALS AND METHODS
The Locality
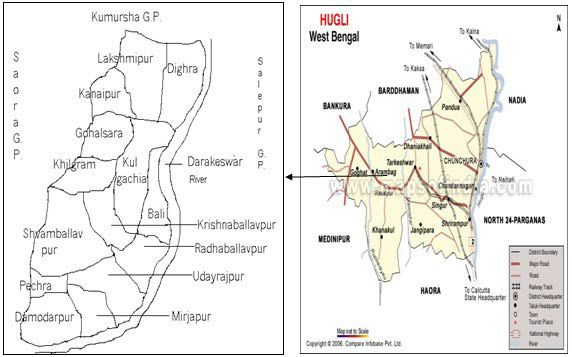
The area of the present cross sectional study was remotely located villages under Bali Gram Panchayat, Arambagh, Hooghly District, West Bengal, India (Figures 1a and 1b). The majority of inhabitants were Hindus. The data was collected from 20 Integrated Child Development Service (ICDS) centers, commonly known as “Anganwadi”, which provides food supplementation to these children, in the form of porridge.
Figure 1a. Political Maps of India and West Bengal
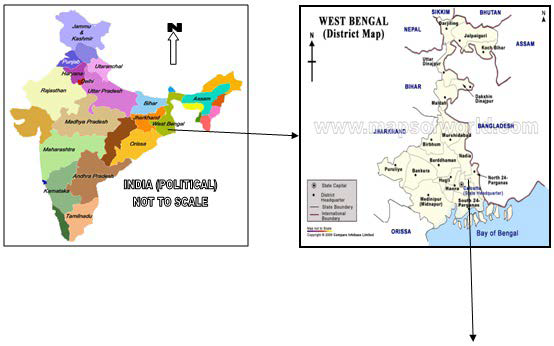
Figure 1b. Political Maps of Hugli District and Bali-Gram Panchayat
The Participants
A total of 1012 children (boys=498; girls=514) aged 2-6-years were measured. Age and ethnicity of the subjects were verified from official records. All the subjects were of Bengalee ethnicity.
Anthropometric Variables
The anthropometric data collections were carried out by the first author (GCM) following standard method.14 Height and sitting height vertex were measured using Martin’s anthropometer to the nearest 0.1 cm; weight was measured using a weighing machine to the nearest 100 g. The SILL was derived from subtracting sitting height vertex from total height. The UTL was calculated by subtracting the SILL from total height. The percentages of these two derived variables (SILLP & UTLP) were estimated in terms of the % ratio of the total height. The Body Mass Index (BMI, kg/m2 ) was calculated by standard formula: Weight (kg)/Height (m2 ).15
The technical error of measurements (TEM) was calculated for height and sitting height vertex and they were found to be within reference values as given by Ulijaszek and Kerr.16 Thus, TEM were not incorporated in any analyses.
Statistical Analyses
The t-test and analysis of variance (ANOVA) were undertaken to determine sex differences and age variations, respectively. Pearson’s correlation coefficient (r) were used to study the association between BMI and different variables, The statistical analyses were undertaken using statistical package for the social sciences (SPSS), version 16.0. Statistical significance was set at p<0.05.
Table 1 presents the mean (SD), sex differences, and age variations of the variables among the children studied. Except in a few age groups, there were no significant sex differences. There was no significant sex difference (age combined) in any of the variables. In case of SILL, significant sex difference was found in the age groups 2-years (t=2.4; p<0.05) and age group of 4-years (t=2.8; p<0.01). Whereas considering the UTL, significant sex difference was noticed only in the age group of 4-years (t=3.3; p<0.01). On the other hand, SILLP and UTLP displayed significant sex difference in age group of 3-years. All the variables displayed highly significant age variations. Moreover, from this table it is also evident through ANOVA that the anthropometric variables increased with age. For example, SILL, SILLP and Ht for boys (F= 221.6, F=9.23 and F=266.11; p<0.001) and among girls (F=286.8, F=8.32 and F=321.06; p<xz0.001), respectively.
| Table 1. Mean (SD), Sex Differences and Age Variations of the Variables among the Studied Children |
|
Variables
|
Sex |
Age in Year |
Age Combined |
F |
| 2 |
3 |
4 |
5 |
6
|
|
SILL (cm)
|
Boys |
37.9 (2.6) |
40.6 (4.2) |
45.0 (2.7) |
47.0 (3.2) |
49.4 (2.4) |
43.5 |
221.6*** |
|
Girls
|
36.4 (4.1) |
40.7 (2.9) |
44.0 (2.6) |
46.7 (2.5) |
49.3 (3.2) |
43.2 |
286.8***
|
| t |
2.4* |
-0.14 |
2.8** |
0.89 |
0.17 |
0.79 |
|
|
SILLP
|
Boys |
44.9 (1.5) |
44.5 (2.6) |
45.5 (1.1) |
45.6 (1.6) |
45.84 |
45.2 |
9.23*** |
|
Girls
|
44.5 (3.0) |
44.9 (1.3) |
45.5 (1.1) |
45.4 (1.0) |
45.72 |
45.2 |
8.32***
|
| t |
1.1 |
5.6* |
0.22 |
45.4 |
0.49 |
-0.06
|
|
|
UTL (cm)
|
Boys |
46.2 (2.9) |
50.4 (302) |
53.8 (208) |
56.1 (2.9) |
58.4 (3.1) |
52.6 |
221.6*** |
|
Girls
|
45.2 (3.7) |
49.8 (2.9) |
52.7 (2.7) |
56.1 (2.2) |
58.5 (3.1) |
52.3 |
286.8***
|
| t |
1.9 |
1.4 |
3.3** |
0.56 |
-0.22 |
1.0
|
|
|
UTLP
|
Boys |
55.1 (1.5) |
55.4 (2.6) |
54.4 (1.1) |
54.4 (1.6) |
54.2 |
54.8 |
9.23*** |
|
Girls
|
55.5 (2.9) |
55.1 (1.3) |
54.5 (1.1) |
54.6 (1.1) |
54.3 |
54.8 |
8.32***
|
| t |
1.1 |
5.6* |
-0.22 |
-0.92 |
0.48 |
0.06 |
|
|
HEIGHT (cm)
|
Boys |
83.7 (5.0) |
90.9 (6.3) |
98.8 (5.1) |
103.1 (5.3) |
107.9 (4.9) |
96.1 |
266.11*** |
|
Girls
|
81.6 (6.7) |
90.6 (5.5) |
96.7 (4.8) |
102.8 (4.3) |
107.9 (5.5) |
95.5 |
321.06***
|
| t |
2.429* |
0.489 |
3.8** |
0.6 |
0.035 |
0.93
|
|
| *=p<0.05; **=p<0.01; ***=p<0.001 |
The correlation coefficient of BMI with SILL, SILLP (%), UTL and UTLP (%) among boys are shown in Table 2. We observed that SILL (r=-0.443), UTL (r=-0.346) and SILLP (r=- 0.302) were significantly (p<0.01) negatively correlated (age combined). However, UTLP was significantly positively correlated (r=0.302; p<0.01) with BMI.
| Table 2. Correlation Coefficient (r) of BMI with SILL, SILLP (%), UTL and UTLP (%) among Boys |
|
Age
|
SILL |
SILLP |
UTL |
UTLP
|
|
2
|
-0.243* |
-0.133 |
-0.147 |
0.133 |
|
3
|
-0.431** |
-0.315** |
-0.273** |
0.315** |
|
4
|
-0.343** |
-0.088 |
-0.342** |
0.088 |
| 5 |
-0.314* |
-0.356** |
-0.007 |
0.356**
|
| 6 |
-0.193 |
-0.269* |
0.068 |
0.269*
|
| Overall |
-0.443** |
-0.302** |
-0.346** |
0.302**
|
| *=p<0.05; **=p<0.01 |
Table 3 displays the correlation coefficients of BMI with these four variables among girls. All the variables displayed significant (age combined) correlations (p<0.01). The SILL, SILLP and UTL showed negative correlations (r=-0.442, -0.358 and -0.349, respectively). Interestingly, UTLP displayed positive correlation (r=0.358).
| Table 3. Correlation Coefficient (r) of BMI with SILL, SILLP ( %), UTL and UTLP (%) among Girls |
|
Age
|
SILL |
SILLP |
UTL |
UTLP
|
|
2
|
-0.632** |
-0.570** |
-0.200 |
0.570** |
|
3
|
-0.348** |
-0.149 |
-0.306** |
0.149 |
|
4
|
-0.263** |
-0.032 |
-0.275** |
0.032 |
| 5 |
-0.119 |
-0.048 |
0.112 |
0.048
|
| 6 |
0.321** |
-0.120 |
-0.267** |
0.120
|
| Overall |
-0.442** |
-0.358** |
-0.349** |
0.358**
|
| **=p<0.01 |
Table 4 shows the correlation coefficient of SILL with UTL and UTLP among the participants. It is evident from this table that, SILL was highly correlated with UTL (boys, r=0.821 and girls, r=0.871; p<0.01), and UTLP in both sexes. It was positively correlated in case of UTL (boys, r=-0.590 and girls, r=-0.552; p<0.01) whereas, negatively correlated in case of UTLP in both sexes.
| Table 4. Correlation Coefficient (r) of SILL with UTL and UTLP among the Participants |
|
Age
|
BOYS |
GIRLS |
| UTL |
UTLP |
UTL |
UTLP
|
|
2
|
0.620** |
-0.508** |
0.496** |
-0.717** |
|
3
|
0.450** |
-0.788** |
0.704** |
-0.609** |
|
4
|
0.716** |
-0.549** |
0.689** |
-0.522** |
| 5 |
0.495** |
-0.685** |
0.638** |
-0.685**
|
| 6 |
0.548** |
-0.432** |
0.594** |
-0.620**
|
| Overall |
0.821** |
-0.590** |
0.871** |
-0.552**
|
| **=p<0.01 |
DISCUSSION
Anthropometric measurements were used for various purposes– be for studying growth patterns, identifying sexual dimorphism, assessing nutritional status, body composition, relation to various physical as well as metabolic diseases and so on. Here also we have tried to study the age variations and sexual dimorphism in linear body segments among children aged 2-6-years of Bengalee ethnicity from Arambagh, West Bengal, India. There were no significant sexual dimorphisms between the boys and girls in most of the age groups as well as in most of the anthropometric variables. This resembles with a study among the Chinese children where it was noticed that there were no sex differences before the age of 11-years.2 Unlike these, there were sex differences in favour of males in SILL and St Ht among the individuals from London, Toronto and Canada and there was significant correlation between SILLP10. The study among the individuals from Naxalbari, Darjeeling District, West Bengal, India revealed the identification of sex from SILL and other anthropometric measurements.17
Considering the effect of increasing age has positive association (p<0.001) with that of all the variables among the children studied. The same result was evident from the study among the 6-12-years aged Bengalee school boys where variables like Ht, SILL, St Ht have positive significant correlation.18 More or less the same result was reported from a study among the primary school children of the Bengali ethnicity of Hooghly District, WB, India, where Ht and St Ht showed significant sex differences, but not in case of SILL. Furthermore, in the same study ANOVA represented the positive association of Ht, St Ht and SILL in both sexes with the increase of the age.19 However, children having the history of sickle cell anemia revealed the negative significant correlation between age and St Ht and SILL. It is noticed among the children from Lagos, Nigeria.20
Height is a component of calculating the BMI and thus, it has a close relationship with the different segments of the body whether be it UTL or SILL. In our present study the correlation of BMI with the variables showed significant level in both the boys and girls except in case of UTL of boys when sex combined was taken into account. Although, except UTLP, other three variables showed negative correlation. Among the longer legged individuals the BMI underestimates the overweight and obesity, whereas, in the reverse case, that is among the shorter legged overestimates the obesity depending on BMI.21 In a study done among the children, adolescents and young adults from America it was found that, the UTL be a better predictor of BMI than SILL.22 The SILL may be a good indicator of the quality of environment for growth in infancy.23 Ratio of various body segments such as Ht and SILL or UTLP and SILLP showed positive correlation among the Turkish children aged 3-18-years.24 Here also SILL was correlated at a highly significant level with UTL and UTLP among both the boys and girls where, UTL showed positive correlation but UTLP negatively correlated.
India is a land of vast ethnic heterogeneity. Our study was conducted among only one ethnic group, Bengalees. Future studies should investigate age-sex variations as well as the interrelationships of BMI with SIIL, SILLP, UTL and UTLP among other ethnic groups in India to determine if similar results are obtained. It is possible that in many ethnic groups the interrelationships may be different. Thus, these variables can be potentially used to study human population variation. These subsequent results obtained from these studies may have immense applications in biological anthropology, human population biology and pediatrics.
CONCLUSION
Our results suggest that, in both sexes, there were significant age differences in SILL, SILLP, UTL and UTLP. The BMI had significant associations with these variables in both sexes. Moreover, SILL had significant correlation with UTL and UTLP among the participants.
ACKNOWLEDGEMENTS
All subjects who participated in the study are gratefully acknowledged. Special thanks are due to the ICDS authorities of these centers. Gopal Chandra Mandal received financial assistance in the form of a Minor Research Project from the University Grants Commission, Government of India.
CONFLICTS OF INTEREST
The authors declare that they have no conflicts of interest.


