INTRODUCTION
Fluid overload is an independent risk factor for morbidity and mortality in both adult and pediatric critically ill patients.1,2 However, measuring fluid overload is not consistent nor dependable. Gold standards for fluid overload assessment, such as air displacement plethysmography3 or bromide and deuterium dilutions4 are impractical in the clinical setting as they require specific devices, specific expertise, and are time-consuming, which has led to these techniques being mainly used for research purposes. Weights and measurements of total fluid balance have been used as a surrogate marker; however, these are known to be inaccurate.5 Specific physical exam findings (e.g. edema, mentation, capillary refill), static and dynamic vital signs (e.g. blood pressure, pulse, changes in variables with fluid administration or respiratory cycle), imaging modalities (e.g. echocardiography, lung ultrasound, chest X-ray), and laboratory data (e.g. fractional excretion of sodium/urea, blood lactate, mixed venous oxygen saturations) have been used for fluid evaluation but have large variability in assessments.6
Bioimpedance analysis (BIA) is a form of fluid assessment that has been used to evaluate total body water volume (VTBW), intracellular water volume (VICW), and extracellular water volume (VECW) and has been studied for over the last 5 decades.7 There are three major techniques of measuring BIA: Single Frequency (SF), Multi-frequency (MF), and Bioimpedance Spectroscopy (BIS). Each of these methodologies uses different equations and theories to derive fluid status, and therefore have inherent variations in fluid volume estimations.8 The few who have evaluated their accuracy found strong inverse associations between estimated VTBW(eVTBW) as assessed by BIA and net ultrafiltration volume(VUF,net), with VUF,net explaining 92-99% of variability in VTBW measurements.9,10 Although studies have been performed that compare BIA to other existing technologies, there are few studies comparing various BIA methods with each other.11 Most of these latter comparisons were associated with assessing nutritional status rather than fluid overload as their primary outcome.11
Our objective was to measure serial static body fluid volumes as estimated by each BIA modality, and then to explore the correlations between these derived volume changes and VUF,net or changes in body weight (ΔWt) thus assessing their validity in measuring changes in fluid status.
MATERIALS AND METHODS
Study Population
In order to accurately compare bioimpedance modalities, we required a patient population that demonstrate quantifiable fluid shifts over a short clinical period. End stage renal disease (ESRD) patients in general have difficulties with fluid accumulation and require discrete amounts of fluid removal to maintain euvolemia.
Patients were recruited and enrolled at the Virginia Commonwealth University (VCU) Adult Chronic Dialysis Center and Pediatric Dialysis Center (Richmond, Virginia, USA), a tertiary care center which represents a medium-sized urban area population.
Inclusion criteria were patients with ESRD, age greater than 36-months, requiring at minimum two weekly sessions of dialysis, who are anticipated to require at least a month of dialysis, based on attending physician’s assessment. ESRD was defined as requiring dialysis, but not based on a specific glomerular filtration rate. Exclusion criteria were 1) patients who refused to participate in the study; 2) patients with implanted medical devices such as pacemakers or defibrillators, as these could interfere with assessments; 3) patients who were pregnant at the time of enrollment (assessed by date of last menstrual period), 4) patients with limb amputations (not accounted for in equations for BIA); and 5) patients who have significant abrasions or dermatologic conditions not allowing proper placement of electrodes.
This protocol was approved by VCU’s Institutional Review Board (HM20012398). As the BIA devices were not approved by the Food and Drug Administration (FDA) for clinical use in non-healthy populations, and some were not approved for use in children, we also obtained a non-significant risk (NSR) investigational device exemption (IDE). All patients signed informed consent.
Study Design
This is a single-center prospective observational study comparing estimated changes in volume before, during, and after dialysis as measured by three standard bioimpedance modalities, against fluid removal during scheduled hemodialysis sessions.
For each session we obtained a pre-dialysis weight, blood pressure, heart rate, and temperature. Ambulatory patients were weighed using a Scale-Tronix, 5702 Mobile Bariatric Standing Scale (Hillrom, Chicago, Il, USA). Immobile patients had weights obtained with a Hill-Rom, VersaCare Bed Scale (Hillrom, Chicago, IL, USA). Weights were expressed in kilograms (kg). Ambulatory patients had heights obtained using a stadiometer. Standard methods of weight and height measurement were used, shoes were taken off, and feet were placed together, with the patient’s back against the wall. Immobile patients had heights obtained using a standardized 4 point measurement method12: measurements were obtained by adding the collective distances from vertex of the head to the medial end of the clavicle, lateral aspect of shoulder to anterior superior iliac spine, anterior superior iliac spine to lateral aspect of knee joint, and the lateral aspect of knee joint to sole of foot. Heights were expressed in centimeters (cm).
Patients were randomized for order of baseline BIA measurements with all three devices (loaned to us by the manufacturers), representing the three major modalities of BIA: 1) SF: Quantum V SF BIA (RJL Systems, Clinton, MI, USA), 2) MF: S10 BWA (In Body, Seoul, South Korea), 3) BIS: SFB7 BIS (ImpediMed, Brisbane, Australia). Sequence of measurements were randomized and predetermined prior to assessments by random number generation via Excel (Microsoft, Redmond, WA, USA), in a sealed envelope. All machines were used according to their manufacturer’s specifications with patients in supine position if in a bed and patients in recumbent position if in a dialysis chair. Patients were made to maintain this position for at minimum 5 minutes prior to measurements. Placement of leads was standardized per manufacturer recommendations and research staff were trained on proper lead placement. Leads were removed between each measurement. Assessments took on average approximately 5 minutes each. The device that was randomized to be the third to be assessed was left on for the duration of the dialysis run (Figure 1). We obtained measurements in 30 minute intervals during the dialysis run. As the machines require a weight input to calculate estimated volumes, initial BIA measures and all the interval measures are based on the initial weight. During the 30 minute intervals, hematocrit as assessed by Crit-line In-line Monitor (In-Line Diagnostics, Kaysville, UT, USA), clinical assessment of volume was assessed based off symptoms (cramping, nausea, dizziness, abdominal pain, etc.), interval VUF and VUF,net were recorded, and routine vital signs were obtained. Post-dialysis weight, blood pressure, heart rate, and temperature were obtained. Post-dialysis BI measurements were obtained with all three devices, with another randomized order of assessment. Time from blood rinse-back to post dialysis BI measurements was recorded to ensure average times were similar (to balance the reduced error from prolonged equilibration). Measurements were obtained using manufacturer specifications in the same position as they were previously measured during the assessment. After the study enrollment period had finished, the data was reviewed, and two patients were found to have systematic errors during the interval measures (one for SF, the other for MF) and were thus excluded from the 30 minute interval analysis.
Figure 1. Visual Protocol
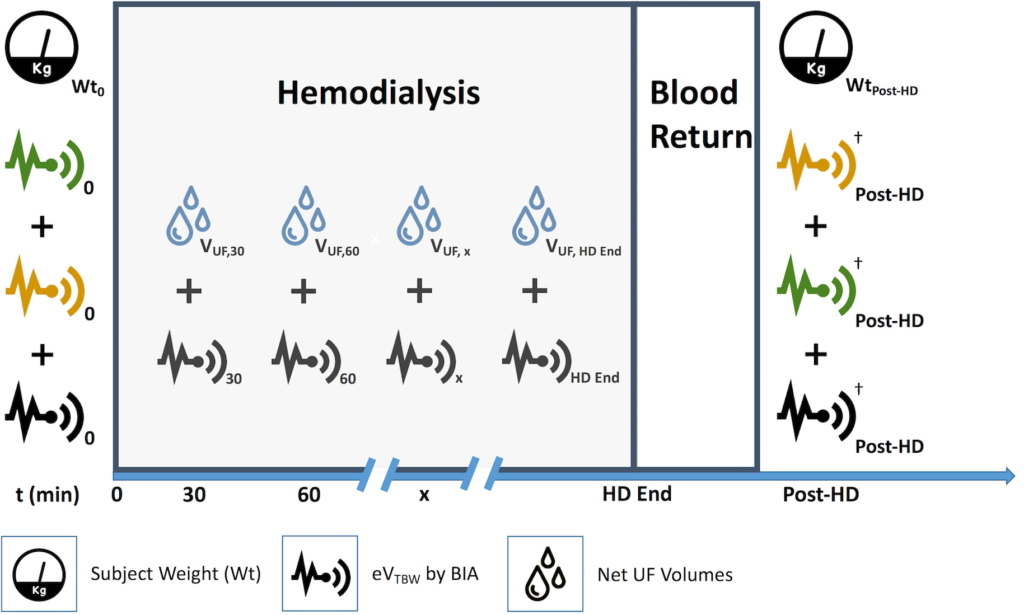
Patients were weighed prior to their initial analysis with all three methods. In this situation, the patient was randomized to bioimpedance device #3 for interval analysis. Volume measurements using device #1 and device #2 were performed, then device #3 was performed and left on for the duration of the hemodialysis run using the initial weight (Wt0) input for the interval measurements. Ultrafiltration volumes were obtained for the corresponding time intervals (VUF,t). Following hemodialysis, the three devices were reassessed based on predetermined, random order.
†Measurements with each BIA Methods were performed using WtPost-HD
1. Outcome, Net Changes: ΔWt vs total change in estimated total body water volume (ΔeVTBW, total).
2. Outcome, Interval Changes: VUF,t vs interval ΔeVTBW,t
Outcomes
Our primary outcome was the change in bioimpedance by each modalitye VTBW measured just before and just after dialysis, and ΔVTBW, as measured by the VUF,net, both measured in Liters.
Our secondary outcome was 30 minute interval ΔeVTBW, as measured by BIA during dialysis and amount of VUF,net assessed every 30 minutes, all measured in Liters.
We also recorded the gender, age (in months), race, ethnicity, cause of ESRD, duration of ESRD, anuric status, and diuretic use.
Statistical Analysis
We report the ΔeVTBW, ΔWt, and change in VUF,net as [final measure–initial measure].
The accuracy of the three BIA devices was assessed by three methods:
(1) The proportion of values where the difference between the ΔeVTBW for each BIA modality and the ΔWt was a) less than 10%, and b) less than 20%.
(2) The correlation between the ΔeVTBW for each BIA modality and the ΔWt; we considered, a priori, a good correlation defined by a Spearman R>0.8.
(3) A Bland-Altman plot, to report the mean bias and 95% confidence limits of agreement between the two methods.13 For each device, we plotted the average between ΔeVTBW and ΔWt, against the difference between ΔeVTBW and ΔWt. We then applied a linear regression to evaluate for potential proportional errors.14
The accuracy of trends over 30 minute periods was assessed by plotting the ΔeVTBW measures taken 30 minutes apart against the VUF,net during those same 30 minutes. The individual 30 minute interval measures should reside within standard graphical quadrant IV, thus indicating a decrease in VTBW when the VUF was positive. The percentage of data points that lie within these confines will be considered the minimum tolerable concordance (MTC). We used a linear regression model to adjust for the potential effect of the different times (e.g. 0 to 30 minutes vs 120 to 150 minutes).
Linear modeling analyses were performed with SAS version 14.3 for Windows (SAS, Cary, NC, USA). All other statistical analyses were performed with Statistical Package for the Social Sciences (SPSS) version 24 for Windows (SPSS, Chicago, IL, USA).
Sample Size
As there is no preliminary data to allow for a sample size calculation, we based our calculations on an α of 0.05, a β of 0.1 (i.e. 90% power), and an anticipated R of 0.5, which allowed us to determine we needed a minimum 38 independent measures to demonstrate that the correlation coefficient differs from zero. As the three devices were loaned to us for a period of seven-months, we aimed to enroll as many patients as possible.
RESULTS
From September 1, 2018 to March 31, 2019, a total of 24 patients were enrolled in the study, with a total of 30 measures. The median age was 42.4 years-old (IQR 23.1; 58.7). Demographic data and associated summary statistics are presented in Table 1.
| Table 1. Patient Demographics and Summary Statistics |
| Gender |
Male: 19/24 (79%) |
| Age |
42.4 years (IQR 23.1; 58.7) |
| ESRD Duration |
3.9 years (IQR 0.1; 4.9) |
| Anuric State |
Yes: 11/24 (46%) |
| Diuretic Use |
Yes: 5/25 (25%) |
| Ethnicity |
Hispanic: 8/24 (33%) |
| Non-Hispanic: 16/24 (67%) |
| Race |
Caucasian: 5/24 (21%) |
| African American: 12/24 (50%) |
| Native American: 1/24 (4%) |
| Other: 6/24 (25%) |
| ESRD, End Stage Renal Disease; IQR, Interquartile Range |
For each dialysis run, VUF,net was strongly correlated with the ΔWt, with a Spearman correlation coefficient of 0.94.
Overall Accuracy
We assessed the percentage of measures of ΔeVTBW that were within a 10% margin of the ΔWt for each modality (SF, MF, BIS). These were 4%, 14%, and 4%, respectively. The percent of measures within a 20% margin of the ΔWt, were also performed and found to be 11 %, 18%, and 18%, respectively.
Correlations and Bland-Altman analyses were performed for ΔeVTBW with each modality, SF, MF, and BIS respectively.
There was a poor correlation between ΔeVTBW with each modality (SF, MF, BIS) and ΔWt with R=0.15, 0.41, and 0.38, respectively (Figure 2).
Figure 2. Correlation between ΔWt and ΔeVTBW as Measured by each Modality before and after Hemodialysis
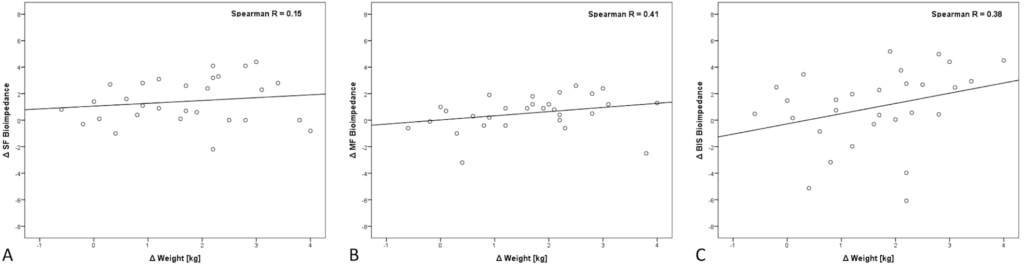
Panel A: SF (Single-Frequency), Panel B: MF (Multi-Frequency), Panel C: BIS (Bioimpedance Spectroscopy).
For the Bland-Altman analyses for SF, the mean bias was -0.23 L with a 95% confidence limit of agreement from -4.1 to 3.5 L (Figure 3A). A regression line was fit to assess for proportional error and was found to have a slope of 0.54. For MF, the mean bias was -1.1 L with a 95% confidence limit of agreement from -4.1 to 1.9 L (Figure 3B). The associated regression line for the data was found to have a slope of 0.17. For BIS, the mean bias was -0.6 L with a 95% confidence limit of agreement from -6.1 to 4.8 L (Figure 3C). The associated regression line for the data was found to have a slope of 0.88.
Figure 3. Bland-Altman analysis for ΔWt and ΔeVTBW as Measured by each Modality before and after Hemodialysis
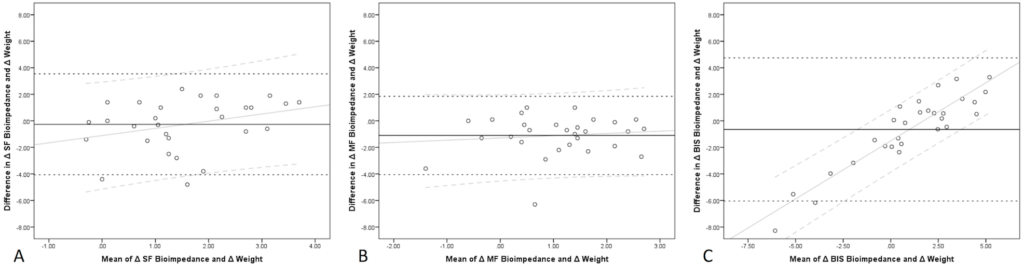
Panel A: SF (Single-Frequency), Panel B: MF (Multi-Frequency), Panel C: BIS (Bioimpedance Spectroscopy).
Accuracy over 30 minute intervals
Concordance analysis was performed for 30 minute intervals comparing ΔeVTBW and VUF,net (Figure 4). For SF, the correlation was very poor (R=0.004, p=0.97) for a total of 82 paired measures; the associated MTC was 63.4%. For MF, the correlation was very poor (R=-0.15, p=0.26) for a total of 58 paired measures; the associated MTC was 61.8%. For BIS, the correlation was very poor (R=0.09, p=0.51) for a total of 62 paired measures; the associated MTC was 53.6%. Overall trend of results remained unchanged when adjusting for the time-point using linear regression modeling.
Figure 4. Correlation between VUF,net and Δ eVTBW as Measured by each Modality. VUF,net and Δ eVTBW were Computed for Serial 30 min Intervals; thus, each Point Corresponds to One Interval
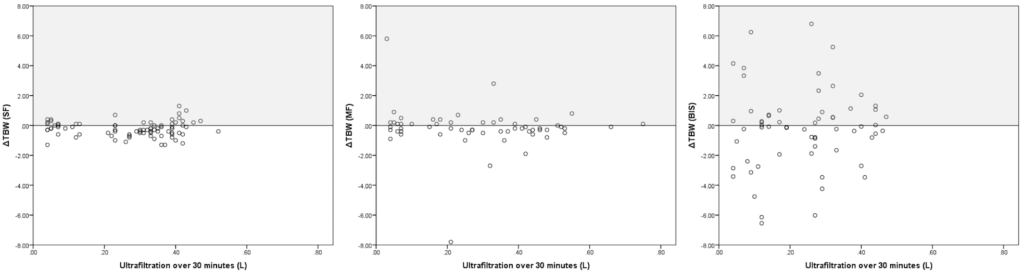
Panel A: SF (Single-Frequency), Panel B: MF (Multi-Frequency), Panel C: BIS (Bioimpedance Spectroscopy).
Equilibration Times per Modality
The median time to measurements post blood return was 26.5 min overall with no significant difference with each type of modality (SF 25.9 min, MF 27.7 min, BIS 25.9 min, p=0.97).
DISCUSSION
Our results suggest that estimations of fluid volumes using bioimpedance regardless of modality are not accurate or precise in capturing true volumes removed during hemodialysis. Correlations between ΔeVTBW and VUF,net were poor with the best being associated with MF BIA and having a Spearman R of only 0.41 (i.e. R squared=0.17), meaning that only 17% of the changes in BIA is explained by a change in fluid status.
Bland Altman analysis for each modality show moderate mean biases (least bias was for SF:-0.23 L) and poor limits of agreement (best limit of agreement was for MF:±2 L). On average all of the modalities underestimate the volume removed based on ΔWt during hemodialysis demonstrating lack of accuracy. Furthermore the 95% confidence limits of agreement are very large suggesting a significant lack of precision. Simple linear regression lines added to the Bland Altman analysis suggest that there was significant proportional error associated with BIS measurements.
Concordance analysis performed for the 30 minute intervals showed that all three devices lack clinical utility. For a given unit decrease in eVTBW, there should be a correspondent unit of increase in VUF,net for any given time interval. Deviations from this pattern suggests problems with measurement technique or external sources of error (e.g. unaccounted fluid volumes being administered or removed from the system). All fluids consumed or lost were accounted for in interval VUF,net values, and insensible losses were deemed minimal over a 30 minute period. Therefore, we assume deviations are solely from failure of the instrument to measure the intended quantity or are due to measurement technique errors. The best MTC was only 63.4% for MF. Correlation coefficients also show poor fit, the best correlation being R=0.21 (for MF).
Other studies that have compared the three major modalities of BIA, with regards to fluid assessment, have had some inherent issues with nomenclature. Studies have grouped MF and BIS into one category.15 Both of these modalities use multiple frequencies, however, the methods of analysis and equations to derive ECF and ICF are different. Studies have been performed that have compared the two modalities (MF and BIS), and have concluded that there are differences in the assessment techniques.16
Conversely, some authors have shown BIA to be a reliable tool to assess fluid overload. Torterüe et al has shown BIA to be more reflective of hydration status assessments on dialysis than IVC measurements with ultrasound assessment.9 Hur et al has shown bioimpedance to more accurately assess dry weights in dialysis patients when compared to clinical assessments.10 The use of BIA showed reductions of LVMI, average BP, and BP medication burden, without resultant issues of hypotension.10 However, the lack of accuracy we report might be explained by our objective to identify small changes in fluid status, well-below the threshold to detect preload dependency9 or change in vital signs.10 Studies often citing the validity of bioimpedance as a method of measuring fluid status were not truly assessing the ability of the instruments to obtain repeated accurate evaluations. For example, Ho et al10 assessed the validity of bioimpedance to measure fluid status in hemodialysis patients by comparing the change in bioimpedance measurements to deuterium dilutions during a single session.17 Although they showed an absolute error of 5.9%, the denominator was the total body water as determined by deuterium dilution, not the fluid changes during dialysis. Most experts suggest using Bland-Altman Analysis to compare two measurement techniques, as this is the only way to assess systematic bias, accuracy, proportional errors, variation based on magnitude of measurements, while not being depended on individual measurement characteristics.14 Other assessments are not adequately able to characterize these biases. In addition, it is important to define the concept of precision, as some authors will use a large denominator (like Ho et al10), which will lead to a small error, while we used the proportional change from one time point to the other, which will unmask imprecision.
With regards to our findings, several limitations must be recognized. First, we were unable to enroll the number of patients required to achieve appropriate power. Given the significant discrepancies in measurements from BIA compared to VUF and ΔWt, we would not expect that the addition of 14 patients would lead to a dramatic improvement in accuracy. Second, given that the instruments used for this study were supplied by the individual companies, there is always the concern for industry sponsored risk of bias. There was no financial support given by any of the companies involved in the study, devices were returned upon completion of the study, and the companies did not see the manuscript prior to publication. Third, concerns could arise from the fact that interval analysis was based off of the initial weight input. Clinically it is impractical to weigh patients during their dialysis sessions, and in many clinical settings outside of dialysis, there are often scenarios where it is not feasible to obtain serial weights for analysis. Other studies have reported interval changes with adjusted weight inputs based off cumulative ultrafiltration.8 This dependence would suggest that the output is more reflective of the weight input than the intended measurements obtained from the machines further supporting that this method lacks clinical significance. Further research in other biometric parameters (BSA, BMI, Nutritional Status, etc.) to enhance BIA modeling could yield better results. And fourth, there are potential difficulties with appropriate fluid assessment after hemodialysis due to fluid shifts, which is why we reported total body water estimations. We also made sure there were no differences in the time between the end of the dialysis and the final measure for each modality.
CONCLUSION
In summary, this study demonstrates that the accuracy of bioimpedance analysis with regards to evaluating fluid status lacks precision and accuracy, regardless of modality used. Newer technological advances in the field could lead to improved measures, but at this time, the technology seems to be lacking clinical relevance.
ACKNOWLEDGMENTS
Devices were lent by manufacturers, who also provided the device-specific leads. However, the manufacturers were not involved in the design of the trial and were unaware of the results prior to publication.
CONFLICTS OF INTEREST
The authors declare that they have no conflicts of interest.


