INTRODUCTION
“The Bignetti Model” (TBM)
“The Bignetti Model” (TBM) is a comprehensive approach that considers cognition as a pure neurobiological process (see Appendix). In TBM, Self and Free Will (FW) are self-feeding illusions of the mind with a functional role in cognition.1,2,3,4,5,6,7
In the past, the discussion on TBM has been conducted on a purely theoretical basis; now, the theory needs to be validated applying a suitable experimental approach. The main TBM’s feature that must be challenged is: individual reactions to “repetitive” stimuli should become increasingly efficient, due to an ongoing learning process. On the other hand, if different stimuli are introduced in the previous sequence, just as distractors of the ongoing learning process, action-decision making should be slowed down.
Psychophysical methods mostly investigate the reaction time (RT) of a subject exposed to a well-known physical signal. RT is considered a basic measure of mental processing speed. With the advent of experimental psychology in the 19th century, Ebbinghaus8 established that the learning process occurring in a problem-solving paradigm undoubtedly works alongside with experience. Since Ebbinghaus,8 problem solving has been evaluated using the “learning curves”, psychophysical methods still remain valuable tools to investigate a learning process in a subject exposed to a specific experience.
According to both TBM features and hints from psychophysical bibliography, a “press/no-press” visual test was set up. If preliminary results reveal the presence of an experience-dependent learning process, compatible with TBM, this makes reasonable to address a bottom-up investigation to neural correlates. It is a matter of fact that the neuronal correlates of the learning curve remain undefined so further investigations with electrophysiology or imaging techniques are needed.9,10,11,12,13,14,15,16,17
METHODS
Food Items and “Press-No-Press” Decision-Tasks (DT)
The decision task (DT) was carried out by means of a dedicated software running on a normal desk-computer, developed by M2 Scientific Computing srl The original software was home-made modified in order to fit the data in accordance to enzyme kinetic equations.7
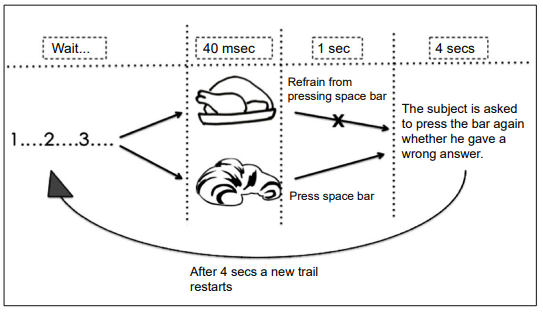
The general scheme of DT is reported in Figure 1. It is devised to carry out 48 sequential trials per DT; at each session, a black and white (b/w) drawing of sweet food image (SWEET) or salted food image (SALTED) is projected onto the computer screen for 40 milliseconds (msec). Subjects must press the space bar as soon as possible in response to SWEET; otherwise, they must refrain from pressing the bar. In a one second time lapse, the machine can acquire the RT given. Then, it appears the instruction to press in 4 seconds the bar again in case the participant thinks he has made a mistake (in either direction). Afterwards, a new trial begins.
Figure 1. Sequence and Timing of Events Describing the Paradigm of “Press-No-Press” Decision-task (DT). The Basic Paradigm is Made of 48 Trials: 24 with b/w Sweet Food Images of and 24 with b/w Salted Food Images. Trials are Presented in Random Sequence. Complex Paradigms are Obtained by Changing Images Trial after Trial.
DTs of increasing complexity are composed as it follows:
- DT-1: 1 SWEET and 1 SALTED are presented 24 times each;
- DT-2: 8 different SWEET and 8 different SALTED, repeated 3 times each, are presented;
- DT-3: 24 different SWEET and 24 different SALTED are presented 24 times each.
The 48 sessions are randomly mixed. The three paradigms correspond to three-levels of complexity increased by reducing the recurrence of identical images and adding novel ones.
To understand whether the presence of sessions with SALTED may cause a cross-interference with RTs recorded, preliminary control tests were carried out:
- DT-1c: only one single SWEET is repeated for 24 sessions; whereas, the 24 SALTED images are all different (shown).
- A series of DTs with paradigms specular to those descripted above: i.e., “press” action response to SALTED instead of SWEET; the results did not show any significant difference (not shown).
Participants: Selection and Test Directions
It is clear from the literature that the most critical parameter to keep under control in DT’s subjects is age homogeinity11,12,13,14,15; to this aim, University students (n=110) in age from 19 to 21 years of both sexes (at this age, the performance is gender independent) have been selected.
The subjects were chosen among compulsory attendance students with an optimum didactic career: this, as a principle, can exclude the use of drugs or other addictions, condition which was not possible to investigate. Then, the subjects are evenly distributed in three DTs and engaged in the 48 sessions per task only once. The authors do not direct the participants in the test; the instructions on how to proceed are given only by the software.
Food B/W Images and Mental Processes Associated
During each trial, a single b/w image of SWEET or SALTED is presented to the subject for about 40 msec. The subject should decide to press or refrain from pressing the bar key of the computer on perception of SWEET or SALTED, respectively.
A subject should decide a response provided, by control experiments, that: 1) The items are clearly visualized on the screen; 2) The images are already well encoded in the subject’s long-term memory and 3) The subject’s age is conducive to easy recall. The following prerequisites were chosen:
- B&W drawings of traditional Italian foods that are unequivocally considered SWEET or SALTED are used as visual stimuli. In order to choose these drawings, control subjects (i.e., students different from DT’s subjects) are engaged in a recognition panel to select a series of food images popular and well coded in long-term memory.
- The reason why SWEET and SALTED images are used is that: 1) The gustatory sensation of a food is easily evoked by its image;18 2) Sweet, salty and sour are our predominant gustatory perceptions, having the lowest thresholds;19,20 however, sour foods have been removed from the series of cues, being untypical in Italian cuisine; 3) Among visual, gustatory or olfactory stimuli, the visual paradigm is the most robust and the simplest method of stimulation.17
- B&W drawings with neat contours and few or no shading can facilitate immediate recognition, by means of a mental process named “continuity”.21 Time needed to identify each stimulus on the computer screen, has been estimated to be less than 40 msec by means of control experiments carried out with different subjects.
- The real scope of DTs is being withheld to participants to
avoid self-conditioning prejudices. Moreover, the instructions they read before starting the test are given to focus their interest on reaction times with no importance to food. Now-a-days, the relationship between food, diet and health is a major topic of the media.22,23 Obviously, such scope is totally out of the interests of this work.
Traffic-Lighter Control Test (R&G-Dt)
At the end of DT sessions, the software visualizes a new instruction inviting every participant to be engaged in the press/no-press traffic-lighter test, also named the “red & green decisional task” (R&G-DT). This test starts with a stable red spot on the screen; then, after a waiting time that varies randomly from 1 to 6 seconds, the spot turns to green in few msec. With the green light, participants must press the enter key, the fastest as possible for several repetitive sessions. By means of R&G-DT “simple” reaction times (SRT), subjects’ fastest, instinctive reflex is measured. Then, the authors feel authorized to consider participants’ RT as instinctual and automatic when they tend to SRTs.
This task has been introduced, primarily, as an easy method to calibrate the overall system. Moreover, a comparison between SRT and DTs’, RT might reveal interesting differences between instinctive reflexes and voluntary reactions.
Michaelis-&-Menten’s (M&M) Enzyme Kinetic Equations as a Tool for Interpreting Dts’ Data
In analogy with many biological systems (e.g., TBM), reactions between enzymes (Et) and substrates (S) exhibit a probabilistic behaviour per se; although, they can be deterministically predicted by M&M’s kinetic equations,24,25 when the reactions are carried out in “steady-state” conditions (i.e. [S] variable, [Et] constant and [S]>>[Et]).5,6 The general M&M’s kinetic equation (Figure 2, top, left) is:
Vi= [S] VMax/(KM+[S])[Et].
Figure 2: By Using the General “Michaelis&Menten”’ Assumptions (top-left), a Hyperbolic Curve of Enzyme Initial Velocity (Vi) as a Function of Substrate Concentration ([S]) can be Obtained (top-right). In the Presence of “Non-competitive” Inhibitors, Non-productive Ternary Complexes are Formed (below-left) thus Subtracting the Enzyme from the Active Stream. By Plotting 1/Vi as a Function of 1/[S] One May Envisage a “Noncompetitive” Inhibition Type (below-right).
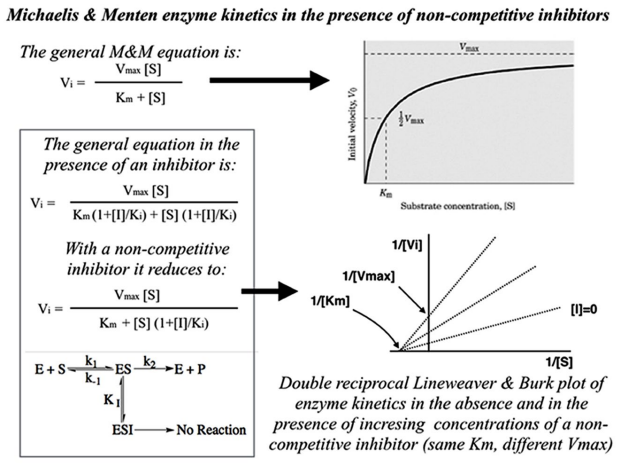
According to this equation:
- The rate Vi hyperbolically tends to Vmax for [S]→∞ (Figure 2, top right).
- Vi trend corresponds to the “probability” of substrate-dependent enzyme saturation and reaction (varying from 0% to 100%).
- “M&M constant” KM indicates the concentration [S] at which Vi=Vmax/2 (50% of “probability).
- The presence of inhibitors in enzyme kinetics can be evidenced by re-plotting the hyperbolic M&M’s curves according to a “double-reciprocal” function (Figure 2, below left). “Non-competitive” inhibition is a specific case in which Vmax decreases, whereas, KM remains constant as the inhibitor concentration is increased (Figure 2, below right).
The curves of DT-1, DT-2 and DT-3 are analysed by means of enzyme kinetic equations, provided some assumptions are adopted: [Et] stands for the participant, [S] for the number of trials N, Vi for RTs and [I] for the number of SWEET images that play the role of distractors in DT-2 and DT-3, i.e., 8 and 24 respectively.
RESULTS
Examples of Individual Performances
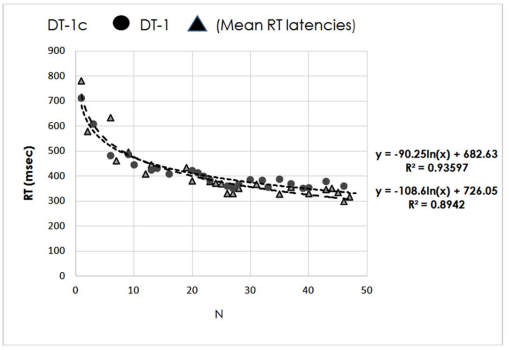
Figure 3 reports RTs of two individuals engaged in DT-1 and DT-1c. The trials per task are 48 but RTs in response to SWEET stimuli are ≤24 points on each curve (the errors are excluded). Moreover, the total errors made by every participant are very few (≤3%); they are calculated by summing both incorrect responses to SALTED and the correct responses to SWEET but shortly afterwards annulled by the participants. These errors are randomly distributed along the tasks, thus suggesting that there isn’t a significant correlation with food categories, individual food images, participants’ gender or task difficulty.
Figure 3. RTs of Two Individuals Engaged in DT-1 and DT-1c, Respectively.
Grouping and Averaging Individual RTs
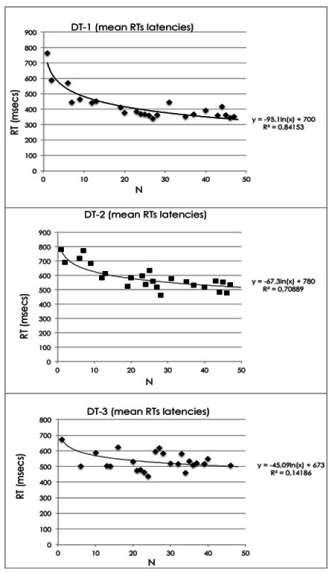
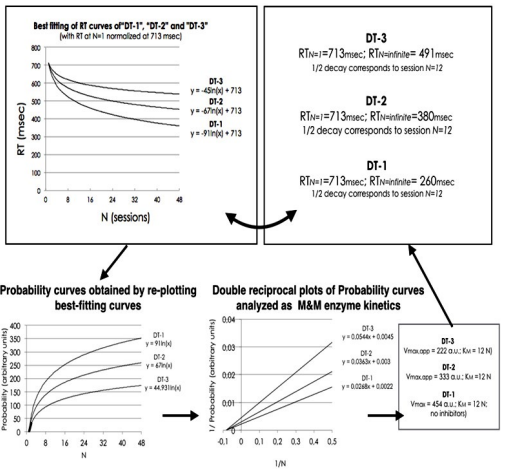
According to DT, participants’ RTs are grouped, averaged and then plotted as a function of N (the trial number) (Figure 4). Data best fitting exhibits an exponential decay in all cases that; however, worsen progressively from DT-1 to DT-3. Only DT-1 and DT-1c curves are super imposable. The others initiate with almost the identical RTs as in DT-1/DT-1c but end at different RT limits (for N→∞). DT-1 and DT-1c clearly tend to very low values, quite close to SRT; while, DT-2 and DT-3 curves progressively tend to larger RT final values.
Figure 4: From top Below, the Three Panels Provide the Mean RT Values as a Function of N (trials) of Subjects Engaged in DT-1, DT-2 and DT-3, Respectively. From top Below, DTs’ Complexity is Increasing and, Correspondingly, Subjects’ Performance is Worsening (i.e. the limit of RT Curves Tends Progressively to a Higher Value for N→∞ and R2 of the Best-fitting is Worsening).
Moreover, the variability of standard deviations (SD) along the 24 SWEET trials per DT are calculated; then, these data, plotted as a function of N for the three DTs, can be linearly interpolated by best-fitting equations: SD=-2.3N+184 (r2=0.7), SD=-2N+150 (r2=0.5) and SD=-2N+200 (r2=0.4), respectively for DTs-1/DT-1c, DT-2 and DT-3. By comparing these equations, one can see that SD almost coincide, though, r2 significantly worsen from DTs 1/1c to DT-3. As expected on the basis of TBM, SD reduction along the tasks suggests that repetitive sessions may cause a beneficial effect on mechanism known as “Learning Through Experience” (LTE) (see below); though, r2 worsening is indicative of a decrease of subjects’ self-confidence in tasks with increasing difficulty. The reason why the control task DT-1c gives identical results to DT-1 means that SALTED do not play any cross disturbing effect, this result is very intriguing and will be extensively discussed below.
DTs’ data have been also analysed with a multifactor mixed Anova test. By posing RT and SRT latencies (msec) as dependent variables, one can assess significant differences among DTs, intra-task sessions and inter-task subjects (p<0.001). Moreover, least square values of RT latencies slightly ameliorate as a function of N in all DTs, in accordance with SD trends. To this regard, the positive trends of both indices reveal the increase of subjects’ accuracy around the mean RT latency. This accuracy has nothing to do with an increase of precision in stimulus identification, since the errors (≤3%) are very few and randomly distributed across the tasks; rather, it might be indicative of the raise of confidence in the protocol of the task. However, the question now is: “Why the acquisition of this confidence along DT-2 and -3 is different than DT-1 (and its control DT-1c)”?
DT’s Curves Reveal A Different Skill Acquisition Along The Task
The best-fitting curves of DT-1,-2 and-3 in Figure 4 intuitively remind the authors of a learning trend that shows the improvement of individual performance with experience (DT-1c data are super imposable to DT-1, not shown). To understand why the three paradigms show different performances, the best-fitting curves are overlapped on the same graph and compared (Figure 5) (N.B. according to an admissible assumption, their starting RT latencies are all normalized at 713±58 msec).
TBM predicts a cognitive behaviour compatible with a BLP.6 In other words, the model foresees that the information accumulated by previous experience can be used to upgrade the efficacy of the following action. By repetition, learning is progressively enriched in a trend described by a hyperbolic LTE curve.26 This curve represents the increase of the learning “Probability” ranging between 0% and 100% with maximal experience. So that, the three DTs’ curves exhibit an exponential decrease of RT latencies in function of trials, thus indicating the occurrence of maximal LTE “Probability”. So that, LTE “Probability” curves are obtained by reversing upward DTs’ curves (Figure 5). By observing the new plot, the three curves do not tend to the same limit so that we may infer that maximal LTE “Probability” is progressively reduced in DTs of higher complexity. To this regard, the possibility that the subjects might progressively suffer from increasing mental tiredness along tasks of higher complexity is a very weak explanation since subjects’ mistakes are very low and equally distributed in all DTs.
Figure 5: Top-left: Best-fitting Curves of Mean RTs. Data are Superposed by Normalizing RTs at N=1. Top-right: RTs at
N=1, at N→∞ and at Trial N=12. Below-left: The Curves Shown at Top-left are Reversed Upwards to Obtain LTE “Probability” Curves. Below-middle and Right: “Double Reciprocal” Plot of 1/Probability as a Function of 1/N; in Analogy with Enzyme Kinetics, it can be Inferred that KM=12 (Intercept on X-axis) and that there are Increasing Concentrations of a “Non-competitive” Inhibitor (Intercept on Y-axis), Respectively in DT-2 and DT-3.
Then, the question remaining is which kind of LTE impairment might be responsible for such a difference in learning processes. According to the “subtractive/additive” methods discussed in the “Introduction”, we may suppose that, most of RT latencies at the beginning of the tasks are time spent to choose between “press” and “no-press” protocols. In accordance with TBM, unconscious mind (UM) should carefully analyse both protocols, thus doubling the time needed to take a decision. Conversely, when the task is at the end, i.e. LTE is close to a maximum value, most probably both item recognition ability and press/no-press paradigm confidence are at a maximum; then, RT latencies are practically reduced to the mechanical pressing of computer key, i.e., an unavoidable time-consuming process that cannot be reduced below its physiological threshold. Evidently, in DT-2 and DT-3, the subjects’ performance as for the action decision-making is impaired due to the presence of distracting images. Below, we’ll try to provide an explanation for this effect.
SRT Measured by Means of R&G-DT
By means of “R&G-DT” the mean SRT latency exhibited by all participants is 280 msec (±30). This performance is quite close to the SRT value of 247.6 msec (±18.5) that has been measured by means of a visual task with 120 medical students.27
Quantitative Analysis of LTE Curves by Adopting Enzyme Kinetic Equations
The three LTE “probability” curves reported in Figure 5 can be analysed by means of M&M’s general equation, provided the assumptions made above (see methods). All kinetic parameters calculated by these means are summarized in Table 1.
Two question are now arising: “Which kind and of which strength is the inhibition exerted by SWEET distractors? In order to answer the first questions, the three curves in Figure 5 are re-plotted according to the “double reciprocal” function (Figure 5). The straight lines share the same intercept on X-axis (1/KM) but have intercepts on Y-axis (1/Vmax) progressively increasing from DT-1 to DT-3. By comparing this result with the example reported in Figure 2, one can conclude that SWEET distractors exert an inhibition of “non-competitive” type.
| Table 1: Comparison between Starting and Ending RT Latencies Obtained by Means of Best-fitting Curves of Mean Experimental Data and Data Re-elaborated by Means of LTE “Probability”.
Kinetic Parameters Characterizing the “Pressing” Activity by Assuming Enzyme Kinetic Equations in the Absence (DT-1) and in the Presence of Non-competitive Inhibitors (DT-2 and DT-3). Last Column Reports Simple Reaction Times (SRT) Calculated at N→∞. In DT-1, Vapp,max=Vmax and SRTapp=SRT.
|
|
Best-fitting of RTs have
been normalized at N=1
|
Probability
(LTE) |
M&M enzyme kinetic parameters |
| RT latency
(N=1) |
RT latency
(N=48) |
Trial
(N=1) |
Trial
(N=48) |
Vapp,max
(N→∞) |
KM |
Sweet distractors
(inhibitors) |
SRTapp= (RTN=1)-Vapp,max
|
|
msec
|
msec |
msec |
msec |
msec |
N |
[I] |
Ki |
msec |
| DT-1 |
713 |
360 |
0 |
353 |
454 |
12 |
0 |
0 |
260
|
|
DT-2
|
713 |
453 |
0 |
259 |
333 |
12 |
8 |
18 |
380 |
| DT-3 |
713 |
538 |
0 |
174 |
222 |
12 |
24 |
18 |
491
|
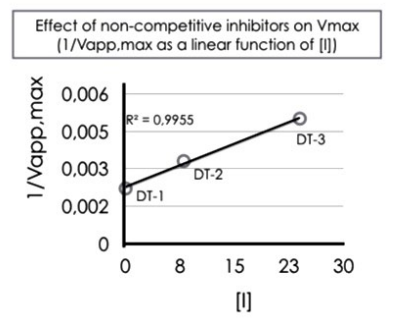
As far as it regards the second question, the strength of an inhibitor inversely depends on Ki. In order to estimate it, a “double reciprocal” plot of the “non-competitive” inhibition equation is carried out; moreover, at a very large amount of [S] (i.e., at the end of DTs, with N=48), the [S] term can be removed so that the final, simplified form of the equation becomes:
1/Vapp,max= (1+ [I]/Ki)/ Vmax
To solve the equation, one can assume that total SWEET distractors [I] encountered by participants in DT-1, DT-2 and DT-3, are 0, 8 and 24, respectively; then, 1/Vapp, max is plotted as a function of [I]. As expected, one gets a very straight line (see Figure 6) with the slope 1/VmaxKi; so that, both Vapp, max from the intercept on Y-axis (at [I]=0) and Ki=18 from the slope can be calculated (Table 1 for a complete list of kinetic parameters). By knowing that participants at the end of DT-2 and DT-3, have met 8 and 24 inhibitors, respectively, Vapp,max calculated on the basis of the preceding equation, is: 0.69×353 msec=244 msec in DT-2 and 0.42×353 msec=148 msec in DT-3, respectively. These values are quite close to experimentally estimated LTE “Probability” values: 259 msec, and 174 msec (Table 1).
Figure 6: Distractor Effect Due to SWEET Items (I) on LTE Probability (Vi). If the Inhibitor is of the “Non-competitive” Type, A Straight Line can be Obtained by Plotting 1/Vapp,max as a Function of SWEET Distractors [I] (i.e. 0, 8 and 24, Respectively for DT-1, DT-2 and DT3). Half Vapp,max is Obtained when Subject has Met 18 Distractors (Ki =18) During the Task.
DISCUSSION
Intertrial Priming Effects
Studies regarding go/no-go tasks show that when the targets of successive trials have a feature in common, RTs are shorter. This effect is interpreted as the result of “intertrial priming effect”. However, the nature of the representation underlying this effect and how priming is affected by the task remain obscure. Different authors have devised their own experiments in search of a better model describing this effect and trying to explain its mechanism.28,29,30,31 In general, the effects of priming or distracting were consolidated observations.
From these experiments, it can be inferred that repetition of the same protocol and the lack of any warning or reprimand until the end of the task, might trigger participants’ confidence in the task and an increase in self-esteem at a conscious level. The paradigm of present study does not manifest any form of reward or punishment during the task. However, the lack of any warnings might be interpreted as praise by the subject. These perceptions improve participants’ performance. The increasing satisfaction of the conscious inner witness in seeing that any decision (presumed free by the agent) ends the action correctly is perceived as “Reward”. This inference can be drawn in accord with TBM and the illuminating papers of Tolman on “cathexis”.5,32,33,34 According to TBM, FW is an illusion, necessary to self-attribute the sense of responsibility (SoR) of “so-called” voluntary actions; with SoR, obviously, reward or punishment are consequent, depending on the outcome of the action. Therefore, a motivational mechanism of learning is switched on.
Impairment of Priming Effect
In the presence of SWEET distractors, the priming effect is impaired, as if the subject could not acquire any useful experience from the past and any new trial were always the first. Interestingly, subject’s ability in item (SWEET or SALTED) identification is not altered (errors ≤3%). In summary, distraction mechanism is not a question of long-term memory failure; it might rather depend on short-term memory mismatch, caused by the presence of stimuli belonging to the same semantic category though different.
Saliency and the Priming Effect
The term Saliency means a key attentional mechanism facilitating discrimination of various items and learning.35,36 Saliency might play a primary role in the first mental process of the participant engaged in DTs, i.e. the attentional selection and categorization of the stimulus as soon as it appears. This role might be progressively impaired due to the increase of the disturbing effect from DT-1 to DT-3. Conversely, the involvement of Saliency in processes like press/no-press decision, recognition of the correct computer key and finger motion is improbable. Moreover, the participants considered the task as a sort of game, in which they felt motivated to demonstrate how fast their reflexes are; in this context, what mostly contributes to LTE curve trends is learning the way to speed up the performance, trial after trial; to this aim, Saliency alone cannot pursue such motivational mechanism.
Some Aspects of LTE Curves Unveiled by a Mathematical Analysis
Only the kinetic analysis of the collected data may reveal quantitative implications that, otherwise, might pass unnoticed. It has been shown above that LTE curves in DT-1, DT-2 and DT-3 progressively decrease their final RT values (at N=48) from 353 msec to less than half (174 msec) due to the presence of increasing amounts of SWEET distractors (Table 1).
The intriguing question now arising is: “Why is KM the same for the three tasks, although distractors are changing so much”? Or, in other words: “Is there any mechanistic relationship between KM and Ki”? In order to answer to these questions, at first one should consider the meaning of KM=12, i.e. 50% of LTE “probabilitymax” is achieved at the 12th trial; this is a feature common to all DTs, whichever distractors are present or not. According to enzyme kinetics’ metaphor, the presence of “non-competitive” inhibitors should not affect KM. Indeed, the reasons can be understood by looking at the reaction scheme in Figure 2. Enzyme-substrate complexes split into two possible pathways: some are proportionally subtracted by “non-competitive” inhibitors, whereas the rest (not locked by the inhibitor), regularly undergoes the priming mechanism that exhibits half “facilitating” effect at the 12th trial. At second, the meaning of Ki should be more deeply investigated. According to enzyme kinetics, Ki corresponds to the inhibitor’s amount capable of locking half enzyme, therefore halving Vmax; this constant can been calculated only at reaction conditions with very large [S]. As far as it regards DTs, Ki=18 would mean that 50% of the LTE “probabilitymax” is impaired by 18 distractors when N=48; as a matter of fact, only DT- 3 participants can meet 18 different SWEET distractors right at the 18th trial; conversely, DT-2 participants will never meet more than 8 distractors in the whole test so that impairment is largely reduced. In conclusion, the inhibitory effect in DT-2 and DT-3 can significantly emerge quite after the 12th trial. This conclusion is in accordance with the results that Greyer et al37 has obtained in cross-trial priming experiments; also in their paradigm, the “inhibitory” effect, in contrast to the “facilitating” effect, emerged only after extended practice.
To this regard, it should be mentioned that SALTED stimuli as well as B&W images of completely different semantic categories (like faces, cars etc. substituted for SALTED images) are not perceived as distractors (not shown).
CONCLUSION
When the trials of a “press/no-press” task are repeated with identical stimuli (as in DT-1 and DT-1c), a learning curve possibly correlated both with faster and faster object recognition and with a progressive amelioration of procedural skill, can be observed. Moreover, distractors that are introduced in the repetitive sequence (as in DT-2 and DT-3), seem to impair the learning process; possibly, action-decision making is apparently slowed down. The “priming effect” observed in repetitive trials and the negative effect on it, in the presence of “distractors”, is well known in classic “press/no-press” (“go/no-go”) decisional tasks and is in accordance with TBM’s expectations.
An even more interesting result is the quantitative estimate of the two effects that can be calculated by using “Michaelis-Menten” (M&M) enzyme kinetic equations. These equations have been derived to deterministically predict probabilistic enzyme reactions (in “steady-state” conditions), so that the metaphoric analogy with TBM in which action-decision mechanism is based on a probabilistic-deterministic model, is striking.
Data analysis carried out by means of M&M’s enzyme kinetic equations, leads the authors to conclude that: 1) The priming effect is preserved also in DT-2 and DT-3, although with a different percent of probability which varies according to the number of SWEET distractors and a specific Ki; 2) The priming effect occurs at earlier trials than the distractor-induced inhibition; 3) Distractors exhibit an inhibition of the “non-competitive” type, a result that favours the hypothesis of the addition of mental loops that delay the regular pathway to priming without excluding it.
In conclusion, the main concern of this work is to validate the theory of TBM by experimental means. The results of press/no-press DTs are compatible either with TBM or with the current literature’s observations. This psychophysical approach here reported can be considered as a first necessary step along TBM validation, to be continued from a bottom-up perspective towards imaging techniques.
ACKNOWLEDGMENT
We are indebted to Dr. Alberto Sabbioni for the helpful statistical analysis of the data and his stimulating discussions.
CONFLICTS OF INTEREST
The authors declare that they have no conflicts of interest.


