INTRODUCTION
Strategies and goals of diabetes mellitus treatment have changed fast since 2005. Randomized clinical trials (RCT) including the Diabetes Control and Complications Trial-Epidemiology of Diabetes Interventions and Complications (DCCT-EDIC),1 United Kingdom Prospective Diabetes Study (UKPDS 80),2 and STENO 23 consistently reported a better prognosis in patients starting intensive treatment regimens early after diagnosis compared to those achieving acceptable HbA1c levels later on. Such findings were supported by basic science, suggesting irreversible beta-cell damages as a consequence of oxidative stress due to prolonged exposure to high glucose concentrations.4 A strong clinical message was then sent out to pursue optimal metabolic management ever since the onset of the disease.5
In spite of this, attaining and maintaining an adequate metabolic control are still a challenge. In fact, a recent report on diabetes care quality indicators in Italy showed that over 50% people with T2DM fail to meet expected metabolic targets, and approximately 30% of newly diagnosed patients have a HbA1c >8.0% (>64 mmol/mol).6 Among the many factors suggested to explain failure to achieve recommended goals, clinical inertia is increasingly recognized as the leading one.7 Patients on metformin or sulfonylurea (SU) monotherapy starting treatment intensification only after overcoming 8.5% (69 mmol/mol) HbA1c levels are expected to take 2 to 3 years to get good metabolic control.8 On the other hand, opinions concerning the most appropriate therapeutic algorithm to be adopted in these cases are controversial. The American Diabetes Association and the European Association for the Study of Diabetes (ADA/EASD) consensus statement on medical management of hyperglycemia in T2DM9 recommends starting treatment with metformin associated to lifestyle modification, and eventually adding either basal insulin, or SUs, or pioglitazone, or incretins (Incs) when patients fail to meet expected goals. Nevertheless, such approach has been criticized as potentially hindering treatment individualization and therefore preventing diabetes complication rate and cardiovascular risk reduction.10 So, due to the absence of any widely accepted standards, the choice of individual treatment intensification strategies in people with newly diagnosed T2DM falls on each physician.11
Since the 80’s, Italy has organized diabetes care according to a protocol based on 3 stages of increasing complexity: (i) general practitioners (GPs), devoted to primary care, represent the first level, (ii) a network of 650 diabetes care units (DCU), involving multi-professional specialized teams dedicated to more complicated patients, contribute to the second level, and (iii) hospital wards, serving patients with severe metabolic conditions or with advanced organ complications, represent the third level. GPs take responsibility for the diagnosis and suggest patients to refer to the closest DCU according to a validated protocol shared with the most representative scientific societies in the field.12 Unfortunately, this protocol is not fully implemented and in real-life conditions most GPs still send their patients to DCUs only in the presence of persistent hyperglycemic levels or of fast-progressing chronic complications.13,14
This causes diversity, a sort of dichotomy between uncomplicated GP-handled patients, who are treated with a OHA, and older, severely complicated, insulin-treated patients, who rely on a DCU. Two clusters of patients with different levels of clinical complexity are generated then and this is not cost-effective in the long run because the former is expected to develop severe complications as metabolic control progressively deteriorates.14 A further challenge to health assistance is age, because T2DM is a severe health issue per se in people over 60 years of age15 who, despite large inter-individual differences in physical and mental performance, are characterized by increased comorbidity rates and less active lifestyles.
Anyway a large body of evidence is available on another relevant clinical problem: therapeutic inertia. The latter is usually defined as providers failure to prescribe new drugs or to increase the dosage of existing medications when an abnormal clinical parameter is recorded.20 Italian GPs generally prefer to ask for support from diabetologists before starting insulin treatment 11,14 and, even those willing to prescribe innovative drugs are not allowed to do so without any official specialist’s approval. In fact they cannot autonomously use a glucagon-like peptide-1 receptor agonists/analog (GLP1-RA) or dipeptidyl peptidase-4 inhibitor (DDP-4i) but, contradictorily enough, they are expected not to overcrowd DCUs with mild disease cases. That’s why, when insulin sensitizer treatment fails, they almost invariably add available secretagogues. As a consequence of that, recommended best practices meant at improving outcomes are often ignored and this constitutes a case of clinical inertia in terms of management and quality aspects.7,13 On such premises it is difficult to build-up a positive metabolic memory 4,11,21 as in real life adequate glucose levels are still far from being reached, and poorly controlled T2DM patients are much more than expected.5,14,22,23
Based on the above mentioned considerations, the aim of this study was to verify how diabetes specialists started/modified drug regimens of their freshly referred patients to reach individualized HbA1c targets in case of HbA1c levels >7% (>53 mmol/mol), a cut-off chosen to define good metabolic control according to Italian Standards of Care, which in fact fully incorporate the latest ADA-EASD positions statement.21
MATERIALS AND METHODS
This was an observational, multicenter study coordinated by AMD Research Foundation and involved 48 AMD Research Network DCUs evenly distributed throughout Italy and carefully selected according to the efficiency indicators listed in the AMD Foundation Quality Manual.24 Its design was approved by a dedicated Scientific Committee in November 2013. From March to June 2014 all DCUs got the protocol approved by their ethics committees and explored their data bases to randomly identify patients fulfilling inclusion criteria. The enrollment phase lasted three months and ended in December 2014. The Standards of Medical Care in Diabetes 201625 and the International Classification of Diseases, Clinical Modification (ICD-9-CM, V82.9 2014)26 were used to define diabetes diagnostic criteria/procedures, as well as, comorbidities and/or disease complications.
LDL-C was estimated by the Friedewald equation. Microalbuminuria (MA) was defined as a urinary albumin excretion rate >20 μg/min or albumin-creatinine ratio >2.5 (men) or >3.5 (women) mg/mmol. GFR was calculated with the CDK-EPI creatinine equation 2009. All local laboratories of participating centers agreed to a strict systematic quality control supervision according to the national accreditation program and to the 2015 ACCREDIA UNI EN ISO 15189:2013 regulations.
Enrollment Criteria
People with T2DM reporting no history of cardiovascular events were considered for the study. Only those consecutively referring to a DCU during the first week of each selected month were enrolled provided they complied with the following features: age ≥18 years, HbA1c >7% (>53 mmol/mol), previous or current treatment based on lifestyle and/or OHA, availability of clinical records for at least the last 3 months. Enrolment criteria also included mild complications/comorbidities, like background retinopathy, early nephropathy (non-progressive microalbuminuria) or neuropathy (DNI<4),27 cataract, mild carotid artery disease (i.e.< 50% occlusion), mild or treated peripheral artery disease (i.e. haemodynamically irrelevant either per se or because of successful surgery, respectively), excised non-metastatic malignancies, treated hypertension. This explains why the HbA1c target was kept at 7% (53 mmol/mol) even in aged people, according to the algorithm by Ceriello et al.28 In fact, patients on insulin or with gestational or brittle diabetes or with severe or fast progressing complications, any diseases markedly reducing patient’s life expectancy and any clinical, mental or logistic conditions severely hampering appropriate disease management were excluded from the study.
Lifestyle was classified as poor or good according to current standards of care for diabetes mellitus.25,28
Diabetologists recorded all clinical and laboratory findings electronically. All hypoglycemic agents available at the time of the study were considered for treatment immediately after referral, including metformin, SUs, repaglinide, pioglitazone, acarbose, DPP-4 is (sitagliptin, vildagliptin, saxagliptin), GLPIRAs (Exenatide, Liraglutide), as well as, basal and/or bolus insulin (indicated as overall dose/day).
Statistical Evaluation
Single records were verified for consistency to clean the database before statistical evaluation (SPSS/plus software [Norusis Inc. Ill, USA]): specific queries were sent out to the originators and, in case of unsatisfactory replies, were considered as “missing”, thus allowing only 2188 patients to be accepted for subsequent analysis out of the 2227 originally enrolled (98.3%). The least accepted significance level was set at p<0.05.
For continuous variables descriptive analysis was used yielding means, standard deviations, least and top values, medians and quartiles while qualitative/categorical parameters generated frequency tables (n, %) where percentages were calculated and missing data were excluded in the χ2 test with Yates correction. Cluster analysis was also utilized as appropriate. One-way analysis of variance (ANOVA) and multivariate logistic regression analysis were used as deemed appropriate to highlight any unbalanced features possibly occurring within the population under study.
RESULTS
General patient characteristics presented in Table 1 can be synthesized as follows: M/F ratio was 1.17, mean age was 63.9±9.8 years, (range 29-79), and mean BMI was 29.9±4.9 kg/m2 (range 16.0-63.2) with 15% normal weight, 42% overweight and 43% obese subjects. The known duration of diabetes was ≤1 year in 7.7% patients, >1 to ≤2 years in 25%, >2 to ≤5 years in 33%, and >5 in 34.3% patients. Mild diabetes complications were found in 28.8% subjects (6.3% subjects had more than a single complication), anamnestic or on-treatment malignancies in 3.3%, hypertension in 86.3%, and dyslipidemia in 67.5% cases; 37.5% patients had high triglycerides (>150 mg/dl), 36.1% high total cholesterol (>190 mg/dl, our upper reference limit), 52.8% had high LDL-cholesterol (>100 mg/dl) and 38.8% had low HDL-cholesterol (<40mg/dl in men or <50 mg/dl in women). All other blood parameters were normal, including creatinine.
Table 1: Descriptive features of the population at baseline (2188 type 2 diabetic subjects)
Data are expressed as mean±SD or as n. and percent rate in case of categorical variables. One hundred and thirty seven subjects (6.3%) had more than one complication. CCT= cataract, CAD= mild carotid artery disease, PAD= mild or treated peripheral artery disease.
| Variable |
Subjects n. (%) |
| Casuistry |
| Male |
1182 (54) |
| Female |
1006 (46) |
| Age (years) M±SD (Range) |
63.9±9.8 (29-78) |
| BMI (kg/m2) M±SD (Range) |
29.9±4.9 (16.0-63.2) |
| normal weight |
328 (15.0) |
| underweight |
0 (0) |
| overweight |
919 (42.0) |
| obese |
941 (43.0) |
| Age<50 (years) |
153 (7) |
| >50 ≤65 (years) |
1356 (62) |
| >65 (years) |
679 (31) |
| Diabetes duration (years) |
| ≤1 |
164 (7.7) |
| >1≤2 |
547 (25.0) |
| >2≤5 |
722 (33.0) |
| >5 |
755 (34.5) |
| Associated diseases/Complications |
| Diabetes complications (overall)* |
640 (28.8) |
| Background retinopathy |
295 (13.5) |
| Earlynephropathy |
263 (12.0) |
| Earlyneuropathy |
2(10.0) |
| Excised non metastatic malignancies |
68 (3.1) |
| Arterialhypertension(%) |
(86.3) |
| Systolic Blood Pressure (mm Hg, M±SD) |
136±15.7 |
| Diastolic Blood Pressure (mm Hg, M±SD) |
79±8.6 |
| Biochemical parameters (M±SD) |
| HbA1c (%) |
8.1±0.9 |
| Total Cholesterol(mg/dl) |
185.2±34.5 |
| HDL Cholesterol(mg/dl) |
48.2±11.4 |
| LDL Cholesterol(mg/dl) |
107.0±27.5 |
| Triglycerides(mg/dl) |
150.8±70.6 |
| Creatinine (mg/dl) |
0.9±0.3 |
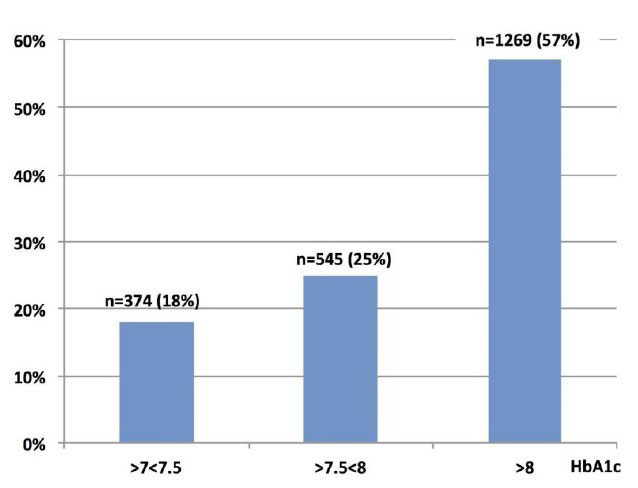
Figure 1 depicts HbA1c distribution among patients classified according to the time elapsed between diagnosis and DCU-referral: a progressive increase in HbA1c values was observed with time. In greater detail, as shown in Figure 2, the number of patients progressively increased along with HbA1c levels and finally peaked (n=1269 (57%)) at values greater than 8% (64 mmol/mol).
Figure 1: Patient distribution according to % HbA1c values and lag time from diagnosis to referral. All differences were statistically significant
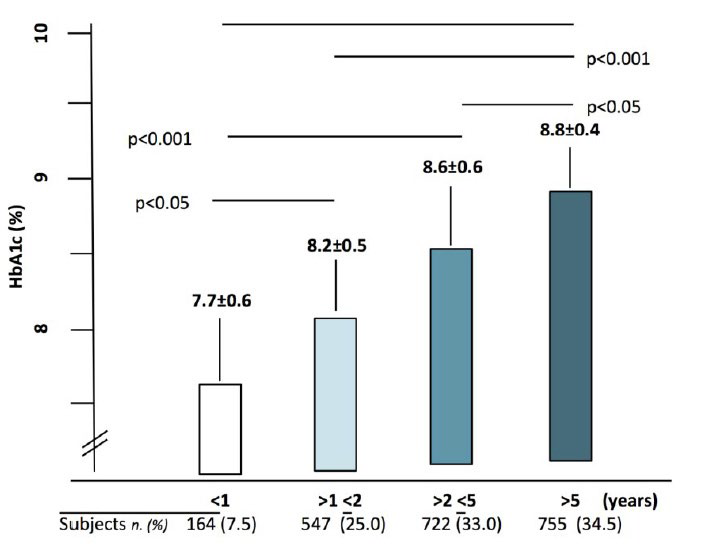
Figure 2: Distribution of patients according to three arbitrarily chosen % HbA1c categories
Among potentially interfering factors, lifestyle might affect chosen treatment strategies especially in terms of insulin sensitizing medications: this in fact was not the case as, when we explored this possibility, we found people were equally treated in terms of insulin sensitizers independent of their lifestyle and a slightly higher, still statistically insignificant, prevalence in GLP1-RAs with respect to SUs or oral Incs was found in obese people, as expected. Other potentially interfering factors including primary healthcare data, and socio-economic data might have been an issue with respect to therapeutic choices in case of private patients living in different national contexts within Europe and endowed with varying levels of external support and different abilities to pay out-of-pocket, but they in fact could not have any impact on our results as participating subjects were all under the responsibility of the Italian national health system and were therefore homogenously provided with visits and treatments at no charge thanks to a direct disease-related reimbursement mechanism. This leveled out all patients as for diabetologists therapeutic choices at their first referral to any DCU.
Table 2 shows that 2% subjects were taking no OHAs, 41.2% were on monotherapy and 56.8% were on polytherapy. As seen in Figure 3 and Table 3 metformin was used in 1886 patients (86.2%, 725 of whom on monotherapy and 1161 on polytherapy) and Figure 4 shows that SUs were used in 963 patients (44%, 102 of whom on monotherapy and 861 on polytherapy) and Incs were prescribed to 329 patients (15%, 6 of whom on monotherapy and 323 on polytherapy). Out of the 1242 subjects on polytherapy, 55% (n=686) were taking 2 drugs and 45% (n=556) ≥3 drugs; the most frequent association was metformin+SUs and was observed in 58% subjects on 2 drugs and in 61% subjects on three drugs. We feel it worth to underline that the use of metformin or SUs was also maintained after referral in patients with an HbA1c>8% (64 mmol/mol) and more than 5 year disease duration. Other OHAs were used, mostly as polytherapy, in a minority of cases.
Table 2: Treatment regimens at referral (drug classes) according to the lag time from diagnosis to referral. Data are expressed as n. and [%].
&among the 1242 subjects on polytherapy, 55% (n=686) took 2 drugs, 45% (n=556) 3 or more drugs; the most frequent association was metformin+sulphonylureas, observed in 58% subjects on 2 drugs and in 61% subjects on 3 drugs, respectively.
| Patients under study: n=2188 |
| Referral time (y) |
≤1 |
>1 ≤2 |
>2≤5 |
>5 |
Total |
Monotherapy |
Polytherapy |
| No therapy (n, [%]) |
2 |
28 |
6 |
8 |
44 [2.0] |
– |
– |
| Monotherapy (n, [%]) |
|
|
|
|
|
902 [41.2] |
|
| Polytherapy (n, [%]) |
|
|
|
|
|
|
1242 [56.8]& |
| Drug that may be prescribed by both GPs and Diabetologists |
| Metformin (n) |
162 |
385 |
685 |
654 |
1886 [86.2] |
725 |
1134 |
| Sulphonylureas(n) |
0 |
301 |
456 |
206 |
963 [44.0] |
102 |
681 |
| Pioglitazone(n) |
0 |
16 |
96 |
151 |
263 [12.0] |
12 |
251 |
| Repaglinide(n) |
0 |
121 |
76 |
44 |
241 [11.0] |
53 |
188 |
| Acarbose(n) |
0 |
14 |
36 |
16 |
66 [3.0] |
4 |
62 |
| Drug that may be prescribed only by Diabetologists |
| Incretins(n) |
16 |
90 |
135 |
88 |
329 [15.0] |
6 |
323 |
Table 3: More details of treatment regimens at referral, with respect to sulphonylureas and incretins, as well as, to monotherapy and polytherapy.
*with respect to all 2188 patients; ^within each drug class; °within each drug class on monotherapy; § within each drug class on polytherapy.
| |
Total (n. 2188) |
Monotherapy (n. 902) |
Polytherapy (n. 1242) |
| n. |
% |
n. |
% |
n. |
% |
| Sulphonylureas |
|
963 |
44.0* |
102 |
10.6^ |
861 |
89.4^ |
|
Glibenclamide |
459 |
47.6^ |
20 |
19.6° |
439 |
51.0§ |
|
Glipizide |
9 |
0.9^ |
2 |
1.9° |
7 |
0.8§ |
|
Gliclazide |
175 |
18.2^ |
39 |
38.2° |
136 |
15.8§ |
|
Glimepiride |
273 |
28.4^ |
41 |
40.3° |
232 |
26.9§ |
|
Other |
47 |
4.9^ |
0 |
0 |
47 |
5.6§ |
| Incretins |
|
329 |
15.0* |
6 |
1.8^ |
323 |
98.2^ |
|
Exenatide |
37 |
11.3^ |
0 |
0 |
37 |
11.5§ |
|
Liraglutide |
54 |
16.4^ |
0 |
0 |
54 |
16.7§ |
|
Sitagliptin |
133 |
40.4^ |
1 |
16.7° |
132 |
40.8§ |
|
Vildagliptin |
73 |
22.2^ |
5 |
83.3° |
68 |
21.1§ |
|
Saxagliptin |
32 |
9.7^ |
0 |
0 |
32 |
9.9§ |
Figure 3: Utilization rate of different drug classes at referral (on both mono- and polytherapy)
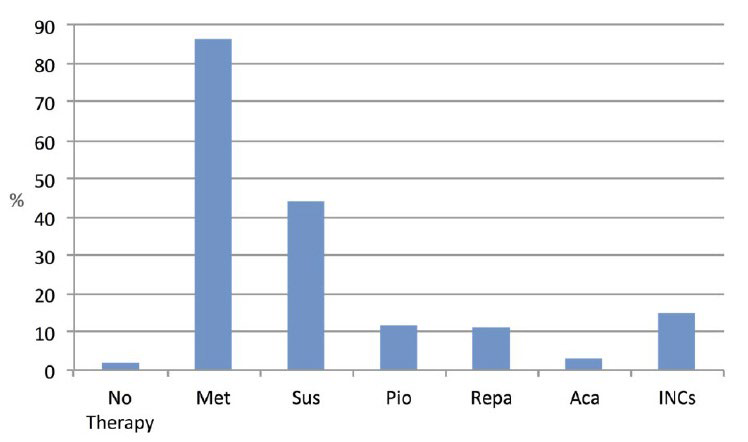
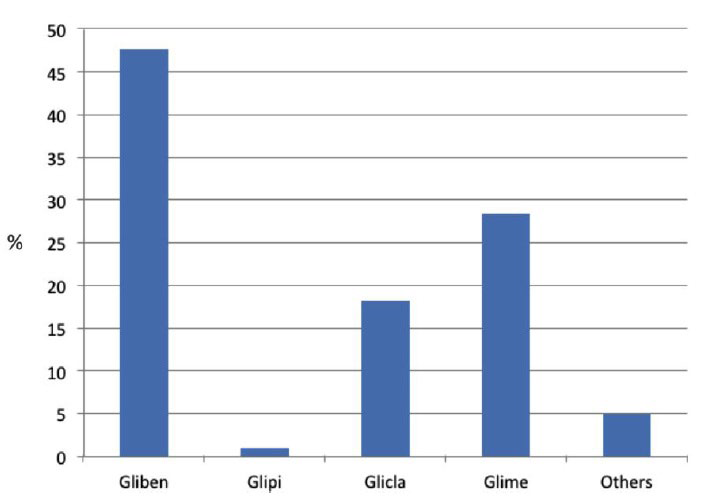
Figure 4: Relative utilization rate of different Sulphonylureas at referral (on both mono- and polytherapy).
Gliben= Glibenclamide; Glipi= Glipizide; Glicla= Gliclazide; Glime= Glimepiride.
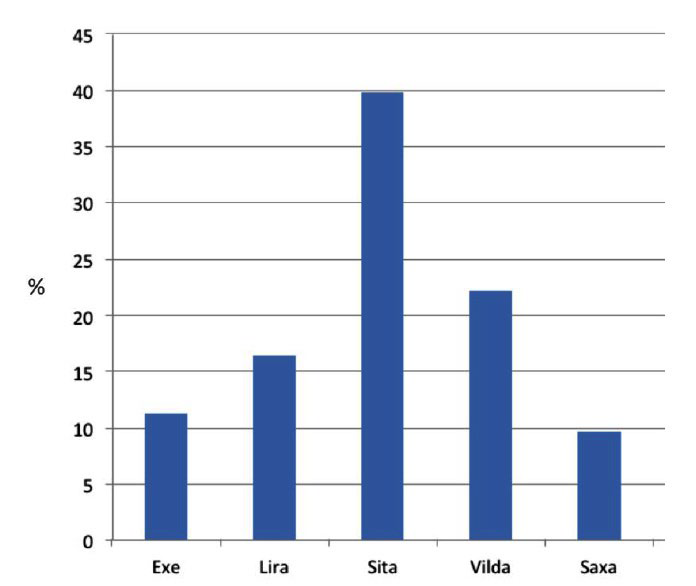
Among Incs, DPP-4is were utilized more than GLP1- RAs and among the former, saxagliptin and vildagliptin were the most widely chosen (39.9% and 22.2% cases, respectively, see Figure 5). Both DPP-4is and GLP1-RAs were mainly prescribed in combination with other OHAs. The fact that 329 patients (15%) were already on Incs when referring to a DCU shows that they had been visited by a specialist within the last 6 months at least, as in Italy Inc prescriptions are competence of diabetologists only, who may repeat them at 6 month intervals when needed.
Figure 5: Relative utilization rate of different Incretins at referral (on both mono- and polytherapy).
EXE= Exenatide; Lira= Liraglutide; Sita= Sitagliptin; Vilda= Vildagliptin; Saxa= Saxagliptin
However, people with freshly diagnosed T2DM (n=164, Table 1 and Figure 1) had received their first OHA prescription by a diabetologist: 161 were on metformin, the rest on a combination of metformin and Incs.
In Table 4, the results of multivariate logistic regression analysis (backward models) are summarized, showing the relationship between some diabetes features and time of referral to the DCU, where early referral patients (≤1 year disease duration) were taken as the reference category for the others. It clearly shows that the time elapsed between diagnosis and the first referral to the DCU had a significant impact upon results.
Table 4: Results of multivariate logistic regression analysis (backward models) showing the relationship between some traits of diabetes and lag time of referral to a DCU.
Patients with an early referral were the reference category for all the others. OR= Odds ratio, CI 95%= 95% confidence intervals; BMI= Body mass index, HbA1c= glycated hemoglobin.
| Lag time of referral to a DCU (years) |
>1≤2 |
>2≤5 |
>5 |
| Subjects (n.) |
547 |
722 |
755 |
|
OR (CI 95%) |
OR (CI 95%) |
OR (CI 95%) |
| Age (year) |
0.79 (0.65-0.90) |
0.89 (0.87-0.91 |
2.67 (2.65-2.69) |
| Age at diagnosis (year) |
0.61 (0.58-0.69) |
0.52 (0.48-0.69) |
0.60 (0.58-0.71) |
| Diabetes Duration (year) |
0.87 (0.78-1.03) |
1.68 (1.03-2.00) |
2.67 (2.06-2.97) |
| BMI (Kg/m2) |
0.88 (0.79-0.92) |
0.90 (0.84-0.96) |
0.94 (0.91-0.98 |
| HBA1C (%) |
2.19 (1.95-2.99) |
2.67 (2.65-2.69) |
4.36 (4.05-5.19) |
| Monotherapy (n.) |
0.95 (0.94-0.96) |
0.89 (0.79-0.95) |
3.65 (3.35-4.09) |
| Polytherapy 2 Drugs (n.) |
0.92 (0.90-0.93) |
1.88 (1.56-1-99) |
4.57 (3.93-4.89) |
| Polytherapy>2 Drugs (n.) |
2.67 (2.65-2.69) |
3.45 (2.98-3.78) |
5.38 (4.89-5.99) |
We tried to look for some gender differences as these might be supposed to occur on the basis of the literature. Women in fact have been reported to be granted a poorer quality of diabetes care than men, with patient and physician attitudes eventually playing an important role in process measures and outcomes 29 regardless of age. We therefore tried to cross-tabulate our results according to a 2×3 (gender×age) classes (male, female and 60 years). We immediately realized that the study was not powered enough to provide any statistically significant comparison as the vast majority of subjects were within the 50- 60 age range but, independently of that, women quality of care appeared to be virtually the same as that observed in men.
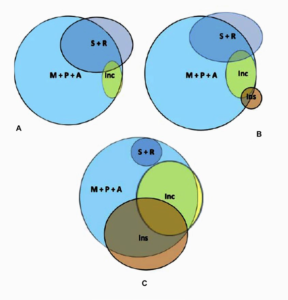
As shown in Table 5, 70.3% patients underwent treatment changes after the first visit, 31.4% in terms of dosage and 68.5% in terms of combined drugs while only 9 subjects (0.4%) had their previous drugs withdrawn due to either unfavorable effects or low-for-age HbA1c levels. Twenty-nine point seven percentage people, however, were kept on the same regimens despite high HbA1c values and, more in detail, specialists significantly increased prescription rates for both Incs and other common OHAs but reduced SU prescriptions by only 4.3% (they still mostly preferred glibenclamide) and started insulin only in the 3.8% patients, despite people with HbA1C>8% were as many as 58%. All this clearly leaps out from Figure 1 and even more clearly from Figure 6, which was prepared just to give an immediate idea of how treatment is like before referral, after referral and how far it still has to go to approach ideal standards.
Table 5: Comparison between drugs taken before referral and those prescribed by the diabetologist after that. Subjects on monotherapy and polytherapy are pooled together.
| Drug |
at referral% |
DCU-prescribed% |
Variation ∆% |
p |
| No therapy |
2.2 |
1.7 |
11.3 |
0.382 |
| Metformin |
86.2 |
88.2 |
2.3 |
0.0358 |
| Glibenclamide |
20.9 |
17.0 |
18.7 |
<0.0.5 |
| Glipizide |
0.4 |
0.4 |
– |
– |
| Gliclazide |
8.7 |
8.5 |
2.3 |
0.0296 |
| Glimepiride |
14.6 |
16.7 |
2.3 |
<0.05 |
| OtherSUs |
0.1 |
0.1 |
– |
– |
| Repaglinide |
11.0 |
13.4 |
21.8 |
<0.0001 |
| Pioglitazone |
12.1 |
23.2 |
91.7 |
<0.0001 |
| Acarbose |
3.2 |
4.5 |
40.6 |
<0.0001 |
| Exenatide |
1.3 |
2.9 |
123.1 |
<0.0001 |
| Liraglutide |
2.1 |
4.1 |
177.6 |
<0.0001 |
| Sitagliptin |
5.9 |
16.2 |
95.2 |
<0.0001 |
| Vildagliptin |
3.1 |
6.9 |
122.6 |
<0.0001 |
| Saxagliptin |
1.0 |
3.6 |
260.0 |
<0.0001 |
| Insulin |
– |
3.8 |
– |
– |
| DRUGS AGGREGATED IN MACRO-CLASSES |
| Drugclass |
at referral% |
DCU-prescribed% |
Variation ∆% |
p |
| Metformin |
86.2 |
88.2 |
2.3 |
0.0382 |
| Sulphonylureas |
44.4 |
42.5 |
-4.3 |
<0.0001 |
| Glitazones |
12.1 |
23.2 |
91.7 |
<0.0001 |
| Acarbose |
3.2 |
4.5 |
40.6 |
0.0229 |
| Repaglinide |
11.0 |
13.4 |
21.8 |
<0.0001 |
| Incretins |
13.4 |
33.5 |
150.0 |
<0.0001 |
| Insulin |
– |
3.8 |
– |
– |
Figure 6: Graphic representation of prescriptive behavior as observed at referral (top left, panel A), immediately after referral as a result of specialists’ prescriptions (top right, panel B) and as expected from 2015 ADA guidelines (bottom, panel C)21 (see also Tables 5 and 6). M= Metformim; P= Pioglitazone; A= Acarbose; S= Sulphonilureas; R= Repaglinide; Inc= Incretins (DPP4-is + GLP1-RAs); Ins= Insulin.
Finally, in Table 6, we cross-tabulated drugs against complications. This way we tried to be as informative as possible on the possible impact of comorbidities on specialists choices and therefore provide the reader with a more complete picture of Italian therapeutic attitude. It clearly shows that in the presence of chronic complications insulin tended to be added almost 3 times as frequently as in case of arterial hypertension, a highly prevalent comorbidity, while other drugs did not display any specific trend.
Table 6: Treatment choices (%) after referral with respect to complication (compare with Table 5). The sum of percent complications may exceed 100% because they may overlap in some subjects.
HT=hypertension; DR=diabetic retinopathy; DKD=diabetic nephropathy; DN=diabetic neuropathy; “Other”= “Other Complications” including 68 subjects with previously excised non metastatic malignancies; 64 subjects with cataract, 23 with<50% occluding carotid atherosclerotic plaques, PAD diagnosed as haemodynamically irrelevant either per se (14 subjects) or after successful peripheral bypass (7 subject).
| Drug macroclass |
Drug class |
DR |
DKD |
DN |
Other |
HT |
| Insulinsensitizers + Acarbose |
Metformin |
42.0 |
39.5 |
40.6 |
40.7 |
41.9 |
| Glitazones |
5.0 |
13.0 |
18.0 |
11.0 |
22.0 |
| Acarbose |
2.0 |
1.5 |
3.0 |
2.2 |
4.4 |
| Secretagogues |
Sulfonylureas |
28.0 |
23.0 |
33.3 |
27.0 |
41.5 |
| Repaglinide |
10.0 |
6.0 |
10.5 |
7.4 |
11.9 |
| Incretins |
GLP1-RA |
5.0 |
7.0 |
6.4 |
4.3 |
5.6 |
| Gliptins |
30.1 |
28.0 |
33.6 |
28.7 |
27.6 |
| Insulin |
Insulin |
3.6 |
3.3 |
3.4 |
3.2 |
1.2 |
DISCUSSION AND CONCLUSIONS
Large trials have shown that optimized multifactorial interventions during the first year after diagnosis can prevent complications and reduce related costs for a long time.30 We hypothesized that in people with type 2 diabetes, this might be obtained by an early integration between GPs and diabetes care teams.
The most striking finding in our study was the markedly higher HbA1c levels observed in late (>1 year disease duration) than early referral patients (≤1 year disease duration) together with a greater clinical complexity and a more severe disease in terms of higher complication rates and higher number of hypoglycemic agents needed.
Up to 85% patients referring to the DCUs were on drugs other than Incs prescribed by both GPs and diabetologists, being Incs used only by the remainder 15%. In greater detail, the most prescribed drugs – as apart from metformin – were SUs and especially glibenclamide. One might speculate how it happened that 15% patients were on Incs already before referring to the DCU. They in fact had been prescribed Incs during a sporadic, autonomously attempted contact with a diabetologist some time before, but after that they had kept referring to their GPs ad in the meanwhile had got Incs out of their own pockets hoping to improve glucose control.
During the enrollment visit, about 70% cases had their previous drugs dosage increased or added other medications. Drugs mainly prescribed by diabetologists were pioglitazone and Incs (with greater preference for DPP4-is). Insulin was used only in 3.8% of patients, despite 58% displaying HbA1c levels >8% (64 mmol/mol) and having the greatest burden of complications along with the longest disease duration.
Interestingly enough, specialists reduced SU prescriptions by 4.3% only, despite dealing with the highest prevalence of patients with longer disease duration, poorer HbA1c values, older age and higher complication rates (33% with HbA1c 8.6±0.6 referring after >2<5 years and 34.5% with HbA1c 8.8±0.4% referring after >5 years from diagnosis). It has to be to point out that SUs represent the oldest oral diabetes medication class and the most used world-wide as well, especially because of its low cost. They trigger insulin release by closing beta-cell ATP-sensitive potassium channels and are therefore highly effective in controlling glucose levels especially during the first 5 to 10 years from diagnosis.31,32 In fact, the associated secondary failure rate was reported to exceed that observed with other drugs, and was interpreted as due to an exacerbation of islet dysfunction. In addition to that, their use is typically associated with a modest, yet real, weight gain and puts people at risk for hypoglycemia.27 All this represents a threaten for cardiovascular health and explains why a recent paper strongly suggests to avoid glibenclamide whenever possible from now on,33 despite its low cost making it a very easily accepted solution for both doctors and patients especially in developing countries, which are still characterized by a low income and have to try as much as possible to strike an appropriate balance between health benefits and financial constraints.
Furthermore, basal insulin is typically suggested to be added since the beginning when patients are markedly hyperglycemic and/or symptomatic, and even–according to some guidelines-when HbA1c has been >7% (53 mmol/mol) for at least 3 months in non-frail patients,9 but it was hardly ever prescribed by specialists themselves. Thus, patients are mostly prevented from achieving expected goals also by persistently unbroken barriers like therapeutic inertia.33 A typical example of the latter is given by what we could see: despite their inability to autonomously prescribe anything else than insulin sensitizers or SUs, Italian GPs often feel uneasy at the prospect of starting insulin therapy on their own and need diabetologists to have their patients treated by innovative drugs, but still seek help too late.14
Indeed several Italian and International studies suggest that T2DM patients under treatment at DCUs achieve better glucose levels.11,13,14,23 This is easily explained by the fact that diabetologists may focus more closely upon diabetes-related issues and have direct access to patient education resources and other specialists to collaborate with. Moreover, as apart from their renowned skills, Italian diabetologists hold power, being the only allowed prescribing innovative diabetes-related drugs. This enables them to start an aggressive, individualized treatment in case of poor metabolic control and get optimized results within few months.5,9,13 Nevertheless, the results of our study seem to be in disagreement with these claims, as Italian diabetologists behavior is not brilliant: they still use less insulin than expected from glucose levels and often go on with GP-prescribed OHAs at length without switching to innovative drugs.13,28 This seems in fact to constitute a case of therapeutic inertia.
The drawings in Figure 6 try to provide a true and fair view of specialists’ attitude towards diabetes treatment in Italy by utilizing our electronic case report form (eCRF) therapy-related referral data (top left, panel A) and those recorded after the first visit at the participating DCUs (top right, panel B), as well as, an “ideal” picture of expected drug utilization based on ADA 2015 guidelines (bottom, panel C).21 The latter sketch in fact reflects a theoretical model taking into account age, weight, overall socio-economic conditions, chronic diabetes complications and the risk of acute disease complications (hypoglycemia above all). Being theoretical, though, it cannot include “humanistic” indicators like doctor-patient relationship, clinical attitude, therapeutic inertia, comorbidity-dependent polytherapy, fear of hypoglycemia, phobia about needles, education, false beliefs, and so on.34 However, as a matter of fact, it clearly stands out from the picture that SUs were expected to be prescribed by specialists at least 50% less while insulin and Incs to be added to/ substituted for other medications 10 and 3 times as much as observed, respectively.
However, in the presence of chronic complications Italian diabetologists proved to use less SUs and to be keener at using insulin even though the non-severe character of the latter did not require them to do so at any rate. This is in line with current guidelines anyway and proves Italian specialists are not shallow at all, but seem to be more impressed by undeniable, albeit early and light comorbidities than by those eventually expected to be developed as a result of long standing poor metabolic control. In other terms, daily practice shows that somehow they display a sort of over optimism when no complications appear on the stage and this attitude lets them forget what national and international guideline-related flowcharts suggest to do to prevent complications.21,28,35
Other organization-related factors may also contribute to diabetes specialists inertia, including lack of time and ill-organized overall integrated management.13,35,36,37 Inertia has been mostly thought to depend on (i) low GP propensity to changes, (i) poor care management DCU organization and eventually (iii) temporary unavailability of a specific drug 38,39 but our study showed that something eventually prevented even diabetologists from following best practice recommendations since the first visit.
Specific actions have to be devised and readily taken against clinical inertia to improve diabetes outcome. This is suggested by the fact that, based on our study, despite some differences between them, even specialists proved to be insufficiently fast and aggressive at intensifying glucose lowering treatment. Improved awareness of blood glucose targets, subcutaneous glucose sensors and accurate HbA1c predicting algorithms may be good for that. Better tools and greater resources allowing safer intensive glucose lowering strategies may also help specialists implement best practices.28,40,41
ACKNOWLEDGEMENTS
This paper was supported by AMD Research Foundation Onlus. Special thanks are due to patients and health professionals who contributed to the study on a fully voluntary basis and to the AMD START-DIAB Study Group members.
FS and SG wrote the paper under AC’s supervision and all members of the START-DIAB Study Group equally contributed to the revision of the manuscript and approved its final version.
CONFLICTS OF INTEREST
The authors declare that they have no conflicts of interest.
Statement of Human and Animal Rights
All procedures followed were in accordance with the ethical standards of the responsible committee on human experimentation (institutional and national) and with the Helsinki Declaration of 1975, as revised in 2008.
Statement of Informed Consent
Informed consent was obtained from all the patients for being included in the study.


