INTRODUCTION
Nutritional status of hospitalized patients has been recognized as an important factor on clinical outcomes.1-3 Patients with nutritional risk or malnutrition faced higher risk of worse outcomes including increased length of hospital stay, healthcare costs, morbidity and mortality, and readmission rate. Malnutrition was associated with a weakened immune system and higher incidence rate of infection and infectious disease. The prevalence of malnutrition in hospitalized patients was reported to be 8%~80% and varied with different diseases.4,5 Old patients and cancer patients had higher nutritional risks. However, there were no reports comparing nutritional risk and nutritional therapy between surgical and internal medicine wards till today.
The prevalence of malnutrition varied largely among different reports which should be partially related to different screening tools used.6-8 Currently, there were several optional screening tools such as Nutritional Risk Screening 2002 (NRS2002), the Malnutrition Universal Screening Tool (MUST), the Subjective Global Assessment (SGA) and the Mini Nutritional Assessment (MNA). NRS-2002 established by Kondrup et al has shown superior performance in regard to sensitivity and specificity for predicting complications compared with other screening tools and was recommended by the European Society of Parenteral and Enteral Nutrition (ESPEN) for nutritional assessment in hospitalized patients.9 A multicenter, prospective study involving 26 hospital departments from more than 10 countries showed that nutritional risk defined by NRS-2002 was an independent predictor of poor clinical outcome.10 NRS-2002 was first introduced in China in 2007 and we formerly reported the prevalence of nutritional risk defined by NRS-2002 in Guangzhou teaching hospitals was 41.5%.11
Nutritional screening and assessment could quantify a patient’s degree of malnutrition, and monitor the adequacy of nutritional supplements as well as identifying patients at risk of malnutrition.12 Early detection of nutritional risk would allow for early intervention and better outcomes. One reason for not doing such screening might be lack of time since nutritional screening is one of several time-consuming procedures in a busy hospital and may be easy to neglect. Studies showed that nutritional therapy based on nutritional screening results significantly reduced length of hospital stay and morbidity rate.4,13 Inappropriate implementation of nutritional therapy was found in China and other countries,11,14 but the difference on nutritional therapy between surgical and internal medicine wards was not clear.
In this study, we aim to compare nutritional status, the prevalence of nutritional risk, and nutritional therapy between patients in surgical wards and those in internal medicine wards. We found that nutritional risk and inappropriate nutritional therapy were more common among patients in internal medicine wards than those in surgical wards. Patients with internal diseases should be intensively evaluated for nutritional risk and nutritional therapy. Our results showed that NRS-2002 was a worthwhile nutritional risk screening tool for hospitalized patients and implementation of nutrition therapy should be based on nutritional screening results.
METHODS
Study Design
The present study is a prospective observational cohort study for patients admitted to four teaching hospitals including the First and the Sixth Affiliated Hospital of Sun Yat-sen University, the First Affiliated Hospital of Guangzhou Medical University, and Guangzhou Red Cross Hospital. Each hospital included surgical wards (Departments Gastrointestinal Surgery, hepatic surgery, Breast & thyroid surgery and Thoracic Surgery) and internal medicine wards (Departments of Gastroenterology, Pulmonology, Neurology and Nephrology). All patients gave written informed consent. The trial was approved by the Ethics Committee of all four teaching hospitals (Register No S054, Clinical trial register No NCT00289380). The study was performed in accordance with the ethical standards laid down in the Declaration of Helsinki.
Patient Enrollment
Patients were interviewed with a questionnaire composed of the items in NRS-2002 within 24 hours after admission. Inclusion criteria were as following: 1) age of 18-80 years old at entry; 2) length of hospital stay >1 day; 3) not given surgery within 24 hours after admission; 4) good orientation to time and place; 5) able to speak and understand Chinese. Exclusion criteria included coma patients, uncooperative patients and patients underwent surgery within 24 hours after admission.
Nutritional Risk Screening and Data Collection
General information on changes of body weight, feeding habits, and fluid retention (presence or absence of edema) were obtained after admission. The patients’ height and body weight at admission were measured using a calibrated scale to calculate individual body mass index (BMI) values (BMI = Weight[kg]/(Height[m])2 ). Weight was weighted with the subjects in light clothes and no shoes using a mechanical scale to the nearest 0.1 kg. Height was measured using a fixed tape to the nearest 0.1 cm. According to the Chinese criteria by Working Group on Obesity in China,15 patients were defined as malnutrition if a BMI<18.5 kg/m2 combined with an impaired general condition, overweight if a BMI was between 24 kg/m2 and 28 kg/m2 , and obesity if a BMI>28 kg/m2 . NRS score was calculated by adding the nutritional status score (0 to 3) to the disease severity score (0 to 3), plus a score of 1 for age of patient ≥70 years old. The nutritional status score was based on weight loss, reduced food intake, and BMI, as described previously. The severity of disease was categorized as absent, mild, moderate or severe (score 0-3) according to prototype provided previously and converted to a score of 0-3. Patients with an NRS score ≥3 were considered nutritionally “at risk”. Parenteral Nutrition (PN) was defined as nutrients administered intravenously that contain a combination of carbohydrate, amino acids or fatty acids. Enteral Nutrition (EN) was defined as oral nutrient supplements or tube feeding. Patients who received EN or PN for at least 3 days were included in the nutritional-therapy group. All primary data were confirmed within 24 hours after the patient was discharged and put into the Epidata database where the software was able to perform logical check and finally determine an object database.
Statistical Analysis
Statistical analysis was performed with SPSS 16.0 (Chicago, IL, USA). Descriptive data were presented as mean ± SD or percentages. Student-t test or F test were used for the comparison of continuous variables among different groups. Chi-square analysis was used for the comparison of incidence rate among different groups. A p-value<0.05 was considered statistically significant.><0.05 was considered statistically significant.
RESULTS
General Data
Between April to December 2008, a total of 2602 patients were investigated and 1278 patients were in the final analysis (Figure 1). Patient demographics and nutritional risk status at admission in each ward were shown in table 1. Among them, 551 patients were in surgical wards (the surgical group) and 727 patients were in internal medicine wards (the internal group). There was no difference in gender between the two groups (Table2). Mean age in the internal group was about 8 years older than that in the surgical group (61.21±15.64 versus 53.10±16.30, p<0.0001).
Figure 1: Participant flow
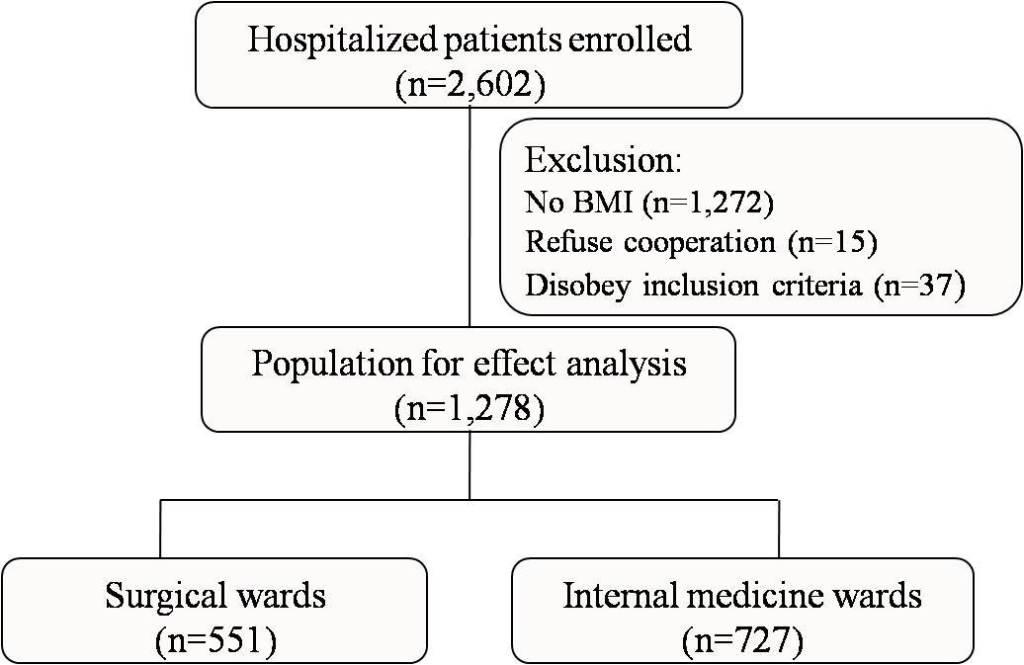
Table 1: Patient demographics and nutritional risk status at admission in each ward
| |
GI surgery |
Hepatic surgery |
Breast & thyroid surgery |
Thoracic Surgery |
Gastroenterology |
Pulmonology |
Neurology |
Nephrology |
| Number of patients |
215 |
26 |
109 |
201 |
262 |
200 |
133 |
132 |
| Male |
129 |
14 |
33 |
147 |
159 |
147 |
61 |
73 |
| Female |
86 |
12 |
76 |
54 |
103 |
53 |
72 |
59 |
| Age (years), mean±SD |
52.38±16.23 |
55.38±19.23 |
49.12±16.51 |
55.72±15.46 |
56.45±16.39 |
61.59±15.2 |
65.44±12.73 |
65.8±14.85 |
| Age≥70 years, %(n) |
18.60% (40) |
30.77% (8) |
15.60% (17) |
18.91% (38) |
22.90% (60) |
39.50% (79) |
48.12% (64) |
50.76% (67) |
| BMI (kg/m2), mean±SD |
21.3±3.22 |
21.53±3.01 |
22.46±2.81 |
21.85±3.5 |
21.79±3.21 |
20.53±4.09 |
22.36±2.7 |
22.79±4.41 |
| Undernutrition, %(n) |
16.74% (36) |
11.54% (3) |
5.50% (6) |
18.91% (38) |
11.07% (29) |
31.50% (63) |
5.26% (7) |
14.39% (19) |
| Normal, %(n) |
63.72% (137) |
76.92% (20) |
61.47% (67) |
50.75% (102) |
61.83% (162) |
51.50% (103) |
67.67% (90) |
52.27% (69) |
| Overweight, %(n) |
15.81% (34) |
7.69% (2) |
30.28% (33) |
26.37% (53) |
23.28% (61) |
13.50% (27) |
24.81% (33) |
23.48% (31) |
| Obesity, %(n) |
3.72% (8) |
3.85% (1) |
2.75% (3) |
3.98% (8) |
3.82% (10) |
3.50% (7) |
2.26% (3) |
9.85% (13) |
| nrs≥3, %(n) |
29.3% (63) |
42.3% (11) |
10.1% (11) |
32.3% (65) |
24.0% (63) |
58.0% (116) |
36.1% (48) |
45.5% (60) |
| nrs<3, %(n) |
70.7% (152) |
57.7% (15) |
89.9% (98) |
67.7% (136) |
76.0% (199) |
42.0% (84) |
63.9% (85) |
54.5% (72) |
The Prevalence of Malnutrition and Nutritional Risk
Prevalence of malnutrition was 16.23% in the internal group which was similar to that in the surgical group (16.23% versus 15.06%, p=0.5702). Incidence rate of nutritional risk was significantly higher in the internal group compared to the surgical group (39.48% versus 27.22%, p<0.0001). These results demonstrated that NRS-2002 could detect difference existed in the two groups (Table 2).>< 0.0001). These results demonstrated that NRS-2002 could detect difference existed in the two groups (Table 2).
Table 2: Nutritional risk status of patients at admission in surgical and internal medicine wards
|
Internal medicine wards |
Surgical wards |
P-value |
|
Gender (n, %)
|
|
|
0.471
|
|
Male
|
440(60.52%)
|
323(58.62%)
|
|
|
Female (n, %)
|
287(39.48%)
|
228(41.38%)
|
|
|
Age (Mean±SD)
|
61.21(15.64)
|
53.10(16.30)
|
<.0001
|
|
NRS score
|
|
|
<.0001
|
|
NRS≥3(n, %)
|
287(39.48%)
|
150(27.22%) |
|
|
NRS
|
440(60.52%)
|
401(72.78%) |
|
|
BMI
|
|
|
0.5702
|
|
BMI≥18.5(n, %)
|
609(83.77%)
|
468(84.94%)
|
|
|
BMI<18.5(n, %) >I<18.5(n, %)
|
118(16.23%)
|
3(15.06%)
|
|
Nutritional Therapy for Patients in Surgical and Internal Medicine Wards
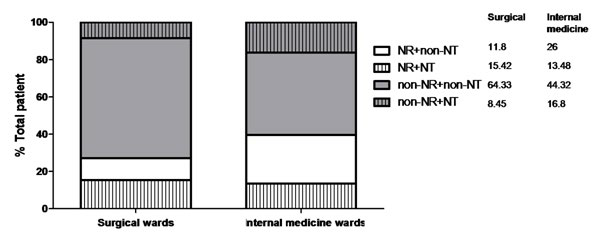
Among patients with malnutrition, 39.83% patients in the internal group and 54.22% in the surgical group under-went nutritional therapy (Table 3). More patients in the surgical group received nutritional therapy than in the internal group (p=0.0438). Similar results were observed to patients with nutritional risk (Table 3). More patients with nutritional risks were given nutritional therapy in the surgical group than that in the internal group (56.67% vs. 34.15%, p<0.0001). Fewer patients without nutritional risks underwent nutritional therapy in the surgical group than in internal group (13.97% vs. 22.27%, p=0.0019)]. Figure 2 showed clearly that more patients without nutritional risk (16.8% vs. 8.45%) and fewer patients with nutritional risk (13.48% vs. 15.42%) underwent nutritional therapy in the internal group compared to those in the surgical group.>< 0.0001). Fewer patients without nutritional risks underwent nutritional therapy in the surgical group than in internal group (13.97% vs. 22.27%, p=0.0019)]. Figure 2 showed clearly that more patients without nutritional risk (16.8% vs. 8.45%) and fewer patients with nutritional risk (13.48% vs. 15.42%) underwent nutritional therapy in the internal group compared to those in the surgical group.
Table 3: Implementation of nutrition therapy for patients in surgical and internal medicine wards
|
Internal medicine wards
|
Surgical wards
|
P-value
|
| Nutritional therapy |
|
0.5819
|
| Yes |
196(26.96%)
|
141(25.59%)
|
|
| No |
531(73.04%)
|
410(74.41%)
|
|
| NRS≥3 and nutritional therapy |
|
<.0001
|
| Yes |
98(34.15%)
|
85(56.67%)
|
|
| No |
189 (65.85%)
|
65(43.33%)
|
|
| NRS<3 and nutritional therapy><3 and nutritional therapy |
|
0.0019
|
| Yes |
98(22.27%)
|
56(13.97%)
|
|
| No |
342(77.73%)
|
345(86.03%)
|
|
| BMI<18.5 and nutritional therapy><18.5 and nutritional therapy |
|
0.0438
|
| Yes |
47(39.83%) |
45(54.22%) |
|
| No |
71(60.17%) |
38(45.78%) |
|
| BMI≥18.5 and nutritional therapy |
|
0.125 |
| Yes |
149(24.47%) |
96(20.51%) |
|
| No |
460(75.53%) |
372(79.49%) |
|
Figure 2: Distribution of patients with or without nutritional risk underwent nutrition therapy or not. NR is abbreviation of nutritional risk and NT represents nutrition therapy.
CONCLUSION/DISCUSSION
The NRS-2002 was used as the screening method in this study. Differences on nutritional status between the surgical and internal groups were not detected by BMI but by NRS2002. It demonstrated that NRS-2002 was more sensitive to detect difference among different groups of hospitalized patients. NRS-2002 was also found to be a sensitive tool for hospitalized patients by other studies.16,17 An NRS score showed both nutritional status and the severity of disease. Repeated point prevalence surveys could reflect changes in nutritional status and disease severity.3,14 In our study, some patients were excluded for BMI score missed. We could not measure weight and height for these patients because of incapable to or unwilling to cooperate. As van Bokhorst-de van der Schueren, et al. mentioned that not one single screening or assessment tool was capable of adequate nutrition screening as well as predicting poor nutrition related outcome.18 Kuppinger, et al. found that the NRS-2002 alone was insufficient to precisely predict complications and a modified NRS-2002 classification might be required to preoperatively identify patients at a high nutritional risk for surgical patients with non-abdominal diseases.19 However, Kuppinger et al. did not deny the value of NRS-2002. They modified the value of NRS-2002 to “≥2 or<2”, rather than “≥3 or <3” as it is currently classified. Most importantly, the theory proposed by Kuppinger et al. has not been widely recognized, while NRS-2002 is widely recognized and is recommended by European Society of Parenteral and Enteral Nutrition (ESPEN). In order to make our study more comparable with other studies, we decided to take NRS2002 as the assessment tool.
By using the NRS-2002 screening tool, we found that prevalence of nutritional risk was significantly higher in the internal group compared to the surgical group. One reason for this difference should be partially related with the difference in mean age between the two groups. It is well known that older patients have higher risk of malnutrition.20 Mean age in internal wards was 8-year older than that in surgical wards. Another reason might be better patient performance in surgical wards compared to internal medicine wards. For those patients with worse performance might not be suitable for an elective surgery, they usually admit to the internal medicine ward for preoperative preparation. Malnutrition could cause impaired immunity and increased complications such as stress ulcer, infection, organ dysfunction, etc.21 Malnutrition and nutritional risk were recognized as major causes of morbidity and mortality for hospitalized patients.22 Thus, patients with malnutrition and nutritional risk should be given nutrition therapy, even underwent surgery after two weeks nutritional therapy.23,24
Nutritional screening has been recommended as the first step to individualized nutritional treatment in some clinical guidelines.9,14 Researches demonstrated that implementation of nutritional therapy based on nutritional screening results significantly improved clinical outcomes.4,13 ESPEN guideline suggested that nutritional therapy should be started if undernutrition already existed or an inadequate food intake (<60% of estimated energy expenditure) was anticipated for more than 10 days.23,24 However, these positive results and guidelines have not gained wide recognition, since the most recent studies showed that adequate dietary intake and/or adequate artificial nutrition support was almost non-existent among undernourished patients.25 In most cases, this was not due to the disease process but rather due to lack of involvement of hospital and department managements, combined with a lack of knowledge of elementary theoretical and practical aspects of clinical nutrition among staff members.14 In current study, we found that more non-nutritional risk patients and fewer nutritional risk patients in internal medicine wards underwent nutritional therapy compared to those in surgical wards. Both surgical wards and internal medicine wards had less than 60% patients in nutritional risks underwent nutritional therapy. These denote a lack of appropriate implementation of nutrition therapy and adequate daily energy and protein intake for undernourished hospitalized patients.4 These results implied that implementation of nutrition therapy should be based on nutritional screening results as clinical guidelines suggested.>(<60% of estimated energy expenditure) was anticipated for more than 10 days.23,24 However, these positive results and guidelines have not gained wide recognition, since the most recent studies showed that adequate dietary intake and/or adequate artificial nutrition support was almost non-existent among undernourished patients. 25 In most cases, this was not due to the disease process but rather due to lack of involvement of hospital and department managements, combined with a lack of knowledge of elementary theoretical and practical aspects of clinical nutrition among staff members.14 In current study, we found that more non-nutritional risk patients and fewer nutritional risk patients in internal medicine wards underwent nutritional therapy compared to those in surgical wards. Both surgical wards and internal medicine wards had less than 60% patients in nutritional risks underwent nutritional therapy. These denote a lack of appropriate implementation of nutrition therapy and adequate daily energy and protein intake for undernourished hospitalized patients.4 These results implied that implementation of nutrition therapy should be based on nutritional screening results as clinical guidelines suggested.
In summary, the NRS-2002 was an optional screening tool for hospitalized patients. Nutritional risk and inappropriate nutrition therapy were more common among patients in internal medicine wards than those in surgical wards. Different diseases may be the main reason for this difference besides patient’s age and performances. Nutritional risk and nutrition therapy should be intensively evaluated among patients with internal diseases. Implement a rational nutrition therapy should be based on nutritional screening results.
COMPETING INTERESTS
The study was funded by the National Science & Technology Pillar Program. None of the authors report competing interests.
AUTHORS’ CONTRIBUTIONS
ZZJ and TBD are equal contributors to this work. ZCH, FS and HYL participated in setting up the research design and interpreted results. ZCH, TBD and MHY carried out the studies, data collection and interpreted results. ZZJ, MHY and ZCH participated in statistical analysis and drafted the manuscript. All authors read and approved the final manuscript.
ACKNOWLEDGEMENTS
The authors would like to acknowledge the assistance of Prof. Wenhua Zhan and Prof. Zhuming Jiang in study design and database establishment.
FUNDING
This study was supported by the National Science & Technology Pillar Program during the Eleventh Five-Year Plan Period (No. 2008BAD91B00)
CONFLICTS OF INTEREST: None


