INTRODUCTION
Non-communicable diseases (NCDs) have been the leading cause of mortality worldwide, with cardiovascular diseases (CVDs) being the most predominant.1 This trend is not different from that observed in the United States.2,3 Despite overall reductions in deaths from CVDs over the past few decades, approximately 2,200 individuals in the United States (U.S.) die of CVDs each day.3 This represents a serious public health problem.
Cardiovascular disease risk factors are conditions that are associated with the early onset of the disease. Some of these risk factors are modifiable while others are not. Modifiable CVD risk factors include smoking, dyslipidaemia, obesity, diabetes, hypertension, sedentarism, psychosocial stress. Age, sex, and heredity are not modifiable risk factors.4,5 Certain types of dyslipidaemia are hereditary and may not be modifiable, for example, familial hypercholesterolemia.6 Some studies have shown that high-income persons have a lower cardiovascular risk as opposed to low-income individuals. This shows that the socio-economic status plays a vital role in the development of CVDs. People suffering from food insecurity will be exposed to high energy foods and saturated fatty acid foods. Such food types are cheap and readily available. Among other factors, low educational level plays a role in the consumption of poor-quality foods.
Dyslipidaemia is defined as an increased triglyceride and lowered high-density lipoprotein cholesterollevel in serum. Itis a common CVD risk factor and has been demonstrated to be associated with increased risk of developing CVDs.1,5 Differences in dyslipidaemia are seen across population, race, and ethnic groups. In the U.S., Non-Hispanic blacks have much higher death rates from CVDs and stroke than other races.3
There are different types of cholesterol with varying functions and the level of serum cholesterol is influenced by several factors. Several epidemiological studies have demonstrated that increased levels of plasma total cholesterol and low-density lipoproteins (LDL) are strongly and directly related to a greater incidence of coronary heart disease.7 Elevated plasma triglycerides and very-low-density lipoproteins (VLDL) are directly associated with the risk of atherosclerotic heart disease, although not as independent risk factors.6 In contrast, high-levels of high-density lipoprotein-cholesterol (HDL-C) have been found to be a protective factor for the development of CVDs, hence, also known as “good cholesterol”.6 HDL-C protects against heart disease by transporting the “bad cholesterol” from the blood to the liver, preventing accumulation in the arteries. Low-levels of HDL-C are therefore considered a risk factor for CVDs.2,6 In addition, low HDL-C is used to determine metabolic syndrome.2 Metabolic syndromeconsists of a group of risk factors for CVDs and type 2 diabetes mellitus (T2DM), which often occur together. These risk factors include raised blood pressure, dyslipidaemia, raised fasting glucose and central obesity.5
Alberti et al5 further noted that patients with metabolic syndrome are twice at risk of developing CVD over the next 5 to 10-years compared to individuals without metabolic syndrome, therefore risk increases overtime. Also, metabolic syndrome confers a five-fold increase in risk for T2DM in such patients.5
An increased waist circumference is attributed to poor lifestyle and is used to measure central obesity; a characteristic of metabolic syndrome. This has several implications, including insulin resistance in diabetic patients. With changes in lifestyles such as increased sedentarism, increased consumption of cheap fatty foods, smoking, and lack of physical exercise, there is risk of total cholesterol accumulation in the blood and a decrease in HDL-C. Many studies have reported an increase in sedentary lifestyle among the adults of the U.S.8 It is therefore necessary to examine HDL-C levels and the pattern of its distribution across the U.S. population. Knowing the prevalence and factors associated with low HDL-C will help policy makers to take better measures and initiatives to prevent CVDs.
The objective of this study was to determine the prevalence of low HDL-C and its associated risk factors. The pattern of distribution of HDL-C was also investigated. We hypothesised that an unhealthy lifestyle and low socio-economic status are associated with low HDL-C. We further hypothesize that some demographic characteristics are linked to HDL-C.
METHODOLOGY
Description of Variables
There were 13 variables included in the data analysis. The selection of these variables from the dataset was based on the available published literature, underpinned by the knowledge of the investigators. The outcome variable was HDL-C (continuous variable). This was dichotomised into low (< 1.03 mmol/L) and normal (≥1.03 mmol/L) HDL-C. The explanatory variables were age, sex, ethnicity, marital status, educational level, country of birth, family income to poverty ratio, number of children aged 0-18-years per household, smoking, health insurance coverage, waist circumference and total cholesterol.
In the analyses of the relationship between the explanatory variables and the outcome variables, some variables were categorized based on the literature and standards. Age was categorised based on the existing literature into six categories, with a 10-year interval. The number of children aged 0-18-years in a household was grouped into five categories; households with five or more children are generally considered to have more financial constraints. The waist circumference was classified into normal and enlarged, based on sex. This grouping was based on the recommended normal waist circumference for males(≤102 cm) and females(≤88 cm) from the National Cholesterol Education Program – Adult Treatment Panel III (NCEP ATPIII) (2001). The marital status categories were married, widowed, divorced, separated, never married, and living with partner. The educational attainment level was grouped as less than 9th grade education, 9-11th grade education (includes 12th grade and no diploma), high school graduate/GED, some college or associates (AA) degree and college graduate or higher. Ethnicity was categorised as Mexican American, other Hispanic, Non-Hispanic White, Non-Hispanic Black and other race-including multi-racial. The country of birth was dichotomised into U.S. or other. The smoking status was categorized as never smoked, former smoker or current smoker. Health insurance coverage was dichotomised into being covered or not.
Some categories with a small number of observations that had no direct influence on the analysis were either merged with another category or considered as missing. For instance, for the variable health insurance coverage, those who refused to respond (n=3) and those who did not know (n=4) were all considered to be missing values. Those who refused to disclose their marital status (n=2) were also considered as missing values. One participant did not know their country of birth, and this was considered a missing value. One person did not know his/her educational level, this was classified as missing. Also, two outliers were considered as missing values for HDL-C.
Statistical Analysis
Statistical analyses were performed using Stata version 14.0 (StataCorp LP, College Station, Texas, 77,845 USA). The results are described as means and standard deviation (SD) for group and continuous variables. Proportions are also presented for categorical variables.
High-density lipoprotein-cholesterol as a continuous variable: The association between HDL-C and age groups, marital status, educational level, ethnicity, number of children per household and smoking status were assessed using the one-way analysis of variance with f-test. Meanwhile for binary categories; sex, country of birth, insurance coverage and waist circumference categories, the Student’s t-test was used as the measure of association. Normality check of HDL-C was confirmed with a histogram and homoscedasticity using the Levene’s test. A simple linear regression was used to test the significance of an increase or decrease of mean HDL-C values across groupsor continuous variables taking validity conditions into consideration. Collinearity was checked using the variance inflation factor (VIF) and all variables had a VIF<10. The multivariate linear regression model was used to check the association of the independent variables to HDL-C. The step-by-step method was used, taking probability of entry to be 5% and of removal 10%. Normality of residuals was assessed using Qnorm and the Breusch-Pagan test, normality present (p value not significant).
Low high-density lipoproteins-cholesterol as binary variable: A Chi-square (χ) test wasused to determine the prevalence and difference in prevalence across groups after examining its applicability. Socio-demographic factors (age, sex, country of birth, marital status, education level, health insurance coverage and number of children per household aged 0-18-years), anthropometric factor (waist circumference) and lifestyle factor (smoking), were created as dummy variables. Economic status (family income to poverty ratio) and nutrition factor (total cholesterol) were used as continuous variables. Univariate logistic regression was used to examine the risk of low HDL-C according to various determinants. The step-by-step method was used, and results compared with those of step wise approach, probability of entry 5% and of removal 10%. The results of both models were similar. The test of Hosmer and Lemeshow was used to check the fitness of the model the result was not significant (p=0.92), confirming the appropriateness of the model. The results presented are those of the step-by-step method. Adjusted odds ratio was presented together with a 95% confidence interval. All reported p-values were based on 2-sided tests and p-values<0.05 were considered statistically significant.
RESULTS
Basic Characteristics of Study Population
The general characteristics of the study population are shown in Table 1. This represents the whole cohort and complete cases. The results in the whole cohort and complete cohort were similar, further analysis was done on the complete cases. The sex distribution was almost equal between both genders. At least half of the respondents were married. Over a quarter of the respondents were at least college graduates. More than half of the respondents had never smoked and almost a quarter were current smokers. Majority of participants had health insurance coverage. The most predominant ethnic group was the non-hispanic white, accounting for 30% of the total population, while the least represented was other hispanic, constituting 14.1% of the population. Most of the participants (64.4%) were born in the U.S. Over half of the respondents had no children under 18-years of age in the household.
| Table 1. Overview of General Characteristics of the Study Population |
|
Whole Cohort
n=5,000
|
Complete Cases
n=3,989
|
| Sex |
| Male (%) |
49.4 |
49.0 |
| Missing (n) |
0 |
|
| Age (years) |
46.9±15.6 |
46.6±15.4 |
| 20-29 (%) |
17.8 |
18.1 |
| 30-39 (%) |
18.3 |
18.6 |
| 40-49 (%) |
18.5 |
18.9 |
| 50-59 (%) |
18.5 |
18.5 |
| 60-69 (%) |
19 |
18.7 |
| ≥70 (%) |
7.9 |
7.4 |
| Missing (n) |
0 |
|
| Marital Status |
| Married (%) |
51.1 |
52 |
| Widowed (%) |
4.2 |
3.9 |
| Divorced (%) |
10.9 |
10.7 |
| Separated (%) |
3.5 |
3.6 |
| Never married (%) |
19.8 |
19.3 |
| Living with partner (%) |
10.5 |
10.5 |
| Missing (n) |
2 |
|
| Educational Level |
| Less than 9th grade (%) |
11.1 |
10.5 |
| 9-11th grade (Includes 12th grade with no diploma) (%) |
12 |
10.9 |
| High school graduate/GED or equivalent (%) |
21.4 |
21.7 |
| Some college or AA degree (%) |
30 |
30.7 |
| College graduate or above (%) |
25.5 |
26.3 |
| Missing (n) |
1 |
|
| Ethnicity |
| Mexican American (%) |
17.9 |
17.7 |
| Other Hispanic (%) |
14.1 |
13.8 |
| Non-Hispanic White (%) |
30 |
32.4 |
| Non-Hispanic Black (%) |
21.7 |
20.5 |
| Other Race – Including Multi-Racial (%) |
16.2 |
15.6 |
| Missing(n) |
0 |
|
| Country of Birth |
| Born in 50 US or Washington, DC(%) |
64.4 |
65.7 |
| Other(%) |
35.6 |
34.3 |
| Missing (n) |
0 |
|
| Family income to poverty ratio |
2.46±1.62 |
2.48±1.61 |
| Missing (n) |
500 |
|
| Number of Children 0-18-Years per Household |
| 0(%) |
54 |
54.2 |
| 1(%) |
16.8 |
16.6 |
| 2(%) |
15.5 |
15.9 |
| 3(%) |
8.5 |
8.1 |
| 4(%) |
3.6 |
4 |
| ≥5(%) |
1.5 |
1.2 |
| Missing (n) |
0 |
|
| Smoking Status |
| Never smoked (%) |
58.1 |
57.9 |
| Former smoker (%) |
21.6 |
22.1 |
| Current smoker (%) |
20.3 |
20.1 |
| Missing (n) |
6 |
|
| Covered by Health Insurance |
| Yes (%) |
81.1 |
81.3 |
| Missing (n) |
7 |
|
| Waist circumference (cm) |
100.10±16.86 |
100.33±16.91 |
| Missing (n) |
403 |
|
| Total cholesterol (mmol/l) |
4.95±1.07 |
4.95±1.07 |
| Missing (n) |
405 |
|
| Direct HDL-cholesterol (mmol/l) |
1.39±0.45 |
1.39±0.45 |
| Missing (n) |
405 |
|
| Values are means±SD or numbers (percentages) as appropriate |
Several characteristics showed statistically significant associations with HDL-C in the univariate linear regression model. For instance, there was an increase of 0.03 mmol/L of HDL-C for any unit increase in family income to poverty ratio and this increase was statistically significant. Also, a 1.3% increasein HDL-C wasaccounted for by the family income to poverty ratio. Similarly, for any unit increase in the male waist circumference (cm), there was a decrease of 0.2 mmol/L of HDL-C and this decrease was statistically significant. This male waist circumference accounted for 5.9% decrease in HDL-C. In the age category, with age group 30-39-years as the reference, there was an increase in 0.08 mmol/L of HDL-C for the 50-59-years age group. Age contributedto only 1.0% of the change in HDL-C. In these comparisons, we assumed all other variables were held constant.
All variables were included in the multiple linear regression model (Table 2). After adjustment, marital status, educational level, smoking status and health insurance coverage were no longer statistically associated with HDL-C (all p>0.05). Males had a decrease of 0.23 mmol/L of HDL-C compared to females; this was similar to the result obtained in the univariate model. This suggests the other covariates had no effect on sex. Similarly, in the family income to poverty ratio, there wasa 0.02 mmol/L increase in HDL-C for any unit increase in the family income to poverty ratio, this increase was statistically significant. This increase was similar to that obtained with the univariate analysis. There was also no significant change in the association between HDL-C and the other variables: age, country of birth, number of children aged 0-18-years per household, ethnicity and total cholesterol when compared to the univariate results.
| Table 2. Variation of HDL-C with other Characteristics of the Study Population (Multiple Linear Regression) (n=3989) |
|
Complete Cases |
p |
| Adj b |
95%CI |
| Sex |
<0.001 |
| Male |
-0.23 |
(-0.25;-0.2) |
|
| Female |
(reference) |
|
|
| Age (years) |
|
|
<0.001 |
| 20-29 |
-0.004 |
(-0.05;0.04) |
|
| 30-39 |
(reference) |
|
|
| 40-49 |
-0.01 |
(-0.05;0.03) |
|
| 50-59 |
0.05 |
(0.01;0.10) |
|
| 60-69 |
0.09 |
(0.05;0.14) |
|
| ≥70 |
0.16 |
(0.10;0.22) |
|
| Marital Status |
0.41 |
| Married (%) |
(reference) |
|
|
| Widowed (%) |
0.01 |
(-0.06;0.08) |
|
| Divorced (%) |
0.03 |
(-0.01;0.07) |
|
| Separated (%) |
0.02 |
(-0.04;0.09) |
|
| Never married (%) |
0.03 |
(-0.01;0.06) |
|
| Living with partner (%) |
0.04 |
(0.001;0.09) |
|
| Educational Level |
0.17 |
| Less than 9th grade (%) |
-0.05 |
(-0.10;0.02) |
|
| 9-11th grade (Includes 12th grade with no diploma) (%) |
-0.03 |
(-0.08;0.02) |
|
| High school graduate/GED or equivalent (%) |
-0.04 |
(-0.08;-0.002) |
|
| Some college or AA degree (%) |
-0.04 |
(-0.07;-0.003) |
|
| College graduate or above (%) |
(reference) |
|
|
| Ethnicity |
<0.001 |
| Mexican American (%) |
(reference) |
|
|
| Other Hispanic (%) |
-0.01 |
(-0.05;0.04) |
|
| Non-Hispanic White (%) |
0.07 |
(0.03;0.11) |
|
| Non-Hispanic Black (%) |
0.16 |
(0.11;0.20) |
|
| Other Race – Including Multi-Racial (%) |
-0.01 |
(-0.05;0.04) |
|
| Country of Birth |
65 |
| Born in 50 US or Washington, DC (%) |
0.05 |
(0.02;0.09) |
|
| Other (%) |
(reference) |
|
|
| Number of Children 0-18-Years per Household |
0.01 |
| 0 |
0.07 |
(0.01;0.14) |
|
| 1 |
0.01 |
(-0.05;0.08) |
|
| 2 |
0.04 |
(-0.03;0.11) |
|
| 3 |
0.02 |
(-0.06;0.09) |
|
| 4 |
(reference) |
|
|
| ≥5 |
0.06 |
(-0.06;0.19) |
|
| Smoking Status |
0.08 |
| Never smoked |
(reference) |
|
|
| Former smoker |
-0.01 |
(-0.04;0.02) |
|
| Current smoker |
-0.04 |
(-0.07;-0.004) |
|
| Covered by Health Insurance |
0.07 |
| Yes |
(reference) |
|
|
| No |
-0.03 |
(0.02;0.002) |
|
| Waist circumference (cm) |
-0.01 |
(-0.01;-0.009) |
<0.001 |
| Family income to poverty ratio |
0.02 |
(0.01;0.03) |
<0.001 |
| Total cholesterol (mmol/l) |
0.05 |
(0.04;0.06) |
<0.001 |
| Adj b=slope adjusted for other covariates, CI= Confidence Interval |
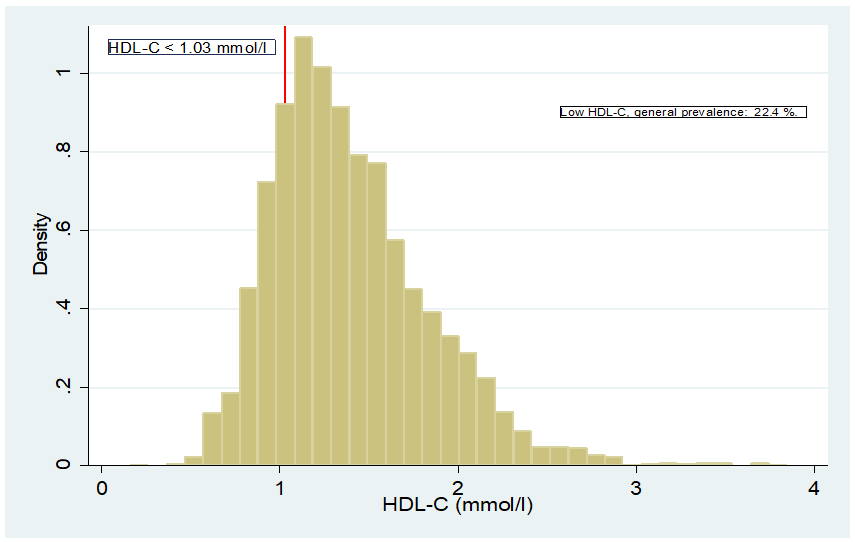
HDL-C Distribution
The prevalence of low HDL-C of the general population was 22.4%, Figure 1. This prevalence was more than two times higher in males than in females, 32.8% and 12.5%, respectively and this difference was statistically significant, Table 3. Elderly people above 70-years of age and thoseaged 20-29-years had lower HDL-C compared to the rest of the population. The prevalence of low HDL-C was statistically significant across the age group. Married individuals or those living with partners had lower HDL-C (25%) compared to those who were widowed, separated, divorcedor never married (almost 20%). The prevalence of low HDL-C was statistically significant across marital status. Men with an en larged waist circumference had a lower HDL-C (42.7%) compared to men with a normal waist circumference (24.8%) and this difference in prevalence was statistically significant. Similarly, females with an enlarged waist circumference hada nearly five-fold higher prevalence of low HDL-C (16.2%) as opposed to females with normal waist circumference (3.3%), this difference was also statistically significant. A higher prevalence of low HDL-C was found among current smokers compared to former smokers and those who had never smoked; these differences were statistically significant. There was no difference in the prevalence of low HDL-C between people born in the U.S. and those born in other countries.
Figure 1. HDL-C Distribution Across the Population
| Table 3. Prevalence of Low HDL-C According to the Sample Population Characteristics |
|
|
Complete Cases |
|
Low HDL-C |
| n |
% |
p |
| Sex |
<0.001 |
| Female |
254 |
12.5 |
|
| Male |
641 |
32.8 |
|
| Age (years) |
|
|
0.003 |
| 20-29 |
131 |
18.2 |
|
| 30-39 |
197 |
26.6 |
|
| 40-49 |
183 |
24.3 |
|
| 50-59 |
164 |
22.3 |
|
| 60-69 |
163 |
21.9 |
|
| ≥70 |
57 |
19.3 |
|
| Marital Status |
0.01 |
| Married |
500 |
24.1 |
|
| Widowed |
28 |
17.8 |
|
| Divorced |
82 |
19.3 |
|
| Separated |
28 |
19.7 |
|
| Never married |
149 |
19.4 |
|
| Living with partner |
108 |
25.8 |
|
| Educational Level |
<0.001 |
| Less than 9th grade |
107 |
25.7 |
|
| 9-11th grade (Includes 12th grade with no diploma) |
122 |
28.0 |
|
| High school graduate/GED or equivalent |
201 |
23.2 |
|
| Some college or AA degree |
277 |
22.7 |
|
| College graduate or above |
188 |
17.9 |
|
| Ethnicity |
<0.001 |
| Mexican American |
192 |
27.2 |
|
| Other Hispanic |
154 |
28.1 |
|
| Non-Hispanic White |
292 |
22.6 |
|
| Non-Hispanic Black |
120 |
14.7 |
|
| Other Race – Including Multi-Racial |
137 |
22.0 |
|
| Country of Birth |
0.21 |
| Born in 50 US or Washington, DC |
572 |
21.8 |
|
| Other |
323 |
23.6 |
|
| Number of Children 0-18-Years per Household |
0.008 |
| 0 |
444 |
20.6 |
|
| 1 |
161 |
24.4 |
|
| 2 |
147 |
23.2 |
|
| 3 |
78 |
24.1 |
|
| 4 |
50 |
31.3 |
|
| ≥5 |
15 |
30.6 |
|
| Smoking Status |
<0.001 |
| Never smoked |
433 |
18.8 |
|
| Former smoker |
234 |
26.6 |
|
| Current smoker |
228 |
28.5 |
|
| Covered by Health Insurance |
<0.001 |
| Yes |
684 |
21.1 |
|
| No |
211 |
28.3 |
|
| Waist Circumference (cm) |
| Male |
<0.001 |
| ≤102 |
270 |
24.8 |
|
| >102 |
371 |
42.7 |
|
| Female |
<0.001 |
| ≤88 |
19 |
3.3 |
|
| >88 |
235 |
16.2 |
|
| p-value of Pearson’s Chi-square test |
Univariate logistic regression showed that country of birth was not statistically significant. Males had higher odds of having low HDL-C compared to females (OR 3.42;95% CI: 2.90-4.01). The odds of having low HDL-L were 2.25 times higher in males with an enlarged waist circumference than males with a normal waist circumference. The odds of having low HDL-L were 5.75 times higher in females with an enlarged waist circumference than females with a normal waist circumference. Current smokers had higher odds of having low HDL-C compared to those who hadnever smoked (OR: 1.73; 95% CI: 1.43-2.08). Similarly, former smokers had higher odds of developing low HDL-C compared to those who had never smoked (OR: 1.57: 95% CI: 1.3-1.88). There were increasing odds of having low HDL-C across the number of children aged 0-18-years per household category.
All variables except country of birth were entered into the multiple logistic regression. Marital status, educational level, health insurance coverage and number of children aged 0-18-years per household were no longer significant, Table 4. The odds of having low HDL-C levels increased significantly from former smoker to current smoker. The association between smoking status and low HDL-C became stronger when the other covariates were considered in the multiple logistic regression than in the univariate, which suggests an effect modification. In the 20-29 and the ≥70 age groups,the odds of having low HDL were smaller than those between 30 and 59-years of age. The odds of developing low HDL-C decreased slightly in the multivariate logistic regression as opposed to the univariate for age, ethnicity and number of children aged 0-18-years per household. The risk of developing low HDL-C was 3.43 higher in males than in females. This was similar to that obtained with univariate model. This implied that the presence of other covariates did not affect the association between low HDL-C and sex. Similarly, the association between HDL-C and family income to poverty ratio or total cholesterol remained similar when the other covariates were considered in the multiple logistic regression.
| Table 4. Characteristics of the Sample Population Associated with Low HDL-C (multivariable logistic regression) (n=3989) |
|
Low HDL-C |
Likelihood Ratio test p |
| Adj OR |
(95%CI) |
| Sex |
<0.001 |
| Female |
1 |
|
|
| Male |
3.43 |
(2.88;4.1) |
|
| Age (years) |
|
|
0.04 |
| 20-29 |
1.24 |
(0.81;1.9) |
|
| 30-39 |
1.68 |
(1.12;2.52) |
|
| 40-49 |
1.69 |
(1.14;2.51) |
|
| 50-59 |
1.38 |
(0.94;2.01) |
|
| 60-69 |
1.26 |
(0.87;1.81) |
|
| ≥70 |
1 |
|
|
| Marital Status |
0.69 |
| Married |
0.97 |
(0.61;1.55) |
|
| Widowed |
1 |
|
|
| Divorced |
0.83 |
(0.49;1.39) |
|
| Separated |
0.75 |
(0.4;1.4) |
|
| Never married |
0.94 |
(0.56;1.57) |
|
| Living with partner |
1.05 |
(0.62;1.77) |
|
| Educational Level |
0.76 |
| Less than 9th grade |
1.08 |
(0.77;1.51) |
|
| 9-11th grade (Includes 12th grade with no diploma |
1.16 |
(0.85;1.59) |
|
| High school graduate/GED or equivalent |
1.01 |
(0.78;1.31) |
|
| Some college or AA degree |
1.13 |
(0.89;1.43) |
|
| College graduate or above |
1 |
|
|
| Ethnicity |
<0.001 |
| Mexican American |
2.28 |
(1.7;3.05) |
|
| Other Hispanic |
2.84 |
(2.11;3.82) |
|
| Non-Hispanic White |
1.91 |
(1.48;2.47) |
|
| Non-Hispanic Black |
1 |
|
|
| Other Race – Including Multi-Racial |
2.68 |
(1.97;3.64) |
|
| Number of Children aged 0-18-years per Household |
0.34 |
| 0 |
0.68 |
(0.34;1.38) |
|
| 1 |
0.82 |
(0.41;1.67) |
|
| 2 |
0.75 |
(0.37;1.53) |
|
| 3 |
0.7 |
(0.34;1.45) |
|
| 4 |
1.01 |
(0.47;2.18) |
|
| ≥5 |
1 |
|
|
| Smoking Status |
<0.001 |
| Never smoked |
1 |
|
|
| Former smoker |
1.14 |
(0.93;1.41) |
|
| Current smoker |
1.53 |
(1.23;1.89) |
|
| Covered by Health Insurance |
0.11 |
| Yes |
1 |
|
|
| No |
1.19 |
(0.96;1.48) |
|
| Waist circumference (cm) |
1.04 |
(1.03;1.04) |
<0.001 |
| Family income to poverty ratio |
0.93 |
(0.87;0.99) |
0.02 |
| Total cholesterol (mmol/l) |
0.91 |
(0.84;0.98) |
0.02 |
| Adj OR=Odds ratio adjusted for other covariates; CI=confidence interval. |
DISCUSSION AND CONCLUSION
The objective of this study was to determine the prevalence of low HDL-C and to investigate its associated risk factors. The prevalence of low HDL-C in our study was 22.4%. The results obtained from the multiple linear regression indicated that male gender, age, ethnicity, country of birth, number of children aged 0-18-years per household, waist circumference, family income to poverty ratio and total cholesterol were significantly associated with HDL-C. However, marital status, educational level, smoking status, and health insurance coverage were no longer statistically significant in the multiple linear regression model. In the univariate logistic regression model, only country of birth was not statistically associated with low HDL-C. After adjustment in the multiple logistic regression model, male gender, age 30 to 49-years, ethnicity, smoking, enlarged waist circumference, low family income to poverty ratio and high total cholesterol were significantly associated with low HDL-C. In the 20-29 and the ≥50 age groups, the odds ratio of low HDL-C was smaller than in the age group 30-49-years. This means that individuals in the extreme age groups were less likely to have low HDL-C compared to those aged 30-49-years.
A study by Aguilar-Salinas in Mexico reported the prevalence of low HDL-C to be higher in males than in females.9 This finding is similar to our results, which demonstrated that low HDL-C was predominant in males. It is well-known that HDL-C levels in men and women significantly differ due to the influence of estrogen and testosterone on the activities of hepatic lipase. This enzyme plays a role in HDL-C metabolism and its levels are inversely related with those of HDL-C.10 Estrogen and testosterone respectively tend to decrease and increase hepatic lipase levels, hence the discrepancies in HDL-C levels.11 Even though a lower cut off value was used in the Aguilar-Salinas study (<0.9 mmol/L), the prevalence of low HDL-C was still higher in their study than the prevalence obtained in our study (46.2% for men, 28.7% for women, and 36% for both genders).9 The Mexican population has been shown to have a higher predisposition to metabolic syndrome and dyslipidaemia.9,12 Genetic and environmental factors are linked to this predisposition.12 This may have contributed to the high-level of low HDL-C in this Mexican population. In our study, the Hispanic population has a higher prevalence of low HDL-C than other ethnic groups. This result is supported by the findings of Willey et al7 and Winkleby et al13 who found that the Hispanic population of the United States have higher-risk factors of CVDs including low HDL-C levels. The authors also reported higher-levels of HDL-C in non-hispanic blacks compared to other ethnic groups.
Ge et al1 found that low HDL-C is associated with smoking, an enlarged waist circumference and male gender. These findings are similar to the results obtained in our study where current smokers, an enlarged waist circumference and male gender are associated with a high prevalence of low HDL-C. Chang et al14 showed that high HDL-C was associated with total cholesterol. This also corroborates the results obtained in the present study where total cholesterol has a significant, positive association with HDL-C. Total cholesterol is the summation of all types of cholesterol in the blood, including HDL-C. Hence, an increase in HDL-C will likely be accompanied by an increase in total cholesterol and vice versa. An enlarged waist circumference is a sign of abdominal obesity and a risk factor for CVD. A study by Kim et al15 showed that an enlarged waist circumference is significantly associated with low HDL-C, and that HDL-C levels vary with sex,15 findings which are similar to the results obtained in this present study.
Economic status is an important determinant of the HDL-C levels. The present study found that family income to poverty ratio has a significant, positive association with HDL-C levels. An increase in family income to poverty ratio is accompanied by an increase in HDL-C levels. This result is similar to that obtained by Kim et al15 who found that the odds of low HDL-C levels increased significantly among unemployed men. This is pertinent in that the risk of CVD has gradually tilted to those with a low socio-economic status.
This study shows that HDL-C is significantly associated with age and there is a linear increase of HDL-C from age 50-years and older. This is supported by the studies of Cheung et al16 and Harman et al17 who found that age has a significant, positive association with HDL-C. In HDL-C studies in other populations however, there was no association of HDL-C with age.1 Similar differences have been reported and can be explained partly by the study population, study design, laboratory analysis and cut-off values used.
This study brings out pertinent issues regarding risk factors of low HDL-C. Low HDL-C is associated with CVDs, a major cause of non-communicable disease and mortality worldwide. Public health strategies targeting at-risk groups such as those with a low income to poverty ratio, those in the 30-49 age group and Hispanic Americans will be crucial in addressing the problem. The sale of foodstuffs should be continuously monitored, and the production of poor-quality, processed foods should be discouraged. Ingredients of food products should be clearly labelled on food packaging in plain, simple language and prices of HDL-C rich foods should be made affordable and accessible to everyone. Increasing the sensitisation of the public on risk factors of low HDL-C and CVDs is also necessary.
Education programs highlighting high-total cholesterol, smoking, and an enlarged waist circumference as risk factors of low HDL-C and consequently, poor cardiovascular outcomes are also a strategy. Smoking cessation and smoking prevention programs should be made available and accessible. This will help those facing difficulties stopping smoking and prevent new smokers. Interventions aimed at the discussion of health problems associated with smoking, not just the traditional risks that have been well communicated through health campaigns, but also on the higher-risk of CVDs is important and may not be as apparent as other well-known risks of smoking. Encouraging physical exercise and activity is an important element to reduce an enlarged waist circumference, as well as the encouragement of and education on healthy eating choices and habits. Initiatives that consider the cultural habits and language of Hispanics should also be considered.
A strength of this study was that the population included different ethnic groups which are important in demonstrating variation in HDL-C levels. Also, the missing values were less than 8% which is acceptable instatistical analysis. In addition, the wide age range in the study population was suitable for this study. Lastly, the data was part of repeated cross-sectional study and hence the results can be compared to those obtained in previous years. However, this should be done with caution as it is part of a larger study.
This study acknowledges some limitations. Firstly, important confounders such as diabetes and hypertension were not included in the analysis. Thus, the cause of low HDL-C could have been due to diabetes, hypertension, or other metabolic diseases. In addition, we did not consider cholesterol lowering medications or drugs that could raise cholesterol level in the study. These could also have affected the HDL-C levels.
Future research should take into consideration personal conditions like diabetes, hypertension, used of medications that can affect cholesterol levels. It would also be interesting to carryout similar study in low- and middle-income countries where the double burden of diseases has been noted. This will contribute further evidence and will help shape interventions. The health seeking behaviour of the at-risk population (Hispanics, males and the 30-49-year age group) warrants further research.
In conclusion, this study found the prevalence of low HDL-C was relatively high. Lifestyle modification is important in the prevention of low HDL-C and consequently, CVDs. The results however, should be used with caution as this does not represent the entire U.S. population.
ETHICS APPROVAL AND CONSENT TO PARTICIPATE
The study is based on secondary data analysis of the National Health and Nutrition Examination Survey (NHANES) 2015-2016. This data is available on https://wwwn.cdc.gov/nchs/nhanes/continuousnhanes/default.aspx?BeginYear=2015.
FUNDING
This study was not funded.
CONFLICTS OF INTEREST
The authors declare that they have no conflicts of interest.


