INTRODUCTION
As the Veterans Health Administration (VHA) takes steps to modernize health system operations,1 the rates of health outcomes and health service utilization over time will be an important component for monitoring progress and refining health planning activities. Monitoring clinical preventive services, such as screening for mental health conditions and substance abuse or vision disorders among Veterans using the VHA system1,2 may require the calculation and monitoring of rates within the system and across time periods. Along with other administrative data, these rates may be useful in health system planning.
Comparing health outcome and health service utilization rates within a health care system across populations or time periods are an essential component of health system planning, monitoring, and health program evaluation. Yet, the comparison of crude rates across time or populations without adjustment, at least for age, is less than ideal and could lead to faulty conclusions from the health system data on which resource allocation decisions are based.3 The structure of a population and how it may change over time could affect the interpretation and use of health service utilization rates.
The health of a population cannot be measured directly, so inferences are made by using other measures. Information about a population’s health can be derived from measures such as4:
• Health-related characteristics or risk factors—measures of deprivation, living conditions, employment, housing, etc.
• Mortality—death in a population
• Morbidity—illness in a population
• Health service use data—diagnoses, interventions and
procedures, and health outcomes in a population
Crude rates are usually reported for these measures, but using these rates to measure mortality across time and populations while overlooking possible changes in the structure of the underlying population could lead to misleading recommendations.4,5
In recognition of the importance of understanding the U.S. Veteran population structure for VHA health planning, this review explores U.S. Veteran population projection data from 2015 to 2040. We also compare U.S. adult population projections for the same period with emphasis on the structure of the populations. We discuss the implications of Veteran population structure on health planning and monitoring population health outcomes.
METHODS
Using an ecological design, secondary data were used to examine the Veteran and adult population structures from 2015 to 2040. This examination relied on publicly-available population projections from the U.S. Department of Veterans affairs (VA) and the U.S. Bureau of the Census.6,7 The data were downloaded from public-facing websites and organized by age group and sex for 2015, 2020, 2030, and 2040.
Specifically, the Veteran population data were derived from the Veteran Population Projection Model8: The Veteran Population Projection Model 2016 (VetPop2016) provides the latest official Veteran population projections. VetPop2016 is an actuarial projection model developed by VA Office of predictive analytics and actuary (PAA) for Veteran population projections from Fiscal Year (FY) 2015 to FY2045. Using the best available Veteran data by the end of FY2015, VetPop2016 provides Veteran counts based on key demographic characteristics such as age group in years (17 to 19-years {or <20years}; 20 to 24-years; etc.), sex, period of service, and race/ethnicity at various geographic levels for the next 30 years. Similarly, the adult population [non-Veteran] data were from the Census Bureau’s data table entitled, “Population projections for the United States from 2015 to 2060 (in millions).”
The population projections from both agencies relied on the cohort-component method.8,9 This method for population projection and estimation has the advantage of maintaining knowledge of the underlying age distribution in the population over time. The methods used by the VA is essentially identical to the equation used by the Census Bureau for their population projections.9
The percentage of males and females for each age group in the Veteran and US adult population were calculated based on the datasets. Population pyramids were constructed for the data (in millions) from each year for the Veterans and the corresponding data for the adult population. The differences in these population pyramids were observed. Population pyramids illustrate how a population may transform itself over time; this transformation, with emphasis on changes in age of a population, may impact the experience of illness and disease in the same population with implications for health planning.10,11
RESULTS
In Table 1, we examined the projected Veteran population structure from 2015 to 2040 according to age group and sex. The U.S. adult population was also examined in the same manner (not shown). In the table, the population projections are presented for a 25-year period assuming that no armed conflict will change the structure of the projections.
| Table 1. U.S. Veteran Population Structures (%) for 2015, 2020, 2030,2040 |
|
2015 (N=18,823,869) |
2020 (N=18,823,869) |
2030 (N=15,466,321) |
2040 (N=12,925,893) |
| Age Groups (yrs) |
Male |
Female |
Male |
Female |
Male |
Female |
Male |
Female |
| <20 |
0.04 |
0.17 |
0.03 |
0.11 |
0.04 |
0.10 |
0.05 |
0.09 |
| 20-24 |
1.18 |
3.13 |
1.16 |
2.82 |
1.39 |
2.51 |
1.73 |
2.47 |
| 25-29 |
3.23 |
7.40 |
3.01 |
6.71 |
3.33 |
5.77 |
4.18 |
5.73 |
| 30-34 |
4.21 |
10.05 |
4.45 |
8.89 |
4.13 |
7.11 |
5.12 |
6.95 |
| 35-39 |
4.15 |
9.86 |
5.02 |
10.25 |
4.81 |
7.97 |
5.45 |
7.30 |
| 40-44 |
4.73 |
9.14 |
4.98 |
9.87 |
6.27 |
9.22 |
5.90 |
7.68 |
| 45-49 |
6.56 |
10.67 |
5.53 |
8.97 |
7.04 |
10.30 |
6.70 |
8.27 |
| 50-54 |
7.79 |
11.91 |
7.33 |
10.16 |
6.57 |
9.45 |
8.15 |
9.12 |
| 55-59 |
9.02 |
12.04 |
8.45 |
11.10 |
6.78 |
8.24 |
8.55 |
9.74 |
| 60-64 |
9.35 |
9.03 |
9.59 |
11.07 |
8.54 |
9.02 |
7.61 |
8.68 |
| 65-69 |
14.95 |
5.21 |
9.68 |
8.16 |
9.44 |
9.53 |
7.53 |
7.35 |
| 70-74 |
11.12 |
3.34 |
14.81 |
4.55 |
10.14 |
9.08 |
9.00 |
7.68 |
| 75-79 |
7.82 |
2.36 |
10.46 |
2.78 |
9.25 |
6.19 |
9.15 |
7.49 |
| 80-84 |
7.49 |
2.11 |
6.64 |
1.81 |
11.95 |
3.02 |
8.59 |
6.34 |
| 85+ |
8.37 |
3.59 |
8.86 |
2.76 |
10.30 |
2.50 |
12.30 |
5.10 |
| Total |
100.00 |
100.00 |
100.00 |
100.00 |
100.00 |
100.00 |
100.00 |
100.00 |
| Data Sources: 6 |
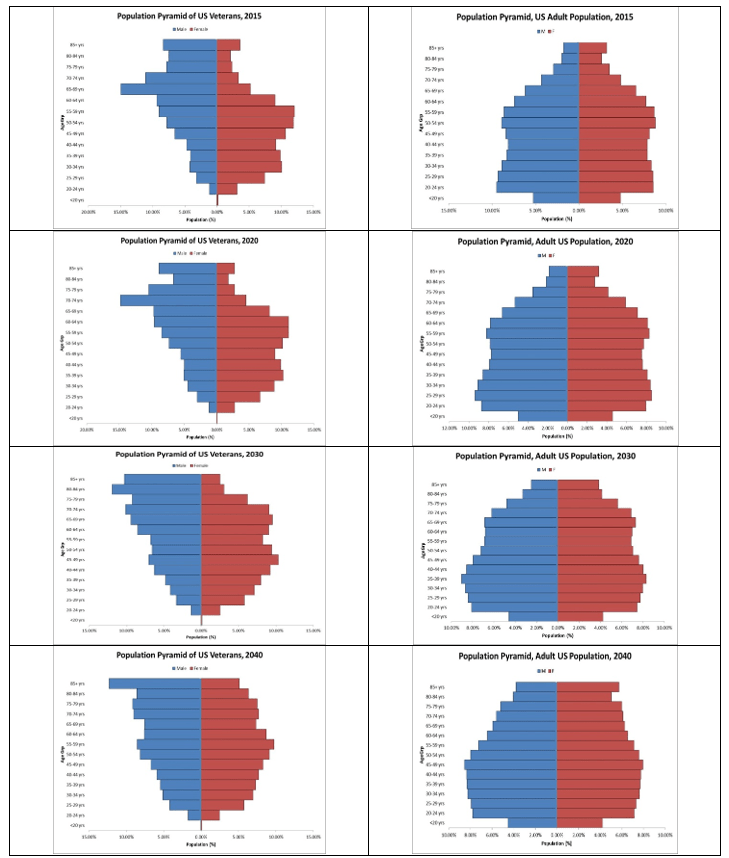
The population pyramids constructed using the projected population data are effective graphical representations of these data patterns. Over time, the US Adult population is projected to increase while the US Veteran population is projected to decrease. The underlying data from Table 1 for the projected Veteran population structures for the indicated periods along with companion data for the adult population for the same periods were used to create the population pyramids.
In Figure 1, the Veteran and adult population projections for the 25-year period are placed side-by-side. In each pyramid, the data representing the projections for males by age group (17 years and above) are on the left-side of the pyramid (blue); that for females are on the right-side (red). We note that each Veteran population structure from 2015 to 2040 differs from that of the adult population for the same period. This may be related to the military experiences of the US Veteran population were different from the experiences of the US adult population who were not on active duty along with the fact that more men enlist in US military service compared to the number of women who enlist.
DISCUSSION
We examined the population projection data from 2015 to 2040 to obtain a better idea of what the U.S. Veteran population may look like in the next 25-years. We observed that the Veteran population is projected to decrease from 21 million in 2015 to 13 million by 2040 (Table 1). During this period, the U.S. adult population is projected to increase from 321 million to 380 million. Study of the population pyramids for Veterans showed that between 2015 and 2040, not only would the proportion of female Veterans increase over time but also that there will be a greater representation of Veterans in the older age groups (Figure 1).
Figure 1. U.S. Veteran and Adult Projected Population Pyramids, 2015 through 2040
Implications for Health Planning in VHA
Increasing access to health care, preventing unnecessary duplication of services, and enhancing the acceptability of care are examples of objectives used in health planning to improve a population’s health.3 Consideration of population health needs based, in part, on population structure is important for health planning efforts that seek to improve population health. Additionally, military service may impact the health needs of a population and may need to be considered in health planning efforts.
The density and sex distribution data of the Veteran population structure for the 25-year period (Table 1) might suggest possible health conditions that health system administrators, health planners, and managerial epidemiologists could study in greater detail for Veterans using the VHA system.3 For health planning purposes, the population pyramid could be examined, generally, by age group and the health needs of Veterans in each age grouping can be considered in terms of acute health care and rehabilitation, health and wellness, community health, and Veteran reintegration.12 Models of health care and rehabilitation stemming from the effects of military service for Veteransin each population group could drive health planning efforts. Similarly, the influences of military service could shape health and wellness plans, community health, and Veteran reintegration activities with the local community according to Veterans at each age group.
Implications for Monitoring Long-Term Population Health Outcomes
Since projections showed that the Veteran population age will increase over time, it will be important to monitor the rates of important health outcomes over time to determine long-term success toward meeting health planning goals to improve Veteran population health. There are well-known disadvantages to comparing crude health outcome rates over time without adjustment.13,14,15 Ahmad et al16 provided a justification for using a “standard reference population” to compare rates in populations over time; the selection of such a population is arbitrary but agreement on what will be the “standard reference population” is essential for long-term, population rate comparisons.16 Comparing health outcome rates in a population over time using a “standard reference population” is necessary for making health system decision-making based on population-based data; effectively interpreted data are needed to monitor and improve the utilization of public medical services for the benefit of the Veteran population.17
Selecting the Veteran population projections for 2030 might be a useful “standard reference population” for comparing population health outcome rates pertaining to the Veteran population where direct standardization is used from the year 2018 until 2030. The advantage of this approach is that the VA has invested resources in these population projections8 so the VHA can utilize this work in important, long-term monitoring of Veteran population health outcome rates. It is likely that the VA will update their population projections in coming years. As 2030 approaches and Veteran population projections become available for 2050 or 2060, for example, future VHA leaders can decide to update the Veteran “standard reference population” for comparing population health outcomes beyond 2030 that can rely on the VA population projections at that future time.
LIMITATIONS
We relied on the population projection data from the VA; their description of the population projections models includes recognition of the strengths and limitations of the approach.8 The same might, also, be said of the population projections from the Census Bureau. These are just projections and we cannot know how the behavior of the individuals in the population will impact the population projections. This uncertainty is a part of the population data presented in this report.
CONCLUSION
Comparing health outcome and health service utilization rates within a health care system across populations or time periods are an essential component of health system planning, monitoring, and health program evaluation. Crude rates are usually reported for these outcome measures. However, using unadjusted crude rates for comparison over time in a population could lead to faulty conclusions in public sector reports.
Close inspection of population pyramids for the projected years showed that between 2015 and 2040, not only could the proportion of female Veterans increase over time but, also, more Veterans will be represented in the older age groups. The population composition based on age group and sex could have important implications for the comparison of population health outcome rates as health planners consider the long-term resources necessary to support acute health care and rehabilitation, health and wellness, community health, and Veteran reintegration into the community. Where Veteran population health outcome rates are intended to be monitored over a long period of time, it might make sense to use the Veteran population projections for 2030 as a “standard reference population” for the direct standardization of rates.
ACKNOWLEDGMENTS
I appreciate the support of my colleagues, especially Ms. Tamala Jones and Ms. Paula Edwards who provided useful editing support and Dr. Lisa Backus who provided general supervision.
AUTHOR CONTRIBUTIONS
Dr. Gregory Fant conceptualized and designed the project, acquired the data, analyzed and interpreted the data, drafted the article and revised it, provided final approval for the version to be submitted for publication, and is accountable for all aspects of the work in ensuring that questions related to the accuracy or integrity of any part of the work are appropriately investigated and resolved. This brief report is an expansion of a scientific poster presented at professional conference of the Association of Military Surgeons of the United States (AMSUS or The Society of Federal Health Professionals) in Washington, DC, November 2018. Earlier in the year, the author used the similar methods to examine population projections in a particular state in India for another public health purpose.
DISCLAIMER
The views expressed in this Brief Report are those of the author and do not represent the official position of the U.S. Government.
DISCLOSURE
The author reports no conflicts of interest in this work or financial disclosures to report.


