INTRODUCTION
Thin layer chromatography (TLC) has found wide applications for the separation and identification of both known and unknown substances in biological materials since the early 1960s.1 Some of the well-known advantages of TLC technique include its simplicity and easy operation, high sample throughput, easy sample preparation, low cost of analysis, versatile visual detection and its equal applicability to pure form of drugs, pharmaceutical formulations and illicit drug preparations.2,3 In the available literature, several authors have reviewed wide array of TLC applications ranging from toxicological drug screening, food and agriculture analysis, biological sample analysis, systematic toxicological analysis (STA) in clinical and forensic toxicology, to the analysis of purity of pharmaceuticals and analysis of pesticides.2,4-8 Quantitative TLC is carried out using high-performance TLC equipment costing thousands of dollars. An economic and more convenient alternative to this technique is capturing TLC plates images followed by their processing using commercially (e.g. Just TLC-Sweday, Sweden, TLSee -Alfatech, Italy) or freely (e.g. ImageJ, National Institute of Health (NIH), Bethesda, MD, USA) available software.9 This software converts the spots in TLC plates into peaks and then the relationship between the peak area and spot density (i.e., amount of analyte) can be determined easily.10,11,12 Quantitative analysis is also possible by analyzing the red, green, blue (RGB) values of TLC spots in Microsoft Paint program.13
Liquid-liquid extraction (LLE) is a widely used sample preparation and pre-concentration method for the analysis of various analytes by TLC. However, this popular extraction method suffers from few drawbacks such as: (i) Consumption of large volumes of toxic organic solvents, (ii) Time consuming, (iii) Involves multi-step procedure, (iv) Laborious, etc.14
To overcome the aforementioned drawbacks of LLE, Assadi and Co-workers developed an environmentally friendly, rapid, economical and easy to perform liquid-phase microextraction technique termed as dispersive liquid-liquid microextraction (DLLME), which offers high enrichment factors and extraction efficiency.15 DLLME is based on the ternary component solvent system in which an extraction solvent (generally heavier than water) is rapidly injected into an aqueous phase along with a disperser solvent (miscible in both the aqueous phase and the extraction solvent). These results in the formation of a cloudy solution which comprises of tiny droplets of extraction solvent dispersed throughout the aqueous phase. Upon centrifugation, the dense extraction solvent, thus obtained, settles down as the sedimented phase and is used for analysis.16
So far, DLLME has been coupled with various analytical instruments such as gas chromatography-mass spectrometry (GC-MS), high-performance liquid chromatography (HPLC), ultraviolet-visible spectroscopy, atomic absorption spectroscopy (AAS), etc., and has found widespread applications for the analysis of a variety of analytes in different matrices ranging from drugs of abuse, pesticides and metals to pharmaceutical formulations and food preservatives, etc.14,17-21 However, no report is available in the literature related to the coupling of DLLME with TLC.
Among all non-steroidal anti-inflammatory drug (NSAIDs), Aspirin or ASA is the most widely used drug to treat pain, fever and inflammation.22 However, due to the ease of the availability of aspirin at local drug stores, sometimes it may be used for suicidal purposes also.23 In such cases, the undissolved tablet or capsule may be discovered in the stomach contents of the victim. Analysis of these undissolved tablets or capsules allows for a simpler identification of the drug.24
In the present study, for the first time, the coupling of a rapid, economical and environmentally benign DLLME technique with TLC has been reported, which is one of the most popular and widely used separation techniques. The results will enable the researchers to perform an analysis of the drugs in a simple manner without the need of any sophisticated instrument. Successful application of the developed method has been demonstrated for the analysis of ASA in pharmaceutical formulations and urine.
EXPERIMENTAL DESIGN
Chemicals and Reagents
All the reagents used were of analytical grade unless otherwise stated. The reference material of ASA was obtained from Hi-Media Laboratories Pvt. Ltd. (India). Silica gel 60F-254 pre-coated TLC aluminum plates (20×20 cm, 0.25 mm layer thickness) were obtained from Merck (Darmstadt, Germany). Acetone (ACE), acetonitrile (ACN), methanol (MeOH) and ethanol (EtOH) which were used as disperser solvent and dichloromethane (DCM), chloroform (CF), trichloroethylene (TCE), chlorobenzene (CB), carbon tetrachloride (CCl4 ) which were used as extraction solvent were procured from Qualigens (Thermo Fisher Scientific, Mumbai, India). Hydrochloric acid (HCl), sodium hydroxide (NaOH) and sodium chloride (NaCl) were purchased from Hi-Media Laboratories Pvt. Ltd. (India). The stock solution of ASA was prepared in ACN at a concentration of 10 mg/ml and stored at 4 °C. Working standard solutions were prepared daily by diluting the stock solution. Three different brands of commercially available tablets of aspirin were procured from the local market and classified as class 1, 2 and 3 for this study.
Ultrasound Assisted-Dispersive Liquid-liquid Microextraction (US-DLLME) Procedure
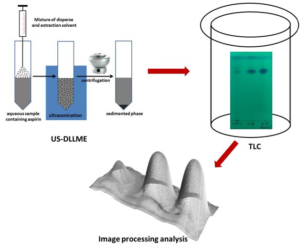
Ten tablets were weighed and the average weight determined prior to crushing the tablets into a fine powder. These fine powdered contents equivalent to the weight of one tablet was transferred into a volumetric flask and dissolved in ACN to prepare a solution with a final concentration of 10 mg/ml. This solution was then sonicated for 10 min followed by centrifugation. The supernatant solution was used for spiking ultrapure water in the working concentration range. A mixture of CF (extraction solvent, 100 µl) and ACN (disperser solvent, 800 µl) was rapidly injected into 5 ml of the aqueous sample followed by ultrasonication for 3 min. Following the step of injection and ultrasonication, a cloudy solution was observed which comprised of tiny droplets of CF dispersed throughout the aqueous phase. This mixture was then subjected to centrifugation at 3000 rpm for 5 min. The resultant supernatant was discarded and 10 µl of the sedimented phase (CF) was subjected to TLC analysis. Schematic representation of US-DLLME-TLC-Image processing method is shown in Figure 1.
Figure 1: Schematic Representation of US-DLLME-TLC-Image Processing Method.
An appropriate amount of ASA was spiked in the drug free urine sample collected from a 30 year old healthy volunteer. The urine sample was initially centrifuged and the supernatant was diluted with ultrapure water (1:1 v/v). Five ml of this urine sample was subjected to the above mentioned US-DLLMETLC-Image processing procedure.
Thin Layer Chromatography (TLC) Procedure
TLC analysis of the sedimented phase obtained from USDLLME was performed using 20×20 cm pre-coated silica gel 60 F-254 aluminum backed TLC plates (Merck, Darmstadt, Germany). 10 µl of the sample (2×5 µl) was applied to the marked start edge of the TLC plate of 1 cm height using a micropipette of 2-20 µl capacity. The plate was developed till not less than 7 cm of the migration distance of the solvent front from the starting point in a chamber which was pre-saturated with the solvent vapors of the mobile phase consisting of n-hexane: Ethyl acetate: Acetic acid (65:30:5 v/v/v) in ascending mode. The plate was then allowed to air dry for 10 min and kept in the development tank. Mobile phase was prepared daily in a volume adequate to supply the development chamber. The hRf value of ASA was found to be 71.4.
Image Processing Methodology
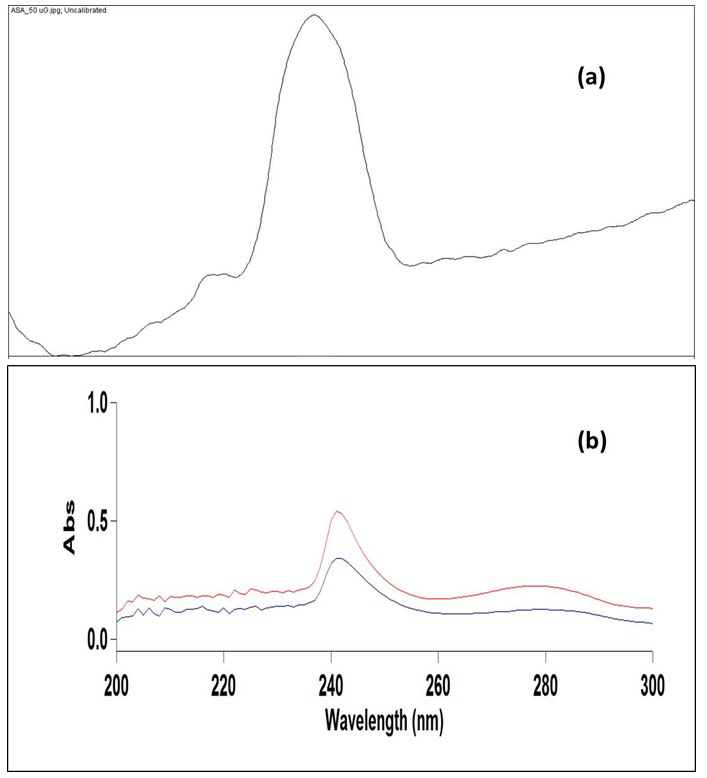
The developed TLC plates were then photographed using digital camera under ultraviolet light of wavelength 254 nm in a UV cabinet. The image taken from a smart phone camera was saved in the JPEG format, cropped into a desired size and opened with ImageJ, a free and open source image processing program (Wayne Rasband, National Institute of Health, MD, USA; https:// imagej.nih.gov/ij/). The image was then split into the red, blue and green channel (Image>Color>Split Channel) and the green channel was used for further processing since it offered the best results. A median filter with a resolution of 5-10 pixel was applied to this image for noise removal (process>filter>median). Furthermore, the rectangular selection tool was used to select equal height and width of spots on the image of the TLC plate and ‘select first lane/next lane’ tool was applied to designate the lanes (Analyze>Gels>Select first lane). This was followed by the application of a plot lane tool to generate the line profile plots. ‘Line tool’ was then used to draw a straight line at the bottom of each peak in order to enclose the area under the peak. The peak area under the individual peak was then obtained by clicking inside the peak with the ‘magic wand tool’. The TLC densitogram of ASA is shown in Figure 2.
Figure 2: (a) TLC Densitogram of ASA at a Concentration of 250 µg/spot Obtained after Image Processing through ImageJ (b) UV Absorption Spectra of ASA in Standard Sample (Blue Line) and in Commercial Aspirin Tablet (Red Line).
UV-Visible Spectrophotometric Analysis
Agilent Cary Win UV-Visible Spectrophotometer with 1 cm quartz cells was used for recording the spectra. After USDLLME, the CF extract was diluted up to 1 ml and subjected to UV-Visible spectrophotometric analysis. A blank solution of CF was used for all the spectra measurements. The standard solution of ASA was scanned between 200 to 300 nm and maximum bsorbance was obtained at 276 nm.
RESULTS AND DISCUSSION
In resource limited countries, TLC is still a widely used analytical method for product quality assessment of pharmaceutical drugs. Although, planar chromatography does not have a separation power at par with column chromatography such as high performance liquid chromatography (HPLC) and gas chromatography (GC), however, it is still applicable for the analysis of finished pharmaceutical products which have lesser active ingredients.25 Herein, an alternative analytical platform for the determination of ASA based on the use of DLLME combined with TLC-image processing method is presented.
In order to get an optimum extraction efficiency of the DLLME procedure, parameters affecting its extraction yield such as type and volume of extraction solvent, type and volume of disperser solvent, pH of the sample solution, ionic strength and sonication time, have been thoroughly studied and optimized using one-variable-at-a-time (OVAT) approach. All experiments were performed in triplicates.
Selection of Extraction Solvent and its Volume
Classically, extraction solvent has higher density than aqueous phase which facilitates its sedimentation following centrifugation. In the present study, various organic solvents having higher density (d) than water such as TCE (d=1.46), CF (d=1.48), DCM (d=1.33), CB (d=1.11) and CCl4 (d=1.59) were screened as extraction solvents for ASA. A series of experiments were performed by taking a constant volume of ACE (disperser solvent, 500 µl) along with the extraction solvent (200 µl) at ASA concentrations of 10 µg/ml. As evident from Figure 3a, CF has the highest extraction efficiency for ASA followed by DCM and TCE.
Figure 3: Optimization of DLLME Parameters; (a) Selection of Extraction Solvent, (b) Optimization of Volume of CF, (c) Selection of
Disperser Solvent, (d) Optimization of Volume of ACN.
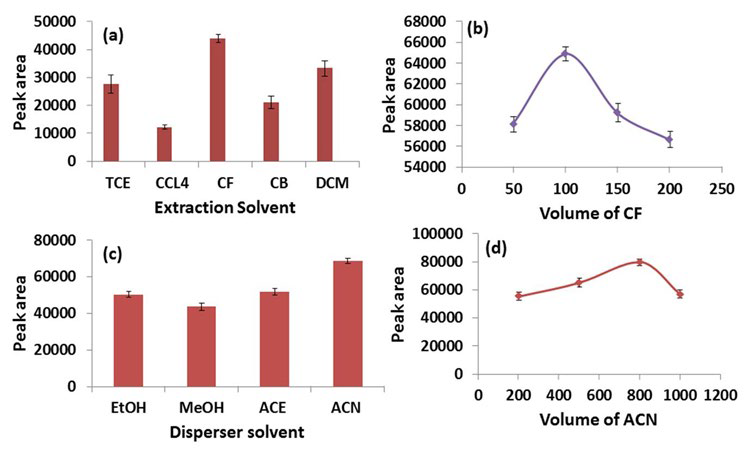
In the further experiments, volume of CF was optimized in the range of 50-200 µl. It is clear from Figure 3b, that the peak area of ASA increases from 50 to 100 µl but tends to decrease further due to an increasing dilution of the analyte in the extraction solvent. Hence, 100 µl of CF was used as the extraction solvent for further experiments.
Selection of Disperser Solvent and its Volume
Disperser solvent, being miscible in both extraction solvent and aqueous phase, facilitates the dispersion of extraction solvent throughout the aqueous phase, thus, achieving a rapid equilibrium. Four widely used disperser solvents viz. ACE, ACN, MeOH and EtOH were screened in this study.26-28 Experiments were performed taking 500 µl of each disperser solvent with 100 µl of CF. Figure 3c clearly shows that ACN has the highest peak area followed by ACE, EtOH and MeOH. Therefore, ACN was selected as the optimum disperser solvent.
The volume of ACN was then optimized in the range of 200-1000 µl (i.e., 200, 400, 600, 800 and 1000 µl). As the volume of ACN increases from 200 to 800 µl, the peak area of ASA also increases, however a further increase from this point results in a decreased peak area of ASA. This can be explained by the fact that at lower volumes, ACN does not disperse CF in the aqueous phase completely, and at higher volumes, the solubility of ASA increases in the aqueous phase, which results in a declining peak area (Figure 3d).29 Therefore, 800 µl of ACN and 100 µl of CF were used as disperser and extraction solvents, respectively for further studies.
Effect of Ultrasonication Time
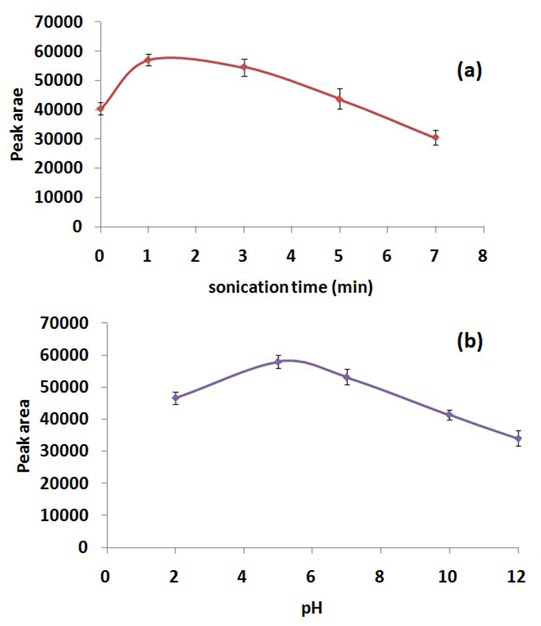
To evaluate the effect of ultrasonication time on extraction efficiency of DLLME, a set of experiments were conducted for screening the ultrasonication time in the range of 0-5 min (i.e., 0, 1, 3, 5 and 7 min). Ultrasonication facilitates the emulsification of extraction solvent in the aqueous phase and subsequently mass transfer of the analyte from the aqueous phase to the extraction solvent. Extraction efficiency of DLLME was found to be the highest at 1 min of ultrasonication and showed a declining trend beyond this point (Figure 4a). This can be explained by the fact that, as sonication time increases, the local temperature of the solution also increases due to a large number of compression and rarefaction cycles, which results in a decrease in the peak area of ASA.30 Therefore, an ultrasonication time of 1 min was selected in order to get an optimum extraction efficiency of DLLME for ASA.
Figure 4: Effect of (a) Sonication Time and (b) pH on Extraction Efficiency of DLLME.
Effect of pH and Ionic Strength
The pH of aqueous phase (sample solution) plays an important role in the extraction efficiency of DLLME, since at optimum pH, the analyte can be extracted in its non-ionized form. In order to investigate the pH effect, samples were prepared in the pH range of 2-12. As is evident from Figure 4b, the maximum peak area of ASA (pKa=3.5) was obtained at slightly acidic conditions wherein ASA behaves as a weak acid. Therefore, an extraction pH of 5 was chosen as the optimized value.
Following pH, the ionic strength of the aqueous phase was optimized by adding NaCl in the range of 0-10%. Generally, an increasing amount of salt in the aqueous phase decreases the solubility of the analyte in the sample solution and facilitates the mass transfer of the analyte in the extraction solvent. However, the recorded results revealed that the peak area of ASA decreases with an increasing amount of salt (data not shown). This can be explained by the fact that an increasing amount of salt enhances the viscosity and the density of the aqueous phase. This can lead to the generation of heat due to absorption of ultrasonic energy when the sample is subjected to ultrasonication.31 Therefore; no salt was added in the sample solution for DLLME procedure.
Method Validation Parameters
The developed method has been thoroughly validated for its linearity, precision, recovery, limit of detection (LOD) and limit of quantification (LOQ) in spiked water samples. Under optimized conditions, the method was found to be linear in the range of 1-250 µg/spot with a square of correlation coefficient (R2 ) of 0.999. LOD and LOQ were found to be 0.1 and 0.35 µg/spot with a signal to noise ratio of 3 and 10, respectively. Intra-day and inter-day precision of the method were expressed as percent relative standard deviation (%RSD) and were studied at three different concentration levels of the calibration graph (i.e., 1, 25 and 250 µg/spot). Recovery assay of ASA in pharmaceutical formulations and urine were performed by the standard addition method at 1, 25 and 250 µg/spot and were found to be 90- 99% and 84-92%, respectively with an RSD in the range of 1.69-5.61%, respectively (Table 1). Intra and inter-day precisions were found to be in the range of 2.64-9.67% and 3.64- 11.43% for pharmaceutical formulations and urine, respectively (Table 2). The ASA content of the tablet was quantified at three different concentration levels (n=5) of the calibration graph (i.e. 1, 25 and 250 µg/spot) and the results were shown in Table 3. UV-Visible spectrophotometric analysis of pharmaceutical tablets after US-DLLME was also performed in the concentration range corresponding to 1-250 µg/spot. However, the final extract obtained was diluted to bring the concentration within the working range of the UV-Visible spectrophotometer (Table 3).
| Table 1: Recovery Assay of ASA in Pharmaceutical Formulation and Urine (µg/spot, n=3). |
|
Total concentration
|
Amount taken |
Amount added |
Amount found |
Recovery (% RSD) |
| Tablet |
Urine |
Tablet |
Urine |
Tablet |
Urine |
Tablet |
Urine
|
|
1
|
0.5 |
– |
0.5 |
1 |
0.9 |
0.84 |
90 (3.78) |
84 (5.61)
|
|
25
|
12.5 |
– |
12.5 |
25 |
23.5 |
22.2 |
94 (2.84) |
89 (4.17)
|
|
250
|
125 |
– |
125 |
250 |
247.5 |
230 |
99 (1.69) |
92 (3.45) |
| Table 2: Intra and Inter Day Precision of US-DLLME-TLC Image Processing Method for Analysis of ASA in Urine and Pharmaceutical Formulation (n=3). |
|
Concentration (µg/spot)
|
Tablet |
Urine |
| Intra-Day |
Inter-day |
Intra-day |
Inter-day
|
|
1
|
4.75 |
9.67 |
5.46 |
11.43
|
|
25
|
3.81 |
8.28 |
4.39 |
8.19
|
|
250
|
2.64 |
6.78 |
3.64 |
6.46
|
| Table 3: Analysis of ASA in Commercially Available Pharmaceutical Formulations of Different doses by US-DLLME-TLC Image Processing and US-DLLME-UV-Visible Spectrophotometric Method. |
|
Tablet (Label Claim)
|
US-DLLME-TLC-Image Processing |
US-DLLME-UV-Visible Spectrophotometry
|
|
Class 1 (350 mg)
|
349.0 (3.21) |
349.2 (2.89) |
| Class 2 (75 mg) |
74.2 (3.58) |
74.6 (3.54)
|
|
Class 3 (75 mg)
|
74.5 (3.94) |
74.4 (3.12)
|
| *% RSD is mentioned in parenthesis |
CONCLUSION
TLC is still a widely used separation and identification technique in analytical laboratories. Modern image processing techniques have helped in overcoming the drawback of TLC of being a qualitative analytical technique only. DLLME is an environmentally benign, rapid and cost-effective modern microextraction technique which consumes only microliters of the extraction solvent. For the first time, coupling of US-DLLME with TLC-image processing analysis have been proposed and successful application is demonstrated for the analysis of ASA in pharmaceutical formulations. The method can be used routinely to check the purity of the drug as well as in forensic toxicological laboratories for the analysis of ASA in tablets and capsules in drug overdose cases. The proposed method will pave the path for analytical chemists to develop cost-effective and eco-friendly analytical methods for a variety of analytes such as pesticides, drugs of abuse, pharmaceutical formulations etc. which will be useful for the resource limited laboratories. However, more efforts are needed to enhance the sensitivity of the TLC-image processing methodology for the trace level analysis of target analytes in biological matrices.
ACKNOWLEDGEMENTS
The authors are grateful to the Coordinator, Central Forensic Science Laboratory, Guwahati and the Chief Forensic Scientist, Directorate of Forensic Science Services, Ministry of Home Affairs, Government of India, for providing the necessary infrastructure and facility to carry out this project. RS gratefully acknowledges the financial support from UGC grant no. F.30- 97/2015 (BSR).
CONFLICTS OF INTEREST
The authors declare that they have no conflicts of interest.


