INTRODUCTION
Microcystins are a large group of cyclic peptides produced by several groups of cyanobacteria (blue-green algae). These include Microcystis, Planktothrix and Anabaena,1 Oscillatoria,1,2 Radiocystis,3 Anabaenopsis and Cylindrospermopsis,1,4 Aphanothece,5 Aphanocapsa,6 Arthrospira,7 Synechocystis,8 and Scytonema.9 Conditions that favour the growth of cyanobacteria are stable water column, warm water, high nutrient (phosphorus, nitrogen) concentrations and organic compounds such as humus and domestic waste, low concentration of nitrogen relative to phosphorus (N/P ratio) and high pH among others.1,10
Cyanobacteria, once established may alter epilimnetic conditions such as elevated pH due to carbon di-oxide depletion, which reduce the availability of photosynthetically active radiation (PAR) to favour their own growth.11 Bloom forming cyanobacteria such as Microcystis, Anabaena and Aphanizomenon are the common genera known to be capable of producing toxins.1 In addition, they have adverse effects on water quality which include foul odours and fish kills due to oxygen depletion and ammonia release as the cyanobacteria decay.12 The most hazardous consequence of cyanobacterial blooms is the production of potent toxins such as microcystins (liver toxins) and neurotoxins (nervous system).12,13 Neurotoxins disrupt the normal propagation of neural impulses to muscles, thereby, causing paralysis and death through asphyxiation in animals.14 Microcystins, the most widely studied and the focus of this paper, inhibit the synthesis of protein phosphatises 1 and 2A and are potent liver tumour initiators and promoters.15 Microcystins are responsible for causing poisoning of the domestic livestock such as cattle, pigs, sheep, wildlife and humans worldwide.12 Although, the primary target of microcystin poisoning is the liver, other organs such as the gastrointestinal tract and kidneys may be affected. Common human reactions associated with cyanobacteria poisoning are skin rash, fever and nausea.16
The risks to humans, associated with the intake of microcystins in drinking water was reported.17,18 In China, the incidence of high primary liver cancer among the populace was attributed to increased microcystin concentration in the drinking water.17 Zhou et al19 also reported that human colorectal cancer rates were positively correlated with the microcystin concentrations in drinking water supplies in China. These studies demonstrate clearly the adverse effects of microcystin uptake through drinking water to human health and should be well monitored during the treatment of drinking water.
Addico et al20 reported for the first time, the presence of microcystin in the intake of the Weija water treatment plant when they studied the cyanobacteria population associated with the Weija and Kpong Reservoirs in Ghana with respect to drinking water quality and microcystin. Six different microcystin variants were identified at the intake of the Weija water treatment plant. Addico et al20 also studied the cyanobacterial diversity and biomass in relation to the nutrient regime of four freshwater reservoirs (Weija, Kpong, Barekese and Owabi) sourced for the production of drinking water in Ghana and concluded that cyanobacteria was the dominant phytoplankton in all the four reservoirs mentioned above.
Unfortunately, microcystin monitoring is not a quality criterion in most developing countries including Ghana. The World Health Organization (WHO) has standardized a guideline value for microcystin concentration ensuring human safety as 1 µg/L.21 This project was set up to evaluate the quality of drinking water in the Kwanyarko and Brimsu drinking water treatment plants in the Central Region of Ghana with respect to the presence of microcystin and their levels in the water so as to safe guard human health.
MATERIALS AND METHODS
Study Area
Kakum (Brimsu Reservoir)
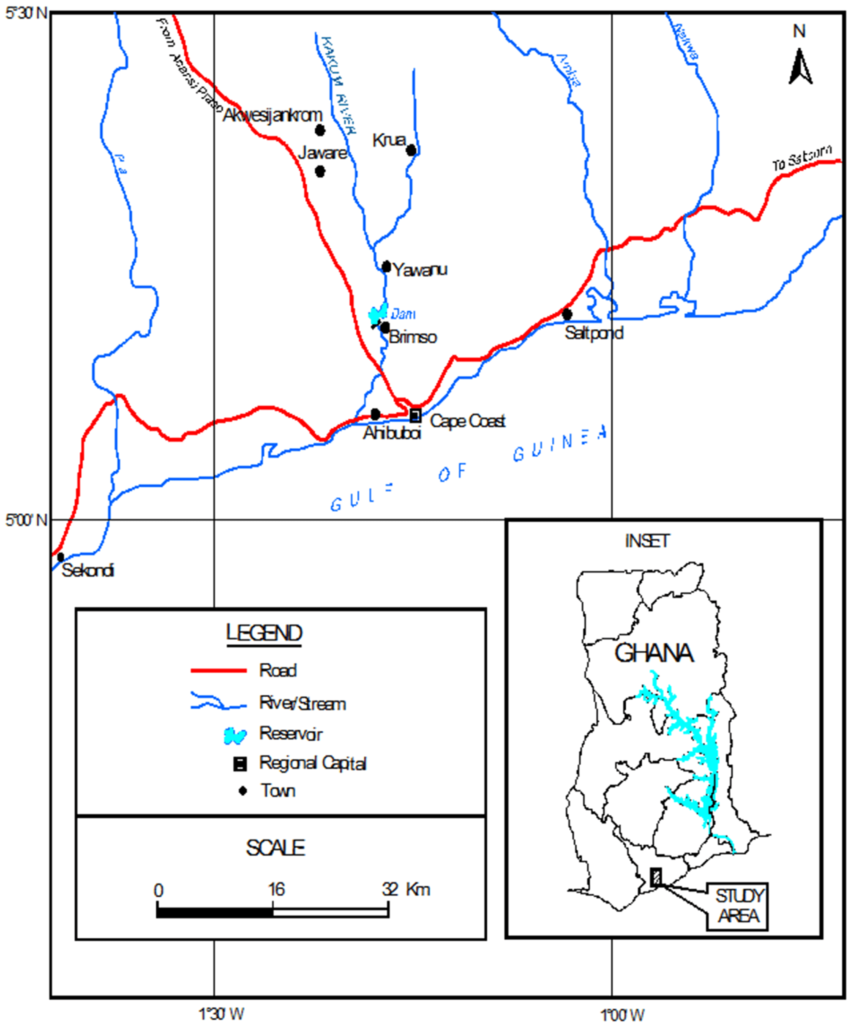
The Brimsu Reservoir is located on the Kakum River and lies on latitude 05o11’.714 N and longitude 01o17’.688 W (Figure 1) and the head waters are at the Kakum National Park and flows directly into the sea at Iture near Elmina. Rainfall is bimodal. The major season is between May to June and the minor season is between September to October. The climate of the study area is wet semi-equatorial with an annual rainfall of between 1250 and 2000 mm.22,23 The natural vegetation of the study area is the moist semi-deciduous forest. However, human activities within the catchment area such as deforestation, shifting cultivation and bush burning have degraded the vegetation. The soil is porous, well drained, and loamy. The reservoir has an elevation of 150 to 300 m above sea level.23 Agriculture is the main land use activity within the catchment area. Crops cultivated are cassava, maize, oil palm, citrus and plantain. Other purpose of the land use includes human settlements, transportation, timber harvesting, mining and quarrying.
Figure 1: Map of the Catchment of Kakum River Showing the Brimsu Reservoir.
Kwanyarko Reservoir
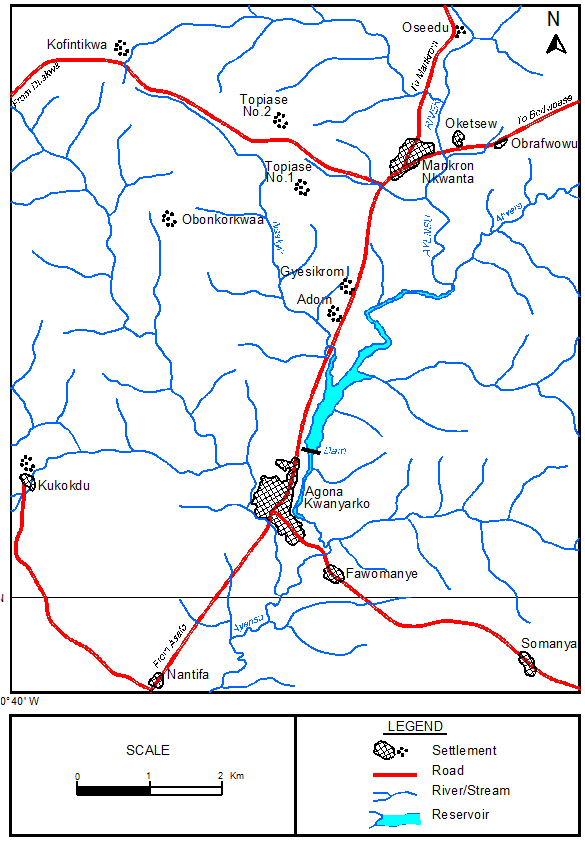
The Kwanyarko Reservoir commissioned in 1965 is located in the Agona District on the Ayensu River. The Kwanyarko Reservoir lies at latitude 5o 20’ N and longitude 0o 30 W (Figure 2). The Ayensu River which is one of the rivers of the coastal rivers basin originates from the Atiwa range of hills in the Akim Abuakwa District.24 It drains into the Gulf of Guinea at about 16 Km East of Winneba through the Oyibi Lagoon. Its main tributaries are Abukyen and Akora. The River Ayensu basin falls within two ecological zones, the Northern zone which is covered with the moist semi-deciduous forest and the Southern zone covered by the South-East coastal savanna consisting of coastal scrubs or thickets and grasslands with short strips of strands and mangroves. The two climatic regions have two rainfall maxima The wet semi-equatorial type has mean annual rainfall between 1200 mm and 2000 mm, while the dry equatorial region has mean annual rainfall less than 900 mm. Rainfall occurs within two phases in the basin, with the first phase occurring between March to July and the second phase in October. The Basin is underlain by rocks of the middle Precambrian age.24 Human activities undertaken within the basin mostly includes agriculture and human settlement.
Figure 2: Map of the Catchment of Ayensu River Showing the Kwanyaku Reservoir.
Sampling and Preparation of Samples
Samples for microcystin analyses were collected from the Brimsu and Kwanyarko Reservoirs. The Kwanyarko Reservoir supplies drinking water to about ten communities including Swedru, Agona Nyakrom and Budumburam, while the Brimsu Reservoir serves about 6 towns including Salt pond, Elmina and Abura Dunkwa all in the Central Region.
Water samples (1 litre) were collected at each stage of treatment ( i.e., Intake, Flocculation, Sedimentation, Filtration and Chlorination) into clean plastic bottles. Five samples were collected from each reservoir during every visit (March and September). One set of samples were collected for phytoplankton analysis and another set for toxicological analyses. The samples were stored in a cooling bag on ice and transported to the laboratory.
A total of 40 samples were collected for toxicological analyses from the two reservoirs, covering a period of two years (January 2010 to December 2010). In the laboratory, the 1 litre samples were filtered through a Watman Glass Fiber filter (GF/C) of pore size 0.45 µm. The filters with the cells were carefully folded into two with the upper surface of the innermost filter, placed in a suitable container, frozen overnight and dried in an oven at 45 oC for 8 hrs. The dried filters were kept at -20 oC until needed.
Extraction of Intracellular Microcystin
Filter discs containing dried cells were placed in glass bottles containing 20 ml of 80% acidified methanol (0.1 % TFA, Fisons, Loughborough, Leicestershire, UK) and was subjected to extraction for 1 hr at room temperature with intermittent shaking using Fisons whirly mixer as described by Lawton et al.25 A total number of 40 samples were extracted. The extraction procedure was repeated thrice and extracts pooled together and centrifuged using AFC refrigerated centrifuge at 3000 rpm for 20 min. The clear supernatant was decanted into a pear shaped flask (50 ml) and dried using a Buchi evaporator R-200 at 45 oC. The residue was resuspended in 2×250 µl of methanol prior to analysis by high pressure liquid chromatography (HPLC)/photodiode array detector (PDA).
Detection Limits and Calibration Curve
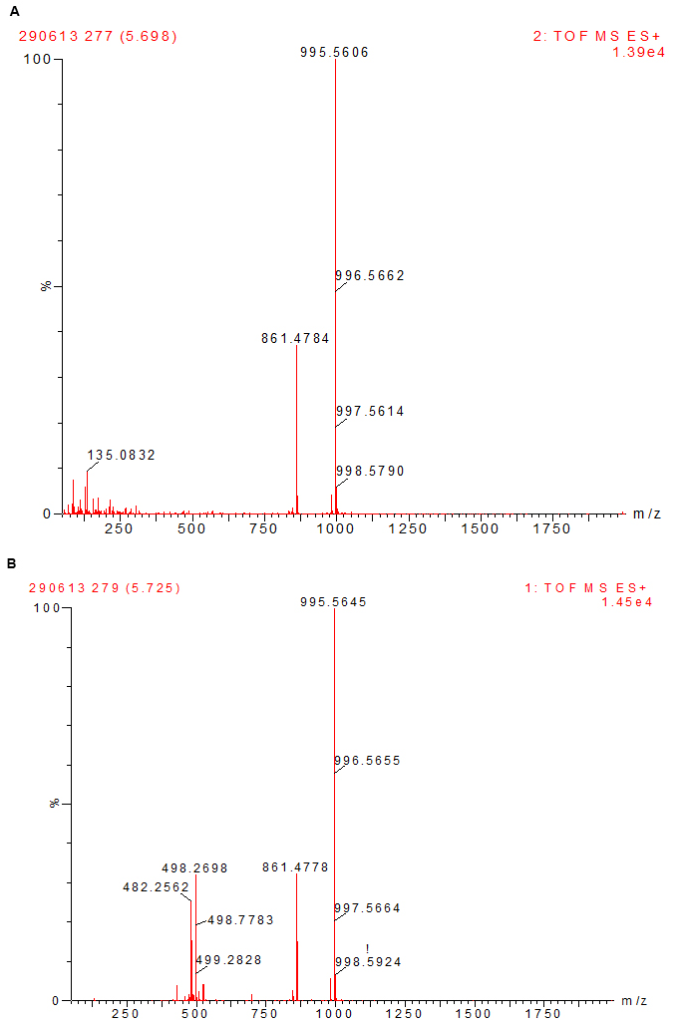
All chemicals and solvents used were of analytical grades. Microcystin-LR, MC-RR, MC-YR, MC-LW, MC-LY and nodularin (Alexis Corporation, Lausen, Switzerland) were stored at -20 oC until required. Methanol was purchased from Ruth burn (Walkerburn, Peeblesshire, UK). HPLC calibration of the six different microcystins (MC-LW, -YR, LR, LY and -RR) and nodularin standards of 100 µg each were dissolved in methanol to constitute the calibration solution. Injections of 100 µl in triplicate were used for the calibration curve. The calibration curves for the experiment were obtained over a range of six concentrations from 100 µg/ml to 0.001 µg/ml (Table 1). Analysis of standards was done using a Waters Acquity UPLC/MS with photodiode array detector. Microcystins were identified by their UV spectra at 238 nm and chromatograms extracted by their respective mass. Calibration curves were obtained by plotting area of absorbance (UV/Vis) against the concentration of standard (µg/ml). A coefficient of linearity (r2) of about 1 was obtained (Figure 3). Figures 4a and 4b show a spectrum of MC-LR standard extracted at a molecular weight of 996 nm used for the analysis at low and high energy.
| Table 1: Correlation Coefficients (r2) of Microcystins and Nodularin Standards Used for the Detection of Microcystin in Water Samples from Ghana |
| Standards |
Correlation coefficients (r2) |
| MC-LR |
1.000 |
| MC-YR |
0.999 |
| MC-RR |
0.997 |
| MC-LW |
0.993 |
| MC-LY |
0.991 |
| Nodularin |
0.999 |
Figure 3: Calibration Curves of Microcystins and Nodularin Standards used for Detection of Microcystins in Water Samples from Ghana Showing Linearity of the Method.
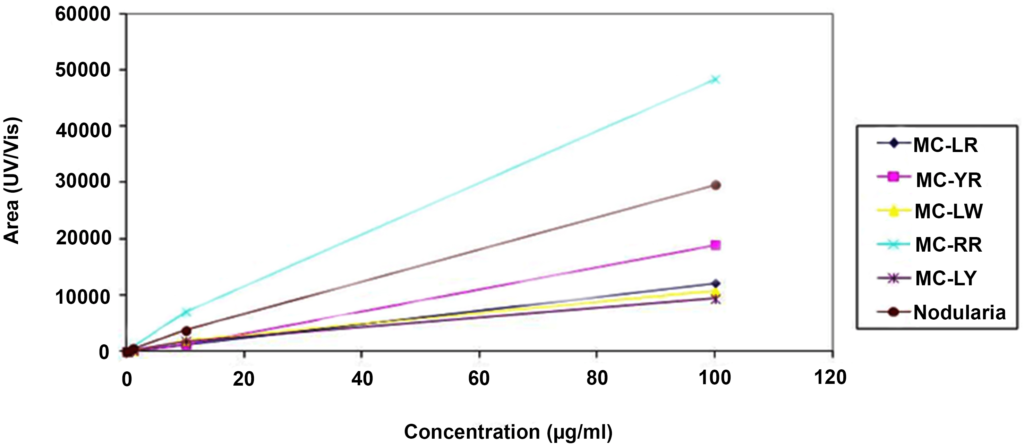
Figure 4: A Spectrum of MC-LR Standard Extracted at a Molecular Weight of 996 nm used for the Analysis at Low (top) and High (below) Energy.
Microcystin and Nodularin Analysis Using UPLC/MS
Analyses of microcystins were performed at the Ecotoxicity Laboratory of the Faculty of Pharmacy and Life Sciences of the Robert Gordon University at Aberdeen, Scotland. This was based on the previously described method by Lawton et al.25
Identification and Analysis of Phytoplankton
The samples of phytoplankton were collected twice a year (March and October) in 2010 and 2011. Samples were collected using a 6 litre Van Dorn water sampler. This was emptied into a clean bucket, sub-sampled into 125 ml plastic bottles, preserved with Lugol’s solution and kept on ice in an ice chest for analysis in the laboratory. In the laboratory 10 ml to 25 ml aliquots of samples were transferred into counting chambers as described by Falconer.16 Sedimentation was carried out in counting chambers with a settling time of 4 h for every 1 cm of water column of the sample.26 Identification and counts were done using a Carl Zeiss inverted microscope. All colonies and filaments were counted as individuals, the average number of cells determined for 20 individuals and cell concentration calculated. In order not to contaminate the samples, counting chambers were cleaned with detergent, rinsed with distilled water after each sample analysis and the cover slides were also changed. Identification was carried out as described by Cronberg and Annadotter.27
RESULTS AND DISCUSSION
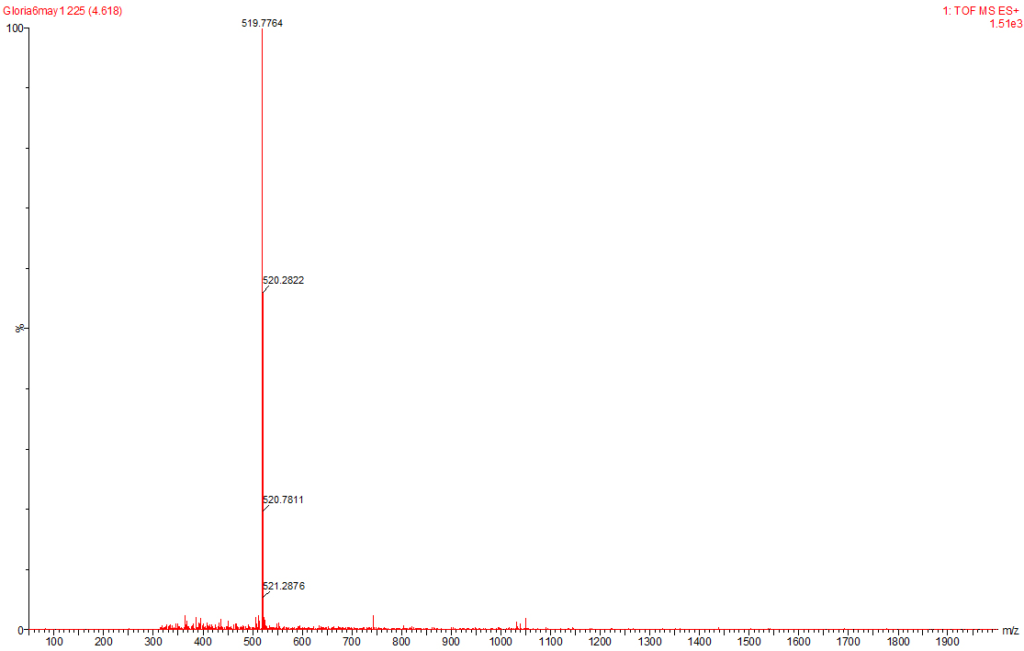
Microcystins are a large group of toxic peptides with different hydrophobicity that can be readily and easily separated by reverse-phase HPLC. Microcystins have maximum absorption spectra at 238 nm, exhibited by all microcystins except those that contain tryptophan which has maximum absorption spectra at 222 nm.25 These characteristics described were used to analyse water samples collected from Ghana. The linearity of the analytical method was achieved for all the standards used (Table 1, Figure 3), with linear coefficients (r2) between 0.991 to 1 for MC-LY and MC-LR respectively. The results of analyses of intracellular samples from Ghana during March 2010 (dry season) showed the identification of four different microcystins, MC-LR, MC-YR, MC-LA and MC-RR (Figures 5, 6, 7 and 8). Microcystin LA is a variant identified for the first time in Ghana. All these four microcystin variants were present at the intake of the Brimsu Reservoir. Only one type of microcystin (MC-LR) was identified at the intake of the Kwanyarko Reservoir. All four microcystins identified in this study are very toxic with microcystin-LR and YR being implicated as a cause of death for 76 dialysis patients in Caruara, Brazil. These toxins were found to be present in the patients’ livers and blood samples.28 All the other three sets of samples which were analysed were below the detection limit of 0.01 µg/L.
Figure 5: MC-LR Identified at the Raw Water Intake of the Brimsu Reservoir Treatment Plant extracted at a Molecular Weight of 996 nm with a Retention Time of 5.7 min.
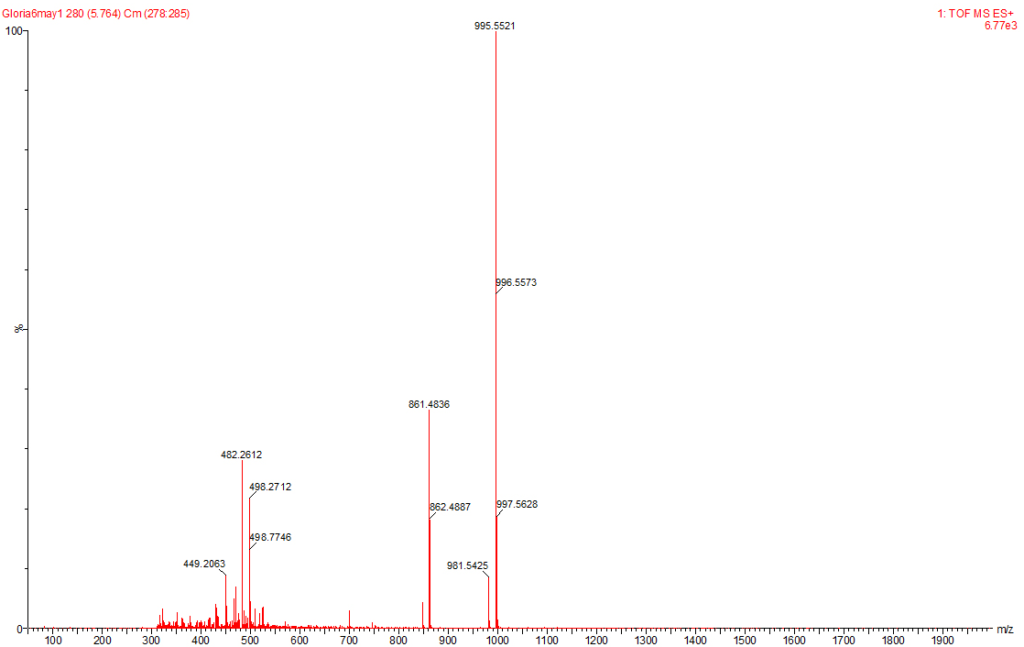
Figure 6: MC-YR Identified at the Raw Water Intake of the Brimsu Reservoir Treatment Plant Extracted at a Molecular Weight of 1045 nm with a Retention Time of 5.6 min.

Figure 7: MC-LA Identified at the Raw Water Intake of the Brimsu Reservoir Treatment Plant Extracted at a Molecular Weight of 910 nm with a Retention Time of 7.9 min.
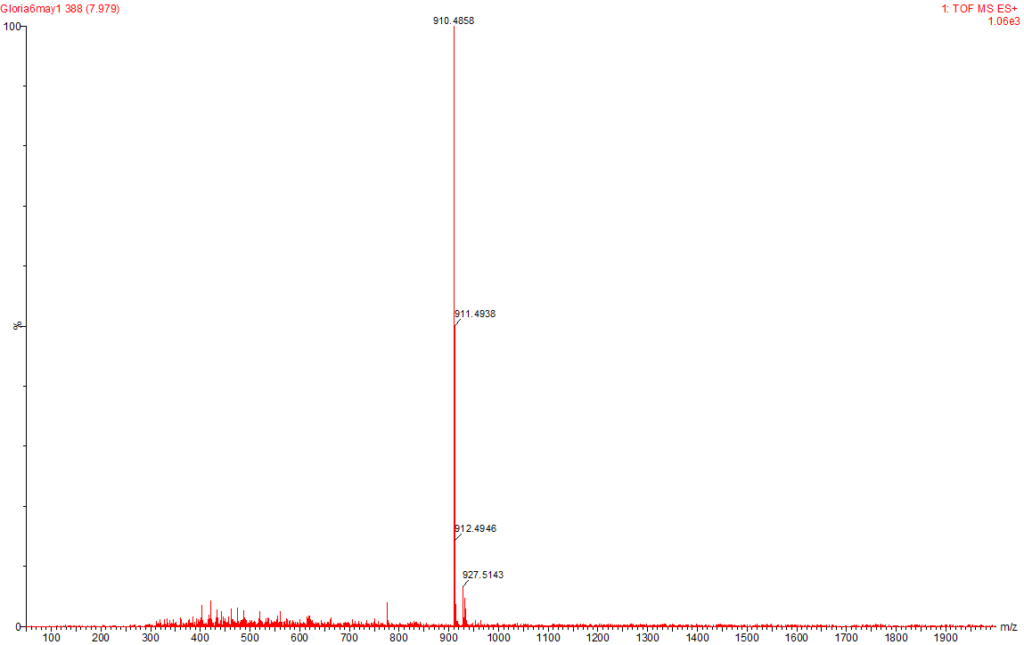
Figure 8: MC-RR Identified at the Raw Water Intake of the Brimsu Reservoir Treatment Plant Extracted at a Molecular Weight of 520 nm with a Retention Time of 4.6 min
Quantification of four microcystins variants yielded a total intracellular microcystin concentration of 0.79 µg/L at the intake of the Brimsu Reservoir (Table 2), which was below the WHO safety guideline value of 1 µg/L (WHO, 2004, WHO, 2016). The Italian Government has instituted a law setting 0.84 µg/L total microcystin as the tolerable limit in freshwater to prevent possible intoxication.29 Addico et al30 have earlier recorded a total intracellular microcystin concentration of 3.21 µg/L at the intake of the Weija Reservoir. This value is much higher than the 0.79 µg/L obtained at the Brimsu Reservoir. However, the risk of human exposure to microcystin through drinking water is still relevant due to the tumour promoting activity of microcystin at very low concentrations. Microcystin as a toxin or cyanobacteria are not considered significant as a water quality criterion in Ghana. It must be noted that over 40% of the Ghanaian population has no access to pipe-borne water and raw water is their sole source of drinking water.
| Table 2: Concentration of Microcystin and Microcystin Type Detected in the Reservoirs. |
| Reservoirs/Stage of Treatment |
Microcystin Concentration (µg) /Date of Sampling |
| Brimsu Reservoir |
March 2010 |
| Raw Water (Intake) |
MC-YR (0.29 µg)
MC-LR (0.50 µg)
MC-AR (< LOQ)
MC-RR (< LOQ)
Total Microcystin (0.79 µg/l) |
| Flocculated water |
MC-LR (0.14 µg) |
| Settled water |
Lost Sample |
| Filtered water |
MC-LR (0.13 µg) |
| Final Water |
MC-LR (0.105 µg) |
| Kwayaku Reservoir |
|
| Raw water |
MC-LR (0.09 µg) |
| Flocculated water |
Lost Sample |
| Settled water |
MC-LR (0.17 µg) |
| Final water |
MC-LR (0.10 µg) |
The results of our study show a decreasing concentration of intracellular microcystin as water treatment progresses down the treatment chain from the intake to the final drinking water product, with the concentrations of the final drinking water product of both the Brimsu and the Kwanyarko Reservoirs having concentrations of 0.10 µg/L (Table 2, Figure 9). This reduction in microcystin concentrations during treatment is expected due to the process of flocculation, sedimentation and filtration which reduces the algal cell biomass in the water and hence decreases the intracellular microcystin level. The effect of water purification by Coagulation/flocculation process causing cyanobacterial removal has been reported by Falconer.16
Figure 9: Changes in Microcystin Concentration During Drinking Water Treatment in the Brimsu and Kwanyaku Reservoirs. Samples from Settled Water and Flocculated Water from Brimsu Reservoir and Kwanyaku Reservoir Respectively were Lost not Zero.
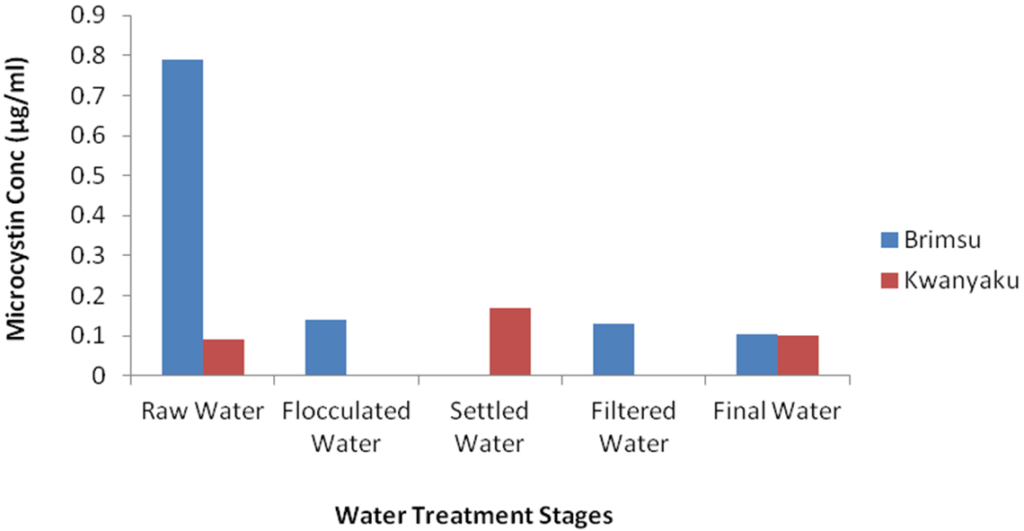
In this study, intracellular microcystin reduced from 0.79 µg/L at the point of intake to 0.10 µg/L in the final drinking water of the Brimsu Reservoir. This indicates a total elimination of over 68% concentration of microcystin. It also implies that the treatment process employed in Brimsu Reservoir is more efficient in mediating the removal of cells than that of the Kwanyarko Reservoir. Unfortunately, with the studies conducted on the Weija and Kpong Reservoirs only intake samples were analysed making it impossible to determine the microcystin elimination efficiency in these two reservoirs.20
Indications are that exposure to low concentrations of microcystin in drinking water can cause chronic effects in mammals due to their potent tumour promoting activity.15,16 An example has been observed in Southern China, where the incidence of primary liver cancer was reported to be very high among the populace and this was correlated with the use of water from ditches and ponds as drinking water,31,32 together with other potent liver carcinogens such as aflatoxin B1 in food and hepatitis B virus.33 Quantification of microcystins in these water supplies showed relatively low concentrations at about 0.46 µg/L17 and suggested that people living in that region may have ingested 0.19 pg (0.0019 µg) of microcystin per day during the four summer months over 40-50 years of their life span. The value of 0.10 µg/L in the final drinking water product of the Brimsu and Kwanyarko treatment plants is much higher than the value found in the drinking water of Southern China that was associated with the high incidence of liver cancer among the population. Again, in Finland, an outbreak of gastroenteritis was associated with a mass development of microcystin-producing Planktothrix agardhii in the raw water supply.28 A microcystin concentration of 0.1-0.5 µg/L and filaments of Planktothrix was detected in the drinking water associated with the outbreak.28 Planktothrix agardhii together with Anabaena flos-aquae, Microcystis aeruginosa and Pseudanabaena recta were the main cyanobacterial species found in these two reservoirs (Tables 3 and 4). These species of cyanobacteria are known to be very common in the Ghanaian drinking water reservoirs20,30 and are considered very toxic and implicated in many poisoning episodes.1,12,14 Hoeger et al34 cautioned that due to tumour promoting activities of microcystin, chronic exposure of populations to a concentration of around 0.1 µg/L should be avoided.
| Table 3: Phytoplankton Species Composition and Biomass Obtained at the Five Treatment Stages of the Brimsu Water Treatment Plant in the Central Region of Ghana. (Counts/ml) |
| Species |
Intake |
Flocculation |
Sedimentation |
Filtration |
Chlorination |
| Green Algae |
|
|
|
|
|
| Ankistrodesmus falculatus |
– |
77 |
46 |
12 |
– |
| Staurastrum gracile |
3 |
– |
6 |
2 |
– |
| Scenedesmus dimorphus |
12 |
20 |
24 |
– |
– |
| Ulothrix tenuissima |
44 |
– |
– |
– |
– |
| Blue-green Algae |
|
|
|
|
|
| Anabaena flos-aquae |
546 |
208 |
191 |
50 |
32 |
| Merismopedia punctata |
91 |
84 |
70 |
9 |
– |
| Microcystis aeruginosa |
300 |
171 |
86 |
53 |
40 |
| Planktothrix agardhii |
693 |
253 |
153 |
68 |
31 |
| Pseudanabaena recta |
553 |
79 |
– |
– |
– |
| Diatoms |
|
|
|
|
|
| Synura sp. |
89 |
18 |
39 |
5 |
– |
| Table 4: Phytoplankton Species Composition and Biomass Obtained at the Five Treatment Stages of the Kwanyaku Water Treatment Plant in the Central Region of Ghana. (Counts/ml) |
| Species |
Intake |
Flocculation |
Sedimentation |
Filtration |
Chlorination |
| Green Algae |
|
|
|
|
|
| Ankistrodesmus falculatus |
– |
51 |
– |
|
9 |
| Chlorella vulgaris |
12 |
– |
2 |
|
14 |
| Staurastrum gracile |
– |
8 |
11 |
|
4 |
| Scenedesmus dimorphus |
– |
– |
– |
|
– |
| Ulothrix tenuissima |
185 |
– |
– |
|
– |
| Blue-green Algae |
|
|
|
|
|
| Anabaena flos-aquae |
123 |
112 |
95 |
|
38 |
| Chlorococcus cronbergae |
8 |
– |
– |
|
– |
| Merismopedia punctata |
175 |
218 |
– |
|
– |
| Microcystis aeruginosa |
603 |
202 |
75 |
|
23 |
| Planktothrix agardhii |
244 |
90 |
78 |
|
24 |
| Pseudanabaena recta |
133 |
54 |
32 |
|
– |
| Diatoms |
|
|
|
|
|
| Gyrosigma sp. |
3 |
– |
– |
|
– |
| Navicula graciloides |
12 |
– |
9 |
|
– |
| Synura sp. |
3 |
– |
– |
|
– |
| Synedra acus |
13 |
88 |
– |
|
2 |
CONCLUSION
Microcystin-LA found in the intake of the Brimsu Reservoir for the first time in Ghana is very significant as those found earlier in the Weija Reservoir. This implies that microcystin is widespread in Ghana and government agencies concerned with potable water production and health provision must consider taking into account cyanobacteria and cyanotoxins levels into the drinking water criteria. Concentrations of intracellular microcystin detected in drinking water samples from the Brimsu and Kwanyarko Reservoirs are below the WHO guideline, however, people using the raw water as their source of drinking water may be at risk due to the tumour promoting activity of microcystin. The Brimsu Reservoir treatment plant was found to be more efficient in removal of cyanobacteria cells than that of the Kwanyarko Reservoir. It is recommended that drinking water in Ghana should be regularly monitored for the levels of cyanobacteria and microcystin to protect human health.
ACKNOWLEDGEMENT
The third author acknowledges the travel and subsistence support from the Ideas Research Institute of the Robert Gordon University, Aberdeen, Scotland, UK that enabled her to travel to UK for a five months research visit to the University to undertake this study analyses. The authors will like to express their gratitude to Mr. K.A.A. de Graft-Johnson for editing the manuscript and also express their appreciation for the CSIR Water Research Institute for their co-operation and local funding for sample collection in Ghana.
CONFLICTS OF INTEREST
The authors declare that they have no conflicts of interest.


