INTRODUCTION
Lung cancer remains the leading cause of cancer-related death worldwide, accounting for 1.59 million of the 8.2 million total cancer deaths each year.1 Non-small cell lung cancer (NSCLC) accounts for ~80% of all lung cancers and adenocarcinoma, the main histological subtype, has frequently already metastasised when detected. As standard single-site biopsy of the primary tumor may not capture intratumor heterogeneity or the genetic makeup of metastatic lesions, such testing can lead to inaccurate prognosis and treatment strategies.2,3 Availability of tissue biopsy in the majority of cases is limited and in some cases cannot be performed, thus reducing the likelihood of successfully monitoring therapeutic response. The use of alternative sources of biopsy material that reflect tumor heterogeneity and the metastatic state, such as readily available blood4 or Pleural Effusions (PE),5 may provide valuable information.
There is an urgent need for sensitive methods for assessing mutational status from small biopsy samples for prognosis and predicting response to therapy as well as progression of lung adenocarcinoma. Next generation sequencing (NGS) offers attractive prospects, including the ability to simultaneously interrogate hundreds of mutational hotspots with high accuracy and sensitivity from limited amounts of genomic DNA from a variety of tumor sources. Major improvements in sequencing technology such as increased read length and accuracy have resulted in dramatic cost reductions, making NGS more affordable. Protocols for isolation of amplifiable DNA from Formalin-fixed paraffin-embedded (FFPE) samples6 and the small amount of DNA available from fine-needle aspirates7 have also improved. NGS is particularly valuable when solid tumor biopsies cannot be obtained but sampling of circulating free DNA (cfDNA) in plasma or pleural effusions is possible.8,9 Genetic alterations commonly found in thyroid cancer can be detected in cfDNA and have proved very useful in diagnosis from fine-needle aspirate biopsies that gave cytologically indeterminate results.10,11
For the clinical lab, NGS allows one single test on a single platform irrespective of cancer type or biopsy source.12 Alternatively, customized panels can be designed that focus on cancer type-specific mutations, eg. ThyroSeq for thyroid cancer.13 Panels can be relatively small (20-30 Kb capture size) that focus on well-studied mutation hotspots or much larger panels (several hundred Kb to a few Mb) that encompass mutations for which therapeutics are in the pharmaceutical pipelines as well as genomic sites that are frequently mutated and may be of clinical or pharmacodynamic relevance.14,15
Mutation analysis of NGS raw sequence data involves a complicated series of processes that can be divided into two main parts: alignment and variant calling. Alignment involves aligning the tumor and normal sequence reads to a human reference genome, a number of post-processing steps including realigning sequences around insertion and deletions (where mis-alignment is likely), recalibrating instrument quality scores and gathering quality metrics. Variant calling includes comparing the normal, tumor and reference sequence to look for possible variants, filtering these variants based on quality, clinical significance or other parameters and finally, annotating the mutation. Although commercial tools are available for NGS mutation analysis, they are costly and often involve storing data in a cloud environment, which may be prohibited for clinical patient data. Therefore, locally installed, open source tools are a desirable option. However, it is also essential to have an analysis pipeline that is accessible to clinicians and scientists with no programming knowledge. Galaxy16 is an open, web-based workbench that provides a framework for building pipelines for computational analyses of genomic data. Galaxy pipelines are secure, accessible, reproducible and transparent. Galaxy can be installed locally to protect sensitive data. Once open sources tools have been installed into the Galaxy framework and a workflow has been designed, users access the pipeline through an easy to use Graphical User Interface (GUI). Provenance tracking is automatic; metadata such as inputs, parameters and outputs for each tool used are stored and easily accessed through the GUI. Galaxy’s web-based model allows easy sharing of datasets, histories and workflows.
Here we report a pilot study that compared four different library construction methods and two different sequencing platforms. 48 samples (22 tumor/matched normal pairs, one tumor only sample plus two controls) were compared across Ion AmpliSeq and Roche SeqCapEZ. Due to lack of DNA for four of these samples, they were replaced by four samples from blood and PEs for analysis by Illumina TruSeq. Finally, upon acquisition of a Raindance digital droplet Polymerase Chain Reaction (PCR) instrument, a subset of 22 samples for which sufficient DNA remained plus two samples of cfDNA from plasma and a PE were analysed using this technology for library construction. A bioinformatics pipeline for sequence quality checking, alignment, post alignment processing, variant calling and annotation was developed within the Galaxy framework. The advantages and disadvantages of each method in our hands are discussed.
MATERIALS AND METHODS
Sample Information
Patient FFPE-preserved tumor biopsy samples and matched normal lung tissue were obtained from the Clinical Diagnostics Laboratory at Capital District Health Authority (CDHA; Halifax, NS, Canada). In addition, plasma from one patient, PE from one patient (both the cell pellet and cfDNA), whole blood from one patient and two control samples containing known amounts of cell lines harbouring mutations of interest (Supp Tables 1 and 2) were also analysed. Cell lines H1650, H1781, H1975, A549 and SW948 were obtained from the American Type Culture Collection and propagated as recommended. Cell line H3122 was a kind gift from Dr. Jeffrey Engelman, Massachusetts General Hospital, Boston, MA. Cell line HCC78 was obtained from Dr. John D. Minna (The University of Texas Southwestern Medical Center, Dallas, TX). This study was approved by the Capital Health Research Ethics Board (CDHA-RS/2013-090), and all participating individuals signed informed consent.
DNA Preparation and Quality Control
DNA was prepared for mutational analysis in the Clinical Diagnostics Laboratory at CDHA as described.17 DNA from 22 tumor/matched normal pairs and one tumor only sample with known mutational statuses as determined by multiplex SNaPshot analysis and a quadruplex sizing assay and for which there was at least 1 mg of DNA available were chosen for analysis (Supp Table 1). DNA was sheared at the Genome Quebec/McGill Innovation Centre using an Adaptive Focused Acoustics ultrasonicator (Covaris, Woburn, MA, USA). PEs were obtained and processed within 2 to 4 h after thoracocentesis. The samples were centrifuged at 1,000 rpm for 10 min and cell pellet and supernatant were saved and frozen at -20 ºC.
cfDNA was prepared from 3 mL of plasma and 10 mL of PE supernatant using the QIAamp Circulating Nucleic Acid kit (Qiagen, Mississauga, ON, Canada). DNA was prepared from the PE cell pellet derived from 10 mL of PE and from 400 µL of whole blood using a QIAamp DNA Mini and Blood Mini Kit (Qiagen). DNA from the PE cell pellet and the whole blood was sheared by passing it through a 26-guage needle.
Double-stranded DNA from all samples was quantified using a Qubit 2.0 Fluorometer (Invitrogen, Burlington, ON, Canada) and DNA quality was determined using a Kapa hgDNA Quantification and QC kit (Kapa Biosystems, Boston, MA, USA) and a LightCycler 480 (Roche Applied Science, Laval, QC, Canada) according to the manufacturers recommendations.
DNA library preparation and next generation sequencing roche EZSeq custom capture (EZ): A custom SeqCap EZ Choice library (Roche Nimblegen) was designed to capture 211,652 Kb of DNA sequence from 863 amplicons in 94 genes that are often mutated in solid tumors. This custom design included all of the genes present in the other three panels as well as 14 introns from 5 genes (ALK, BRAF, NTRK1, RET, and ROS1) in which translocations commonly occur (Supp Table 3). The custom capture and library preparation were performed by the Genome Quebec/McGill Innovation Centre (Montreal, QC, Canada). Briefly, libraries were prepared from 250 ng of sheared DNA from 22 tumor/matched normal pairs, one tumor only sample, and two control cell line mixtures (Supp Table 1) using the Kapa HTP Library Preparation kit (Kapa Biosystems). Two sets of barcoded libraries of 24 samples each were generated. DNA end-repair, A-tailing, ligation of TruSeq indexed adapters (Illumina), and amplification were performed according to the supplier’s protocol. The libraries were quantitated using a Qubit 2.0 Fluorometer as well as by quantitative Polymerase Chain Reaction (qPCR) using the Kapa Library Quantification kits (Kapa Biosystems). The libraries were also checked on a BioAnalyzer to assess the average insert size. Equal amounts of each set of 24 libraries were pooled and 1 mg of multiplexed DNA library pool was hybridized to the SeqCap EZ library together with Hybridization Enhancing (HE) oligonucleotides as described in the Roche SeqCap EZ protocol. After amplification of the captured multiplexed DNA library pools, each pool of 24 libraries was run on a separate MiSeq at the Genome Quebec/McGill Innovation Centre using 150 bp paired end runs.
Ion AmpliSeq (IT): Targets were amplified from the same samples as above by 20 cycles of PCR using the Ion AmpliSeq Cancer Hotspot Panel v2 (Life Technologies, Burlington, ON, Canada) and the Ion AmpliSeq Library Kit 2.0 with 10 ng of input DNA according to the supplier’s protocol with the following modifications. Forty-eight samples were processed in three sets of sixteen samples each. In order to assess whether per sample sequencing cost could be reduced without detrimental effects on sequence quality and output, for two sets of samples one-fourth, and for one set one-half, reagent volume from AmpliSeq Library Kit 2.0 was used. Primer sequences were partially digested and amplicons were phosphorylated with the FuPa reagent, and then barcoded using Ion Xpress Barcode Adapters (Life Technologies). After removal of the excess adapters from unamplified libraries using AMPure XP Reagent (Beckman Coulter, Mississauga, ON, Canada), libraries were amplified for 7 cycles and equalized using the Ion Library Equalizer Kit (Life Technologies). Equal volumes of 16 libraries were combined resulting in three sets of 16 pooled libraries and automated template preparation was performed on an Ion OneTouch 2 system using Ion PGM Template 0T2 200 Ion Sphere particles (IPS) and the Ion OneTouch Template OT2 kit (Life Technologies). Each set of 16 libraries was enriched for template-positive Ion PGM Template 0T2 200 ISP on the One Touch ES system and sequenced on a separate 318 chip using an Ion PGM Sequencing 200 kit v2 (Life Technologies). All procedures were performed at the Genome Quebec/McGill Innovation Centre.
Illumina TruSeq (TS): Targets were amplified from all of the same samples as above except for four (1, 8, 21, and 23) for which no DNA remained (Supp Table 1). Instead, four samples derived from blood or PE were included to test the feasibility of using cfDNA. Libraries were prepared at NRC Halifax from 250 ng DNA following the TruSeq Amplicon Cancer Panel library preparation guide Rev. A, April 2012. Briefly, DNA samples were hybridized with the primer pool, purified from unbound primers on the Illumina Filter plate by washing, and then bound oligos were extended and ligated by incubation at 37 °C. After addition of barcoding adapters and common adapters for cluster generation by polymerase chain reaction (PCR) a 5 µL aliquot from control and selected samples were run on 4% gel to confirm library amplification and expected fragment size. Libraries were purified using AMPure XP Reagent (Beckman Coulter) and were normalized using library normalization beads (Illumina), pooled in equimolar amounts and quantitated by qPCR. The pooled library was diluted 100-fold in chilled HT1 buffer to 11 pM and loaded into the MiSeq V2 reagent cassette for 150 bp paired end runs.
RainDance ThunderBolts (TB): Twenty-four samples (Supp Table 1) for which DNA still remained (LT/LN6, LT/LN10-18, cell line controls, PE supernatant and plasma) were used to construct the libraries using the ThunderBolts Cancer Panel v7.1 (RainDance Technologies, Lexington, MA, USA). Libraries were constructed at NRC Halifax using the Thunderbolts Cancer Panel Consumables Pack according to the supplier’s protocol. For each sample, two separate reactions were set up for droplet generation. Each primer pool set was mixed with 50 ng DNA, 2X Genotyping Master Mix (Life Technologies), droplet stabilizer and transferred to the RainDrop chip (8 reactions/chip). Droplets were generated in the RainDrop digital PCR source instrument (RainDance Technologies), transferred to a 96-well PCR block, and amplified by PCR for 55 cycles using the ThunderBolts Cancer Panel 1st PCR cycling conditions. After purification using AMPure XP Reagent (Agencourt), Illumina bar-coded primers (Integrated DNA Technologies, Coralville, IA, USA) were added to each library pair by PCR for 10 cycles. After purification using AMPure XP Reagent (Agencourt), library pairs were quantitated on a Bioanalyzer (Agilent). Total product yield was calculated for each pair and the samples were diluted to 2 nM. Equal portions of each 2 nM library were pooled, diluted to 1 nM, and denatured with 0.2 N NaOH. Pooled and denatured library was diluted to 8 pM with chilled HT1 buffer (Illumina), and loaded into a MiSeq V2 reagent cassette with Raindance custom sequencing primers as described in the ThunderBolts Cancer Panel Protocol for Illumina MiSeq run.
Data Analysis
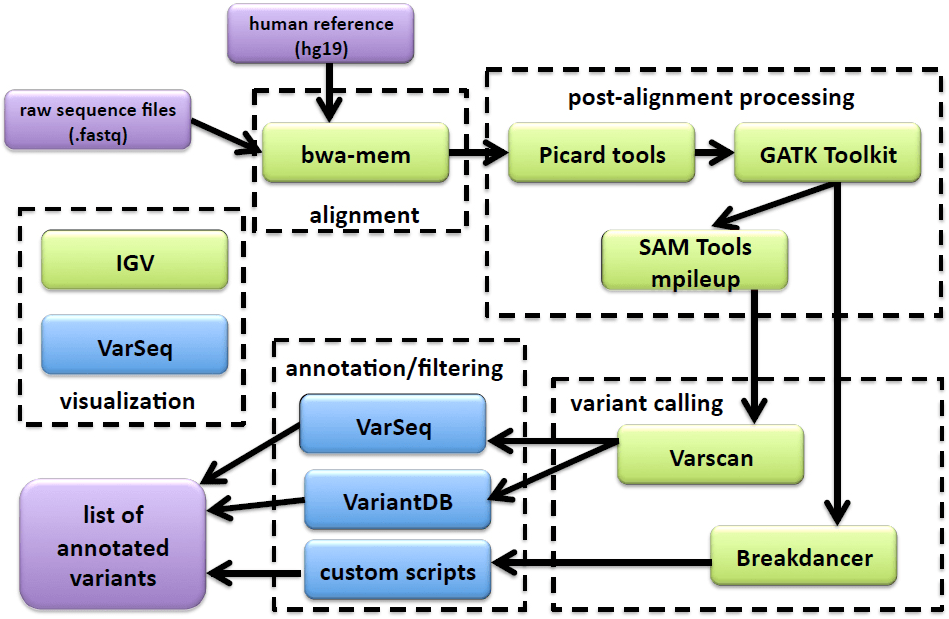
All sequence files were processed using a custom Galaxy (http://galaxyproject.org) bioinformatics pipeline (Figure 1). FASTQ files were aligned to build 37 of the human reference genome (hg19) using the bwa-mem18 algorithm (for Ion Torrent sequences the following were changed from default values: -O 7, -E 2, -L 2). Alignment files were sorted with Picard Tools v1.129, realigned and recalibrated using GATK.19 Pileup files were built using SAMtools mpileup20 (-d 10000, -q 30, -Q 20). Metrics were calculated using Picard’s CollectMultipleMetrics, CollectTargetedPcrMetrics and CalculateHsMetrics (http://picard.sourceforge.net). Variants were called with Varscan21,22 (http://varscan.sourceforge.net) using the default settings (except tumor-purity was reduced from 1 to 0.6) for clinical samples. For cell line controls, the min-var-freq was reduced from 0.1 to 0.02 since some of the mutations were present at low frequency. Translocations were analysed using BreakDancer.23 Annotation and filtering was performed using VariantDB24 or VarSeq (Golden Helix, Bozeman, MT). In four cases, (Samples 1, 8, 21 and 23) sequence data was not obtained from a matched normal sample with the TruSeq panel as there was insufficient DNA remaining. In these cases, a randomly chosen normal sample (LN13) was used to generate the variant files.
Figure 1: A schematic of the NGS mutation analysis pipeline including alignment, post-alignment processing, variant calling, annotation/filtering, and visualization tools. Tools shown in green are accessed from the Galaxy webinter face; tools in blue are accessed outside of Galaxy. Inputs and outputs are shown in purple.
RESULTS AND DISCUSSION
Sequencing Metrics
Sequencing metrics for all samples run on the four platforms (EZ, IT, TS and TB) are available in Supp Table 4A-4C.Metrics were calculated using Picard tools as described in Methods. For the ten tumor/matched normal pairs and two controls that were run on all four platforms, comparative data are shown in Table 1 and discussed in depth below.
Mean Target Coverage and 100X Coverage of Target Bases
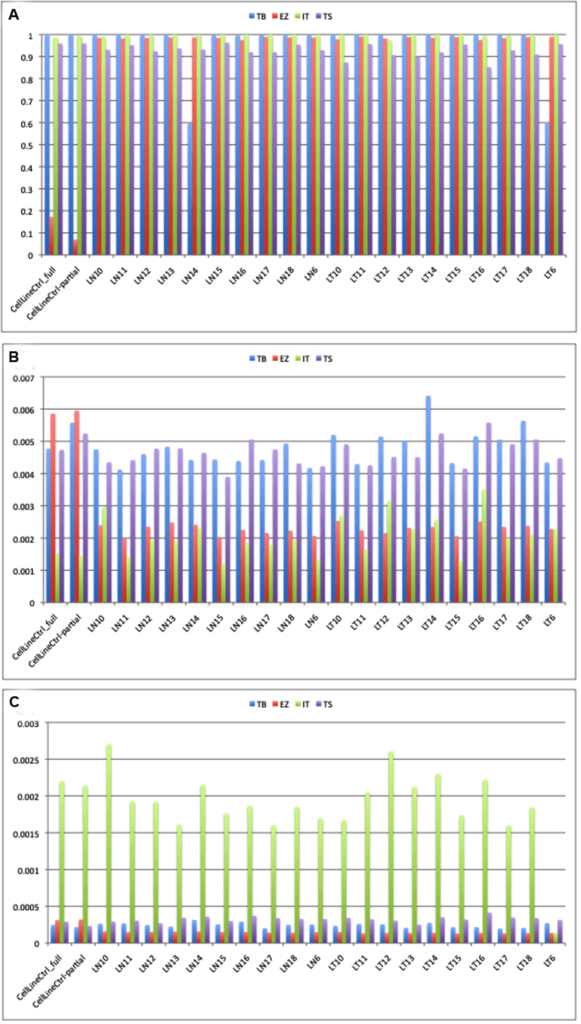
All of the platforms gave the predicted depth of coverage, taking into account the size of the panels and the output from the sequencers. The Thunderbolts platform gave the highest depth of target coverage whereas the EZSeq library gave the lowest (Figure 2A). However, the panel size was much higher for the EZSeq library (211 Kb vs. 30-37 Kb for the other panels). A single MiSeq run with the Version 2 chip is predicted to give approximately 5.7 Gb of sequence, which would give depth of coverage for 48 samples with the 210 kb EZSeq panel and two MiSeq runs of approximately 840X, 48 samples with the 35 kb TruSeq panel and one MiSeq run of 2600X, and 24 samples with the 30 Kb Thunderbolts panel and one MiSeq run of 5970X (correcting for approximately 85% enrichment efficiency and 90% mappable reads). This is very close to what we obtained (522X, 2975X and 4829X, respectively).
Figure 2: Median depth of coverage (A), error rate (B) and indel rate (C) obtained using four platforms. TB: Raindance Thunderbolts; EZ: Roche EZSeq; IT: Ion AmpliSeq; TS: Illumina TruSeq
Although the EZSeq platform resulted in lower reads, it captured a much larger target and thus more sequence information including potential translocation breakpoints (usually in introns), and was customizable. However, it will require more sequence runs (and therefore cost) to provide sufficient coverage for accurate mutation calling.
Thunderbolts, Ion AmpliSeq and EZSeq panels all had similar median % coverage of target bases at 100X (98.45-100%) whereas the TruSeq panel gave consistently lower values (92.96%). In addition, the median % zero coverage targets was 0.5% for TruSeq whereas it was virtually zero for the other platforms. For the TruSeq panel, however, twice as many samples were run per MiSeq run and this could have contributed to the lower % coverage of target bases.
Three samples (LN1, LN8 and LN21) had limiting amounts of DNA and gave significantly lower total reads with the EZSeq and Ion AmpliSeq panels (Supp Table 4), and higher % zero coverage targets. Previous studies have also reported that samples with marginal DNA yields underperformed in NGS assays compared to those with adequate DNA.15 One sample (LN14) gave only about one tenth the number of total reads compared to the other samples with the Thunderbolts panel. However, the percent of reads that aligned to the reference genome and the error/indel rates were no different from other samples with high read counts (98-99%).
Reducing the amount of reagent used for the Ion AmpliSeq library construction did not result in any appreciable reduction in mapped reads, mean depth or percent on target reads (data not shown). In fact the two libraries where only ¼ reagent amounts were used had marginally superior metrics than the library in which ½ reagent amounts were used. It is possible that significant cost savings could be achieved if this finding is borne out in a larger study.
Coverage for samples from the PE pellet and plasma that were sequenced using the TruSeq and Thunderbolts panels also gave significantly lower total reads than those that were derived from FFPE and a lower percentage of these reads aligned to the reference genome (94% and 82%, respectively, for TruSeq; 90% for Thunderbolts) and to the amplicon targets at >100X coverage (79 and 73%, respectively, for TruSeq; 99.9% for Thunderbolts). Interestingly, cfDNA isolated from the PE supernatant had comparable total reads but the percentage of reads aligned to the reference genome and to the amplicon targets at >100X coverage was lower for TruSeq (93%). Whole blood performed comparably to other samples for all metrics, confirming that blood serves as a good patient matched control for the tumor biopsy material.
Error Rates
All four platforms had acceptable error rates below 0.5% (Figure 2B). Errors can result from the amplifcation reaction or from the sequencing chemistry itself. EZSeq and Ion AmpliSeq libraries had error rates approximately half those of ThunderBolts and TruSeq libraries (0.23% and 0.19% vs. 0.48% and 0.47%). This could be due to the high number of PCR cycles (55) used in the generation of the Thunderbolts libraries; optimisation of conditions such as reducing the number of PCR cycles may improve the error rate for this panel. However, only 27 cycles of PCR were used for the TruSeq libraries so it is possible that there are other underlying causes for the higher error rate. Strand-specific sequencing errors as described in Simen, et al.12 were seen in multiple samples and on different instruments.Errors generated during PCR steps of library preparation are most frequent in amplicons with low coverage and with samples of low quality. Single nucleotide misincorporation at an early stage results in over-representation in the final library. Sequencing samples in duplicate can distinguish real mutations from amplification errors, although this adds to the cost of the assay.12
Indel Rates
Indel rates were low for all platforms except the Ion AmpliSeq (Figure 2C), which had indel rates approximately ten-fold higher (0.19% vs. 0.01-0.03%). Many of the indels occurred in homopolymer tracts of four or more identical bases, a phenomenon which has been noted commonly.25
Chimeras
The percent chimeric reads could be calculated for all MiSeq paired end reads but not the single reads from the Ion Torrent instrument (Table 1). The Thunderbolts platform had a significantly lower number of chimeric reads (0.04% compared to 0.19% and 0.47% for the TruSeq and EZSeq platforms, respectively). This advantage could be due to the picolitre-sized droplets generated during the Thunderbolts library construction; where each droplet only contains one template, there would be less opportunity for chimeric amplicons to be formed.
| Table 1: Sequencing metrics calculated for ten sample pairs and two cell line controls run on all four platforms. |
| Variable |
ThunderBolts |
EZSeq |
AmpliSeq |
TruSeq |
| Input DNA (ng) |
100 |
250 |
10 |
250 |
| Capture size (Kb) |
30 |
211 |
37 |
35 |
| Time |
shortest |
longest |
medium |
medium |
| Runs |
1 MiSeq |
2 MiSeq |
3×318 |
1 MiSeq |
| Samples |
24 |
48 |
48 |
48 |
| Metricsa |
|
|
|
|
| mean target coverage |
4829X |
522X |
1353X |
2975X |
| %target bases 100X |
99.93 |
98.45 |
100 |
92.96 |
| %zero coverage |
0 |
~0 |
~0 |
0.53 |
| %errors |
0.48 |
0.23 |
0.19 |
0.47 |
| %indels |
0.02 |
0.01 |
0.19 |
0.03 |
| %chimeras |
0.04 |
0.47 |
n/a |
0.19 |
| CDHA concordance |
excellent |
excellent |
Goodb |
excellent |
| cell line controls |
excellent |
Goodc |
excellent |
excellent |
aMedian values
bMissed EGFR 19-DEL 24 bp
cNot consistent with other three platforms |
Mutation Detection and Congruence with SNaPshot and Sizing Mutational Analyses
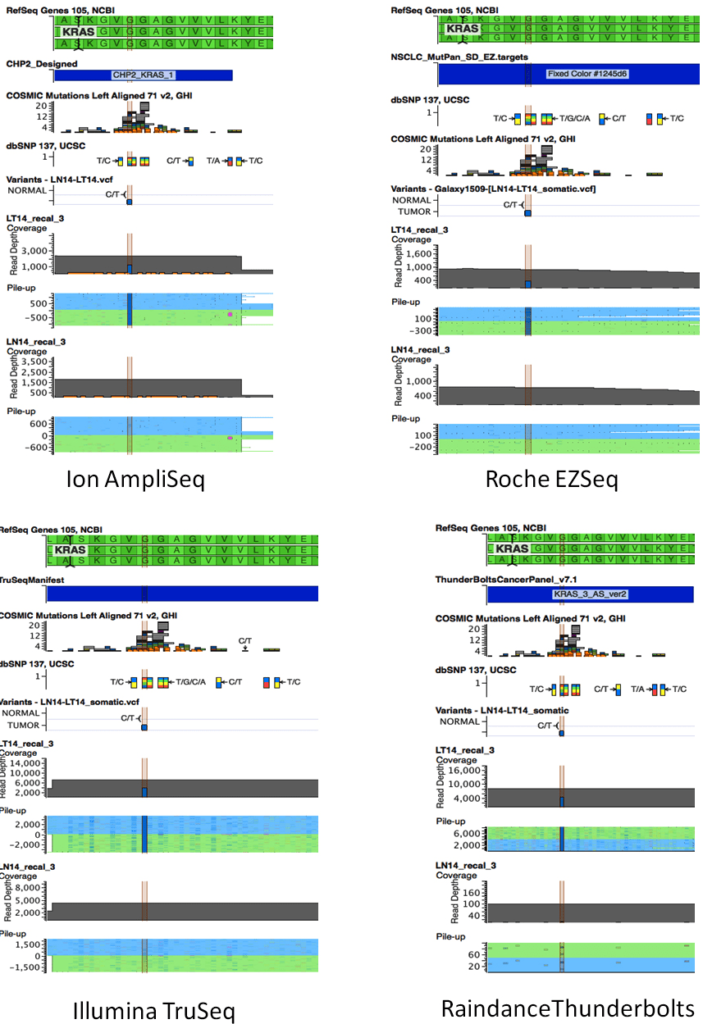
With one exception, all platforms detected the mutations identified by SNaPshot and sizing assays in all 23 tumor samples (Table 2). The EGFR deletion in Exon 19 in sample 9T was missed by Ion AmpliSeq but detected by EZSeq at low frequency (1.8%) and TruSeq at 15.8%. NGS was more informative than the SNaPshot and sizing assays in providing information on the sizes of the deletions in EGFR Exon 19 in samples 1 and 9 and uncovering additional information on the nucleotide position of the KRAS mutations. The KRAS34 mutation identified by SNaPshot in sample 11T was actually two KRAS mutations in adjacent nucleotide positions 34 and 35 of codon 12. These were found in all four platforms and occurred on different sequencing reads, indicating tumor heterogeneity rather than a double mutation in some clones (Figure 3). An actionable KRAS codon 13 mutation (c. 38G>A) that is not included in the SNaPshot assay was identified in sample 14T at a frequency of 39-55% by all four platforms (Figure 4).
| Table 2: Concordance of mutation calls in clinical samples between SNaPshot/sizing assaysa and NGS. Discordant results are shaded gray. n/a, not applicable because sample was not sequenced or was negative for the mutation. |
| Sample |
Mutationa |
IonTorrent |
%b |
EZ Seq |
%b |
TruSeq |
%b |
Tbolt |
%b |
| 1T |
EGFR 19-DEL |
EGFR 19-DEL 9bp |
42.4 |
EGFR 19-DEL 9bp |
28.5 |
EGFR 19-DEL 9bp* |
29.3 |
not done |
n/a |
| 2T |
Negative |
negative |
n/a |
negative |
n/a |
negative |
n/a |
not done |
n/a |
| 3T |
Negative |
negative |
n/a |
negative |
n/a |
negative |
n/a |
not done |
n/a |
| 4T |
Negative |
negative |
n/a |
negative |
n/a |
negative |
n/a |
not done |
n/a |
| 5T |
Negative |
negative |
n/a |
negative |
n/a |
negative |
n/a |
not done |
n/a |
| 6T |
KRAS 34 |
KRAS G12C (c.34) |
33.7 |
KRAS G12C (c.34) |
36.9 |
KRAS G12C (c.34) |
38.0 |
KRAS G12C (c.34) |
28.6 |
| 7T |
KRAS 35 |
KRAS G12D (c.35) |
19.8 |
KRAS G12D (c.35) |
23.2 |
KRAS G12D (c.35) |
19.7 |
not done |
n/a |
| 8T |
KRAS 34 |
KRAS G12C (c.34) |
24.6 |
KRAS G12C (c.34) |
16.6 |
KRAS G12C* (c.34) |
23.8 |
not done |
n/a |
| 9T |
EGFR 19-DEL |
negative |
n/a |
EGFR 19-DEL 24bp |
1.8 |
EGFR 19-DEL 24bp |
15.8 |
not done |
n/a |
| 10T |
Negative |
negative |
n/a |
negative |
n/a |
negative |
n/a |
negative |
n/a |
| 11T |
KRAS 34c |
KRAS G12A (c.35) |
21.8 |
KRAS G12A (c.35) |
21.7 |
KRAS G12A (c.35) |
24.2 |
KRAS G12A (c.35) |
22.6 |
|
|
KRAS G12C (c.34) |
8.6 |
KRAS G12C (c.34) |
4.8 |
KRAS G12C (c.34) |
2.6 |
KRAS G12C (c.34) |
5.4 |
| 12T |
Negative |
negative |
n/a |
negative |
9.0 |
negative |
n/a |
negative |
n/a |
| 13T |
Negative |
negative |
n/a |
negative |
|
negative |
n/a |
negative |
n/a |
| 14T |
Negative |
KRAS G13D (c.38) |
50.0 |
KRAS G13D (c.38) |
39.0 |
KRAS G13D (c.38) |
54.6 |
KRAS G13D (c.38) |
55.0 |
| 15T |
KRAS 34 |
KRAS G12C (c.34) |
27.3 |
KRAS G12C (c.34) |
19.4 |
KRAS G12C (c.34) |
22.8 |
KRAS G12C (c.34) |
26.6 |
| 16T |
Negative |
negative |
n/a |
negative |
|
negative |
n/a |
negative |
n/a |
| 17T |
KRAS 34 |
KRAS G12C (c.34) |
29.9 |
KRAS G12C (c.34) |
28.3 |
KRAS G12C (c.34) |
27.0 |
KRAS G12C (c.34) |
33.7 |
| 18T |
KRAS 34 |
KRAS G12C (c.34) |
32.3 |
KRAS G12C (c.34) |
28.0 |
KRAS G12C (c.34) |
33.8 |
KRAS G12C (c.34) |
31.2 |
| 19T |
NEGATIVE |
negative |
n/a |
negative |
n/a |
negative |
n/a |
not done |
n/a |
| 20T |
NEGATIVE |
negative |
n/a |
negative |
n/a |
negative |
n/a |
not done |
n/a |
| 21T |
NEGATIVE |
negative |
n/a |
negative |
n/a |
negative* |
n/a |
not done |
n/a |
| 22T |
NEGATIVE |
negative |
n/a |
negative |
n/a |
negative |
n/a |
not done |
n/a |
| 23T |
EGFR2369 |
T790M* |
38.4 |
T790M* |
39.0 |
not done |
n/a |
not done |
n/a |
aMutation detected by SNaPshot or Quadruplex Sizing Assay in the Clinical Diagnostics Laboratory, CDHA
bPercent allele frequency detected by NGS
cLT11 contained a mixture of c.34G>T (G12C) and c.35G>C (G12A) always in different reads, not together indicating tumor heterogeneity
*LN13 used as normal control due to lack of matched normal sample n/a, not applicable because sample was not sequenced or was negative for the mutation. |
Figure 3: Schematic showing Raindance Thunderbolts result for the double KRAS mutation in sample LT11 (highlighted). Position 34 has a c.G34T mutation and position 34 has a c.G35Cmutation. VarSeq visualisation includes RefSeq, Thunderbolts panel BED file, COSMIC mutations, dbSNPs, VCF file and sequence pileups for Sample 11 tumor (LT11) and matched normal (LN11) samples.
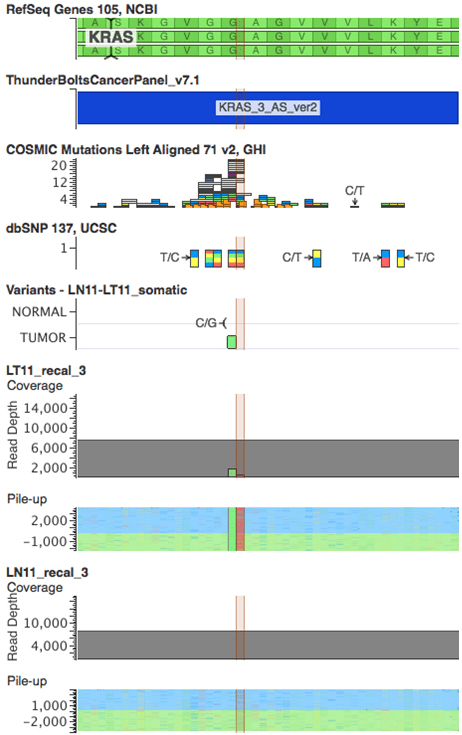
Figure 4: Schematics showing results from all four platforms for the KRAS c.38G>A mutation in sample LT14. The C/T variant corresponding to the complement of KRAS c.38G>A is highlighted. VarSeq visualisation includes RefSeq, VCF files, and corresponding sequence pileups for Sample 11 tumor (LT14) and matched normal (LN14) samples. A: Ion AmpliSeq; B: EZ, Roche EZSeq; C: Illumina TruSeq; D: Raindance Thunderbolts.
The allele frequencies were quite consistent across platforms (Table 2) although in some instances, one platform showed a lower frequency from the other three. For example, the KRAS G13D mutation in sample 14T and the KRAS G12C mutation in sample 15T were present at 39% and 19.4%, respectively, in the EZSeq platform whereas in the other three platforms, these mutations were present at 50-55% and 23-27.3%, respectively.
In addition to the mutations that were assayed in the Clinical Diagnostics Laboratory, several others were identified using NGS, the most common of which were in TP53 (Supp Table 5). These were found in eleven different tumors; the TP53 p.R234L mutation was found in three separate tumors. The p.Q61L mutation was detected in the HRAS gene, whereas in lung cancer it is normally found in the KRAS gene.
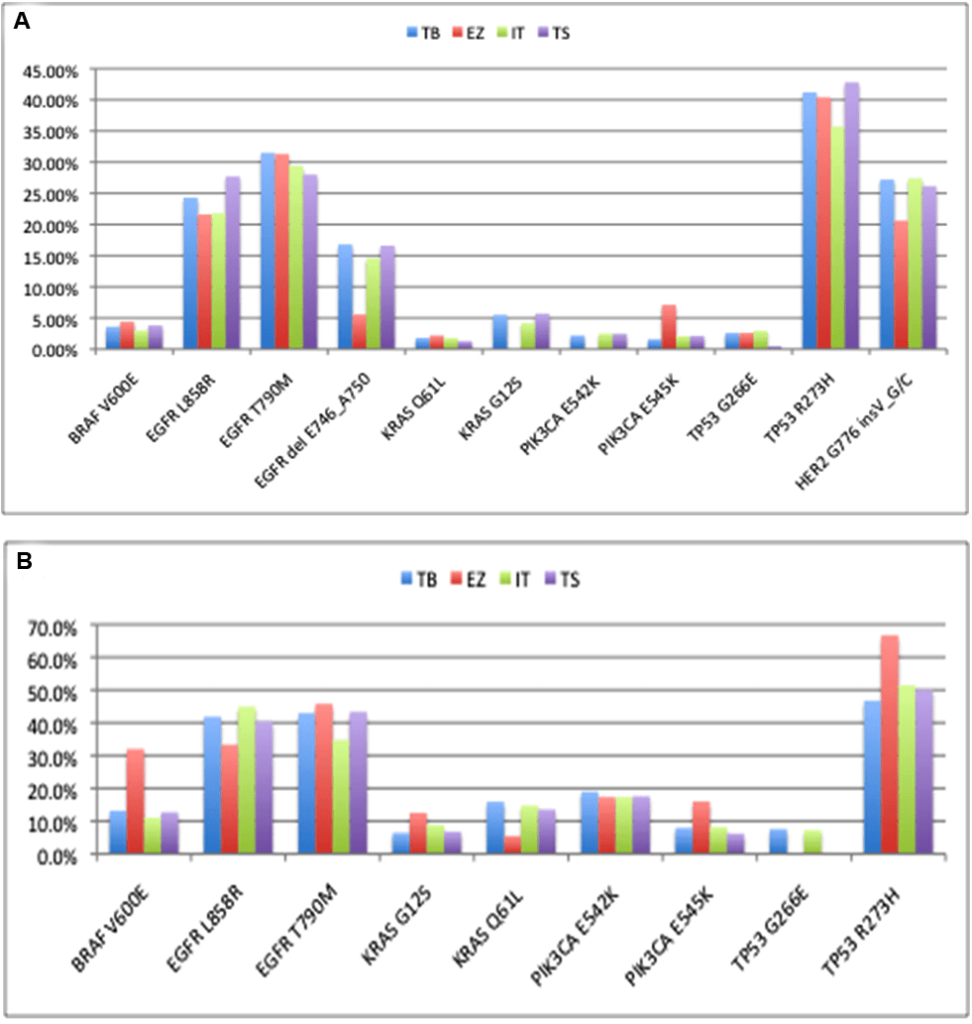
Concordance with Cell Line controls
The concordance of mutation detection in cell line controls by NGS is shown in Figure 5. The allele frequencies were quite consistent across platforms, although KRAS G12S and PIK3CA E542K were not detected using the EZSeq platform.The values from the EZSeq platform also deviated substantially in the cases of the EGFR Exon19 deletion, the HER2 insertion and the PIK3CA E545K for the complete control and BRAF V600E and TP53 R273H for the partial control. This could be attributed to the relatively low read depth for this platform; there were only approximately 100 or less reads for the tumor samples using the EZSeq platform compared to hundreds for the Ion AmpliSeq platform and several thousand for the other two platforms. Unfortunately, these low reads also prevented detection of the EML4:ALK and SLC34A2:ROS1 translocations represented in the EZSeq panel. All of the platforms except EZSeq detected low frequency mutations at below 2%. It has been reported that mutation detection performance deterioriates when coverage falls below 100X15 and increasing the read depths for the EZSeq platform could resolve this problem. Given the wide variation in the amount of malignant cells in different tumors, detection at sensitivity of 2% is feasible with the high coverage obtained by the Raindance Thunderbolts and Illumina TruSeq platforms.
Figure 5: Comparison of mutation detection in cell line controls (Supp Table 2) between four platforms. (A) Complete control containing cocktail of DNA from nine cell lines. (B) Partial control containing DNA from five of the cell lines in the complete control. TB: Raindance Thunderbolts; EZ: Roche EZSeq; IT: Ion AmpliSeq; TS: Illumina TruSeq.
Liquid Biopsy Samples
Non-invasive techniques such as liquid biopsies for genotyping tumors show great promise for diagnosing cancer earlier,9 for following treatment, and for monitoring resistance during therapy,26 especially in patients for whom solid tumor biopsies are unobtainable. Mutational analysis of liquid biopsies also can potentially provide a more complete picture of the heterogeneity present in tumors compared to biopsies from a single region of a solid tumor. We demonstrated the feasibility of detecting mutations in cfDNA from plasma and pleural effusions using Thunderbolts and TruSeq platforms (Table 3). Although we only tested limited samples, it appears that the Thunderbolts platform gave superior results for this type of sample. The mean targeted bases at 100X coverage for the PE supernatant and plasma LP003 were significantly higher (99.9%) than for the TruSeq platform (93% and 73%). There were also significantly less off-target coverage for the PE supernatant and plasma (0.8 and 0.98%) compared to the TruSeq platform (9.3 and 3.2%). These results are very promising and application of NGS technology could extend plasma genotyping from such techniques as ARMS,27 allele-specific PCR, COLD-PCR, and emulsion PCR to more comprehensive analysis.8,28
| Table 3: Sequencing metrics calculated for cfDNA from pleural effusion supernatant and plasma run on all Thunderbolts and TruSeq platforms. |
| Variable |
ThunderBolts |
TruSeq |
|
PE Supa |
Plasma |
PE Supa |
Plasma |
| Metrics |
|
|
|
|
| mean target coverage |
6380X |
4251X |
2215X |
240X |
| %target bases 100X |
99.95 |
99.99 |
93.08 |
73.43 |
| %off target |
0.80 |
0.98 |
9.3 |
3.2 |
| %errors |
0.49 |
0.47 |
0.34 |
0.46 |
| %indels |
0.02 |
0.02 |
0.02 |
0.03 |
| %chimeras |
0.03 |
0.05 |
1.11 |
0.56 |
| acfDNA prepared from pleural effusion supernatant |
Pipeline Performance
Physician-friendly bioinformatics tools are crucial for successful implementation of personalized therapy selection guided by NGS. The NGS bioinformatics pipeline that we developed and implemented within a Galaxy framework, is easy to use and allows for consistent analyses for multiple samples with traceable workflows. Because the pipeline was built from open-sources tools, it is cost effective and can be adapted to different conditions (e.g. raw sequence files from two different sequencing platforms). In our opinion, this is a viable alternative to costly commercial tools.
Cost and Workflow Considerations
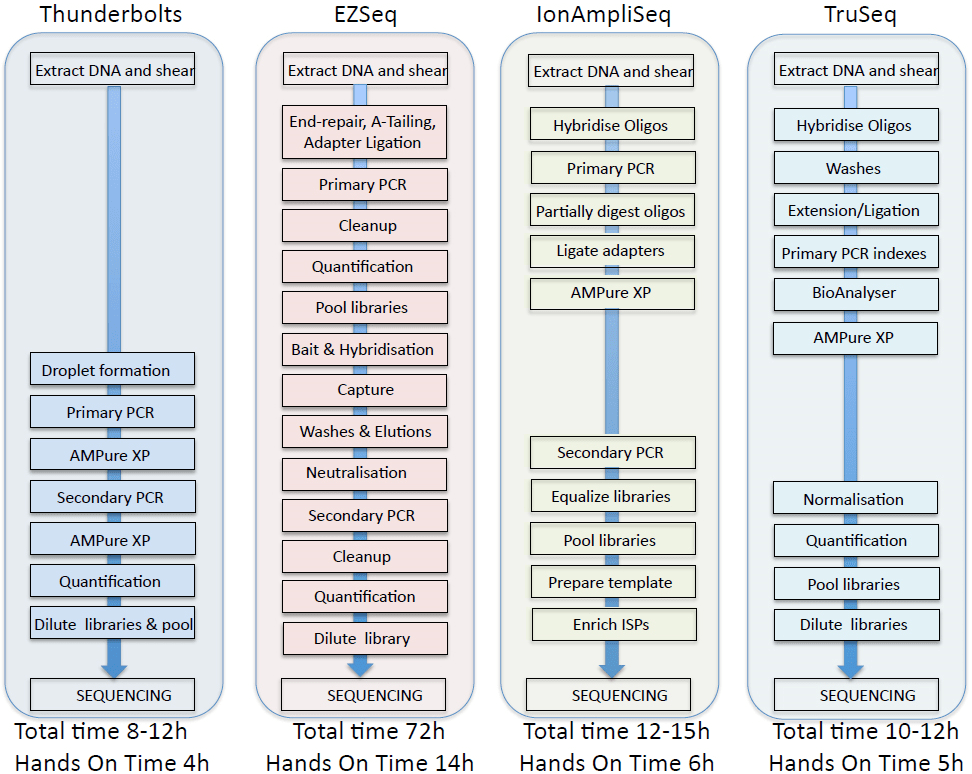
Comparisons of the workflows and data obtained from the four panels are summarized in Figure 6 and Table 1. In our hands, the Raindance Thunderbolts and Ion AmpliSeq assays were the most cost-effective, with per sample costs of approximately of $130 per sample based on libraries of 24 samples. Reducing the amount of reagents used with the Ion AmpliSeq assay had no adverse effects on sequence output, indicating that significant per sample cost reduction could be achieved with this platform. The EZSeq assay was the most expensive but resulted in almost ten times the target coverage. The Raindance Thunderbolts assay was the most time-efficient, provided the best depth of coverage, and excellent concordance with the cell line controls and the clinical lab mutation analysis. Use of the picolitre-sized droplets in the Raindance technology reduced the number of chimeric amplicons and greatly facilitated library construction, which was basically restricted to two PCR steps with concomitant cleanup steps. This technology would allow the short turnaround time required for clinical decision-making. Although the sequencing metrics for all of the platforms were quite similar, the Ion AmpliSeq data failed to pick up the EGFR exon19 deletion in one sample and gave a high percentage of indels, particularly in homopolymer stretches, making it a less attractive option.
Figure 6: Comparison of four NextGen sequencing workflows.
CONCLUSION
In conclusion, we have assessed four different platforms for NGS of cancer FFPE and liquid biopsies and are now preparing for implementation and validation in the clinical diagnostics lab according to CAP recommendations.29 In addition, studies to determine concordance between mutation detection from a larger number of solid tumor biopsies and corresponding cfDNA samples will be performed to more thoroughly assess the value of NGS with liquid biopsies.
ACKNOWLEDGEMENT
We gratefully acknowledge the technical assistance of Jeffrey Gallant, National Research Council (NRC) for DNA isolation from pleural effusion, blood and plasma. Pleural effusion and plasma samples were provided by Dr. Drew Bethune, Capital District Health Authority. DNA samples from patient tumor/matched normal pairs were prepared and provided by Dr. Wenda Greer and the staff at the Capital District Health Authority Clinical Diagnostics Laboratory. HCC78 and H3122 cell lines were kindly provided by Dr. John D. Minna (The University of Texas Southwestern Medical Center, Dallas, TX) and Dr. Jeffrey Engelman (Massachusetts General Hospital, Boston, MA), respectively. Preparation of the Ion Torrent AmpliSeq and Roche SeqCapEZ custom capture libraries and sequencing was performed by Genome Quebec/McGill Innovation Centre. The generous assistance of Ian Patterson and Paul Bentzen, Biology Department, Dalhousie University in operation of the MiSeq instrument is also acknowledged. Sheldon Briand (Shared Services Canada), installed and maintained the local Galaxy instance.Discounts on consumables for this project were provided by Raindance, Illumina, Roche and Ion Torrent and are much appreciated. Funding was provided by NRC.


