RELEVANCE
In recent years increasing attention has been paid to the macular area in glaucoma diagnostics.1,2 Although macula is less than 2% of the retina, it contains 30% of retinal ganglion cells (RGC).3
It has long been recognized that early glaucomatous damage can affect the macula.4-9 Moreover there is a lot of evidence of even initial damage of the macula in glaucoma, which has been repeatedly cited for the past 40 years.10-12 However, early macular damage has been ignored in clinical practice to a great extent until recently.
In 2010, Gabriele et al13 obtained detailed data about the anatomy of glaucomatous damage of the macula by means of OCT. D. Hood introduced the concept of “the macular vulnerability zone (MVZ)”—a zone of the macula that is the most vulnerable in glaucoma.14,15 Nevertheless, the origin of this phenomena is still unclear.
Reduced retinal hemoperfusion in glaucoma has been repeatedly mentioned in the literature.16,17,18 However, the lack of a reliable method to measure the optic nerve head and macula microcirculation did not allow to clarify the role of circulatory disorders in glaucoma pathogenesis. A new 3D angiography algorithm (split-spectrum amplitude-decorrelation angiography, (SSADA)) was developed for imaging retinal microcirculation.19 This method is based on ultrahigh-speed optical coherence tomography (OCT), and was called OCT-angiography (OCT-A). Using OCT-A the vascular density in the optic nerve head (ONH) and peripapillary area was measured.19,20,21 The authors found reduced ONH blood vessel density that was associated with structural and functional glaucomatous damage.22-25
The purpose of the present study was to assess vascularity of the macular area in patients with glaucoma by means of OCT-A.
MATERIALS AND METHODS
Sixty-five eyes of patients with POAG were examined: 38 eyes with early glaucoma, 27 eyes with advanced and far-advanced glaucoma. The control group has been presented by 22 eyes of healthy age-matched subjects without any ophthalmic pathology (Table 1).
Table 1: Patients characteristics.
|
Parameter
|
Normal controls |
p-value* |
POAG I |
p-value** |
POAG II-III |
Total p-value***
|
|
N
|
22 |
|
38 |
|
27
|
|
| Age, years |
61.9 (6.2)
|
0.622 |
62.5 (7.6) |
0.367 |
64.8 (4.7) |
0.071
|
| Systolic BP, mmHg |
126.6 (4.6)
|
0.010 |
135.4 (17.4) |
0.472 |
130.9 (13.7) |
0.018
|
| Diastolic BP, mmHg |
81.4 (6.9)
|
0.183 |
83.6 (9.9) |
0.726 |
83.15 (8.2) |
0.344
|
| IOPcc, mmHg |
15.5 (3.1)
|
0.001 |
19.4 (4.6) |
0.549 |
19.4 (6.2) |
<0.001
|
| MOPP, mmHg |
50.4 (2.4)
|
0.198 |
47.8 (9.8) |
0.594 |
46.6 (7.7) |
0.081
|
| MD, dB |
-0.03 (0.84)
|
<0.001 |
-1.95 (3.48) |
<0.001 |
-12.13 (6.2) |
<0.001
|
| PSD, dB |
1.41 (0.19)
|
0.006 |
2.20 (1.62) |
<0.001 |
9.79 (3.59) |
<0.001
|
| RNFL, μm |
101.9 (6.1)
|
<0.001 |
91.8 (10.3) |
<0.001 |
69.3 (14.3) |
<0.001
|
| GCC, μm |
98.3 (7.6)
|
0.001 |
89.2 (10.4) |
<0.001 |
70.5 (10.4) |
<0.001
|
| FLV, % |
0.21 (0.23)
|
0.004 |
2.18 (2.05) |
<0.001 |
9.50 (3.68) |
<0.001
|
| GLV, % |
1.62 (1.06)
|
0.001 |
7.60 (6.10) |
<0.001 |
25.91 (9.44) |
<0.001
|
| Foveal CT, μm |
312.3 (88.5)
|
0.342 |
279.9 (105.3) |
0.906 |
276.6 (82.6) |
0.581
|
| Peripapillary CT, μm |
181.4 (51.3)
|
0.348 |
179.3 (93.3) |
0.472 |
161.9 (64.9) |
0.346
|
The data are median; standard deviation is given in parentheses.
*actual level of significance (p-value) between the control group and POAG I
**p-value between POAG I and POAG II-III
***total p-value, comparison of the three groups using Kruskal-Wallis rank test
Glaucoma was diagnosed on the basis of characteristic changes in ONH that were detected by ophthalmoscopy: pathological deviation from the normal neural rim, glaucomatous optic disc cupping, peripapillary atrophy, wedge-shaped defects of RNFL adjacent to the edge of the optic disc, hemorrhages on the optic disc boundary. The results of standard automated perimetry (SAP) were outside normal limits.
Those patients who had previously used antiglaucoma drops were asked to discontinue the drug for a period of 3 weeks (drug washout period), while others were newly diagnosed glaucoma cases. Only one eye per patient was included in the study: in the glaucoma patients—the eye with a greater glaucomatous damage, and in the healthy individuals–the right eye.
All patients were Caucasians. The healthy participants were recruited from the persons accompanying the patients and had IOP of less than 21 mmHg for eyes, a normal Humphrey Swedish Interactive Threshold Algorithm (SITA) 24-2, standard visual field with mean deviation (MD) and pattern standard deviation (PSD) within 95% limits of the normal reference. They also had a Glaucoma Hemifield Test (GHT) within 97% limits, a central corneal thickness ≥500 μm, a normal-appearing ONH, a normal RNFL, an open anterior chamber angle as observed by gonioscopy, and no history of chronic ocular or systemic corticosteroid use. The age and race distribution of the controls matched that of the glaucoma patients.
The inclusion criteria were: ametropia ≤0.5 D and open anterior chamber angle of ≥30° confirmed by OCT of the anterior segment (Visante OCT, Zeiss). Only patients who had not undergone any eye surgery were included in the study. The exclusion criteria were: systemic administration of beta-blockers and calcium-channel blockers, concomitant ocular disease (except early-stage cataract), chronic autoimmune diseases, diabetes mellitus, acute circulatory disorders in past medical history, and any concomitant disease involving the administration of steroid drugs. A history of ocular arterial or venous obstruction (branch or central occlusion) or systemic conditions associated with venous congestion (e.g. heart failure) were also considered as exclusion criteria. All patients underwent Doppler ultrasound scanning to exclude pathology of the brachiocephalic vessels. Patients with normal tension glaucoma were excluded from the study.
IOP was measured using the ocular response analyzer (Reichert Ophthalmic Instruments, Depew, NY, USA). The device is based on a burst of air directed towards the cornea and uses two application pressure measurements, one during the depression of the cornea and another during the recovery. Measurement of CH allows for the calculation of IPOs, which appears to be less affected by properties of the cornea than conventional application goniometry.
OCT was performed using the RTVue-100 OCT (Optovue, Inc., Fremont, CA, USA) in the optic disc area (ONH protocols and 3D Disc) and macular area (GCC protocol) in tracking mode. RNFL was investigated in the ONH study protocol; three indices-avg GCC, FLV, and GLV were measured in the GCC protocol.
The choroidal thickness (CT) was investigated using the RTVue-100 OCT in tracking mode (Retina Cross Line protocol). CT was defined as a distance between the hyper reflective signal lines from the retinal pigment epithelium (RPE) to the continuous hyper eflective line on the sclera/choroid border. CT at the foveal center was obtained by averaging the results of measurement during vertical and horizontal scanning, a method that has been described in more detail previously.26 For statistical processing of the CT at the foveal center, 13 measuring points in the area of 6×6 mm were selected. In addition, a point located 3 mm nasal from the foveal center in the direction of the disc center, i.e. at a point as close as possible to the peripapillary zone (pCT), was used for analysis.
The thickness of the macular area and RNFL in sectors and microcirculation parameters were measured in the peripapillary and macular areas using spectral-domain optical coherence tomography (SD-OCT) by means of RtVue XR Avanti (Optovue Inc., Fremont, CA, USA) with AngioVue function (OCT-A). Two vascular plexuses were studied during OCT-A: a superficial plexus located between the inner limiting membrane (ILM) (3 μm below its surface) and inner plexiform layer (IPL) (15 μm below its surface); and a deep plexus located in the retina from 15 μm to 70 μm below the ILM (Figure 1).
Figure 1: Macular vascular density protocol (AngioVue Retina protocol, RtVue XR Avanti device with AngioVue function) of a healthy eye. Top row: vascular density map (left), macula map by sectors (middle): F: fovea, S: parafovea superior, N: parafovea nasalis, I: parafovea inferior, T: parafovea temporalis. All five sectors together constitute the Whole En Face parameter. The table on the right: upper table-parafoveal thickness from ILM to IPL; table in the middle-macular thickness from ILM to RPE and relative vessel density (flow density) at the fovea and parafovea; bottom table-relative vessel density by sector (grid-based flow density) on the entire scan. Studied areas of the superficial and deep vascular plexuses on the B-scan are shown at the bottom.
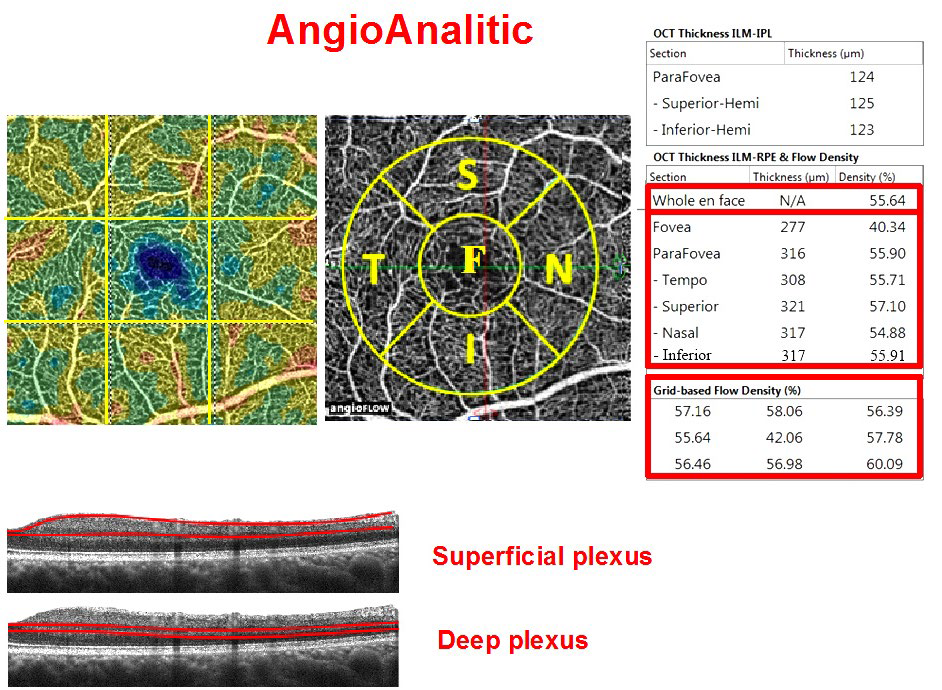
Two parameters were measured in the macular area: retinal thickness and relative vessel density of the retinal microvasculature-AFD Retina. AFD is the ratio of the area of the vessels in the test spot to the area of this spot (in %). Measurements were carried out in the foveal area (circumference with a diameter of 1 mm) and parafovea (in the area between the foveal border and a circumference 3 mm in diameter). The fovea and parafovea averaged value-AFD Retina Whole En Face–was measured as well.
Relative density of the ONH microvasculature (AFD Disc Whole En Face) was measured in ONH and peripapillary (750-μm-wide elliptical annulus extending from the optic disc boundary in the layer of 100 μm thickness from ILM), and only in the peripapillary area (peripapillary vessel density).
The method used for investigating blood flow velocity in retrobulbar vessels included gray-scale ultrasound, CDI and pulsed-wave doppler (PWD). The ultrasound examinations were performed with a VOLUSON 730 Pro-ultrasound system (GE Medical Systems Kretztechnik GmbH & Co OHG, Austria, Germany) and a SP 10-16 transducer. With the patient in supine position, sterile ophthalmic gel was applied as a coupling to the closed eyelid, and the probe was positioned gently with minimal pressure. The application of a gray-scale ultrasound enabled us to obtain the image of the globe and orbit. CDI was used to display the fine orbital vessels directly, including OA and its branches, CRA, the temporal and nasal PCAs, CRV, VV, and the superior ophthalmic vein (SOV). It was done according to the expected anatomical position of the vessels and its color code. The blood flow in the OA was evaluated at a depth of 35 mm. The CRA blood flow velocity was examined in the canal of optic nerve at the distance of 5-6 mm from the posterior wall of the globe. The PCAs were identified on either side of the optic nerve, about the same distance from the fundus as the CRA and CRV. By means of PWD we measured the blood flow spectrum of vessels and its main indices: peak systolic velocity (PSV), end-diastolic velocity (EDV), mean velocity (Vmean), resistive index (RI), and the pulsatility index (PI).
MOPP was calculated from IOP and BP measurements immediately before the OCT scanning and investigation of retrobulbar blood flow, after a 10-minute resting period in the sitting position. Systemic BP was measured using the Riva Rocci technique. MOPP was calculated using the formula:
MOPP = (2/3 diastolic BP + 1/3 systolic BP) × 2/3 – IOP.
Experimental Design
In all subjects an ophthalmologic examination was performed including determination of visual acuity, biomicroscopy, applanation tonometry, gonioscopy, pachymetry, measurement of axial length and anterior chamber depth, and imaging of the anterior segment of the eye using OCT. Patients were instructed to avoid caffeine intake, smoking and exercise for 5 hours prior to the study visit.
Statistical Analysis
In the study, we used the two-tailed Wilcoxon rank sum test (Wilcoxon-Mann-Whitney test). Parameters with p<0.05 were considered statistically significant. As a measure of the parameter importance in distinguishing the groups, we used the absolute standardized z-value of the Mann-Whitney test and AUC by applying a logistic model with the parameter as a sole predictor. We excluded such parameters as IOPcc, MD, and PSD from then non-parametric analysis of variance (Non-parametric ANOVA) because the increased IOP and perimetric indices were considered when arranging groups of patients with POAG.
Since a number of parameters (GCC, GLV, systolic and mean perfusion pressure, CT) depended on the anterior-posterior axis and the age of the subjects, we adjusted these parameters on the basis of the linear regression model. In order to examine the relationship between the characteristics, we used the Spearman correlation coefficient. Statistical analysis was performed using the SPSS version 21 and MASS library in R.
RESULTS
Structural and functional parameters differed significantly between the treatment groups (Table 1).
All OCT-A parameters differed significantly between the patient groups. The variability of the OCT-A parameters in glaucoma was significantly more pronounced than in the normal controls (Figure 2). The most significant difference between the patients with primary glaucoma and healthy individuals was the capillary density in the superficial and deep vascular plexuses in the macula. The difference between the early stage and the advanced stages of glaucoma was less pronounced (Figures 2 and 3). It should be noted that the retinal thickness in the patients with early glaucoma differed significantly from the retinal thickness in the healthy subjects only in the lower sector (Table 2).
Figure 2: Diagrams comparing blood flow parameters in glaucoma according to OCT-A data: relative vessel density in the superficial (A) and deep (B) vascular plexuses of the macula. For each of the diagrams: on the left is normal controls, in the middle is early glaucoma, on the right are the advanced stages of glaucoma.
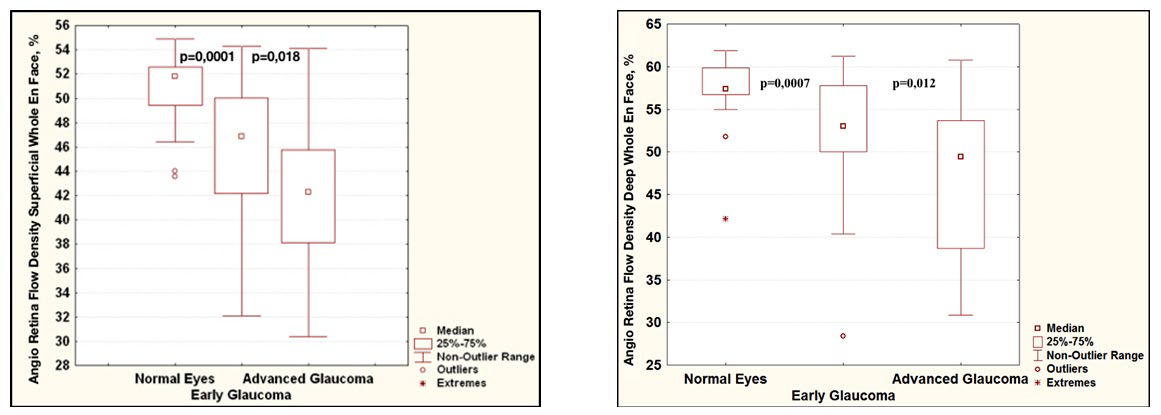
Table 2: Retinal thickness from ILM to RPE in various macular sectors in the normal controls and in glaucoma.
|
Parameter
|
Normal controls |
p-value* |
POAG I |
p-value** |
POAG II-III
|
| ILM-RPE thickness, μm |
Fovea
|
268.6 (13.3) |
0.489 |
266.4 (18.5) |
0.516 |
266.7 (35.0)
|
|
Parafovea
|
322.3 (21.1) |
0.112 |
309.5 (47.9) |
<0.001 |
298.4 (22.5)
|
|
-temporal sector
|
317.8 (22.9) |
0.075 |
308.7 (23.5) |
<0.001 |
287.1 (20.2)
|
|
-superior sector
|
324.9 (21.6) |
0.328 |
320.3 (23.2) |
0.001 |
304.3 (26.0)
|
|
-nasal sector
|
324.0 (20.8) |
0.313 |
313.8 (47.9) |
0.017 |
310.2 (29.2)
|
|
-inferior sector
|
322.6 (21.2) |
<0.001 |
240.8 (60.6) |
0.737 |
291.8 (18.9)
|
The data are median; standard deviation is given in parentheses.
*actual level of significance (p-value) between normal controls and POAG I
**p-value between POAG I and POAG II-III
Tables 3 and 4 demonstrate the results of comparison of the groups. The most significant indicators in distinguishing early glaucoma from the normal controls were parameters of the macular region: macular thickness in the inferior parafoveal sector and capillary density in the superficial and deep vascular plexuses (Table 3). The reduction in the capillary density in the peripapillary retina, as well as the structural indicators (RNFL, GCC, GLV), was of less significance as compared to the above parameters. From Table 3 it can be concluded that the OCT-A blood flow parameters were of higher diagnostic value than the parameters of retrobulbar blood flow. Because of the high correlation between the parameters from Table 3, for the differential diagnosis of early glaucoma from the normal controls we selected only those parameters that did not correlate (Table 3, given in bold). These two parameters demonstrated high sensitivity and specificity in early diagnosis of glaucoma, as can be seen from the ROC curves in Figure 4.
Figure 4: ROC curves for the Angio Retina Thickness ILM-RPE superficial inferior and Angio Retina Flow Density superficial Whole En Face.
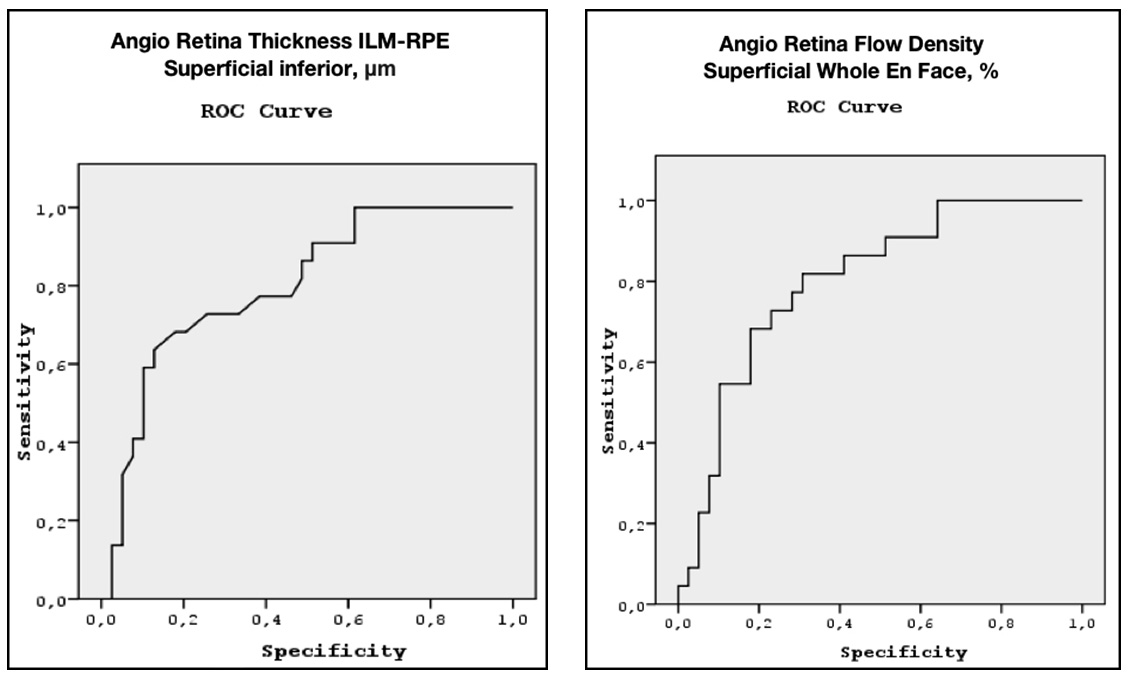
Table 3: The most significant parameters in distinguishing early glaucoma from the normal controls.
|
Parameter
|
z-value |
p-value |
AUC |
AUC LCL* |
AUC UCL**
|
|
AFD Retina Superficial Whole En Face
|
3.86 |
<0.0001 |
0.80 |
0.69 |
0.90 |
| Macula Thickness ILM-RPE parafovea inferior |
3.86 |
<0.0001 |
0.80 |
0.69 |
0.91
|
| AFD Retina Deep Whole En Face |
3.31
|
0.0007 |
0.756 |
0.636 |
0.875
|
| Peripapillary Vessel Density |
3.189
|
0.001 |
0.747 |
0.626 |
0.868
|
| avgGCC |
3.09
|
0.002 |
0.74 |
0.60 |
0.88
|
| RNFL |
2.85
|
0.004 |
0.72 |
0.59 |
0.85
|
| Temporal PCA, EDV |
2.78
|
0,005 |
0.72 |
0.58 |
0.86
|
| GLV |
-2.66
|
0.007 |
0.7 |
0.57 |
0.87
|
| CRV, EDV |
2.4
|
0.02 |
0.7 |
0.54 |
0.86 |
The most important parameters that allow distinguishing early glaucoma from normal controls are given in bold.
*lower confidence limit of 95% confidence interval for AUC
**upper confidence limit of 95% confidence interval for AUC
The most significant for the differential diagnosis of the stages of glaucoma were: the capillary density in the inferior peripapillary sector and mean blood flow velocity in CRA (Table 4).
Table 4: The most significant indicators for differentiation between early and advanced stages of glaucoma
|
Parameter
|
z-value |
p-value |
AUC |
AUC LCL* |
AUC UCL**
|
|
AFD Peripapillary Inferior Temporalis, %
|
5.61
|
<0.0001 |
0.94 |
0.86 |
1.0
|
|
CRA, Vmean, cm/sec
|
4.16 |
<0.0001 |
0.81 |
0.69 |
0.92
|
*lower confidence limit of 95% confidence interval for AUC
**upper confidence limit of 95% confidence interval for AUC
We revealed a high correlation between the capillary density in the inner layers of the macular area and peripapillary retina and the GCC parameters (Table 5).
Table 5: Correlation between the capillary density in the inner layers of the macular and the GCC parameters in early glaucoma.
|
Parameter
|
AFD Retina Superficial Parafovea |
AFD Retina Superficial Whole En Face
|
|
GCC
|
r=0.481
p=0.003 |
r=0.486
p=0.002 |
| GLV |
r=-0.505
p=0.001 |
r=-0.505
p=0.001
|
DISCUSSION
According to the results of the present study, the OCT-A parameters characterizing vascularity in the superficial and deep vascular plexuses of the macular area are of the highest value for the early diagnosis of glaucoma.
In the literature there are many indications that macular area is involved in the process already at the very beginning of glaucoma. In 1984, Heijl and Lundqvist studied 45 eyes of patients with glaucoma progression and performed perimetry at 5° , 10° , 15° , and 20° from the fixation point.9 It was then when “the surprising prevalence of defects” at 5° from the center was noted for the first time, particular in the superior hemisphere of visual field. Authors drew a conclusion that early and even initial glaucomatous damage of visual field occurred in the macula and also in the area of arcuate defect typical of glaucoma. However, the causes of this phenomenon still remain unclear.
D. Hood introduced the concept of “the macular vulnerability zone (MVZ)”—a zone of the macula that is the most vulnerable in glaucoma.14,15
The origin of this however is still not clear. MVZ is described as a part of the relatively thick RNFL accurate region in healthy controls, as well as a part of the inferior disc region showing the most damage in glaucoma. That is, the axons from retinal ganglion cells in the inferior macular retina enter the high-risk inferior accurate region of the disc. This general region of the disc has the highest incidence of disc hemorrhages. They are often associated with glaucomatous damage. In fact, Park et al27 observed that patients with damage within the central 10° on the 24-2 were more likely to have disc hemorrhages than those with comparable damage (nasal steps) outside the central 10° .
Besides, this MVZ is just adjacent to a major inferior temporal artery or vein. This association may have no import other than the fact that the thickest part of the RNFL is associated with the major blood vessels. However, it is worth noting that there are hypodense regions (holes or tunnels) in the RNFL of glaucoma patients and suspects.28 These hypodense regions are associated with visual field defects and may represent local axonal loss. Interestingly, they are almost always adjacent to a blood vessel.
It is still not entirely clear how these various findings are related, or which are most important in understanding the susceptibility of the inferior macular retinal ganglion cells to glaucomatous damage.
Thus, glaucomatous damage of the macula is common. It may appear at the early stage of the disease and may be not detected and/or underestimated when performing standard primary tests at the points located at a distance of 6° from each other. Besides the RNFL thinning in the accurate areas near ONH, the thinning of the inner macular layers can be seen already in suspected glaucoma, when the results of primary are classified as normal.
To our knowledge, previously no attempt has been made to evaluate the macular vasculature in glaucomatous eyes by means of OCT-A.
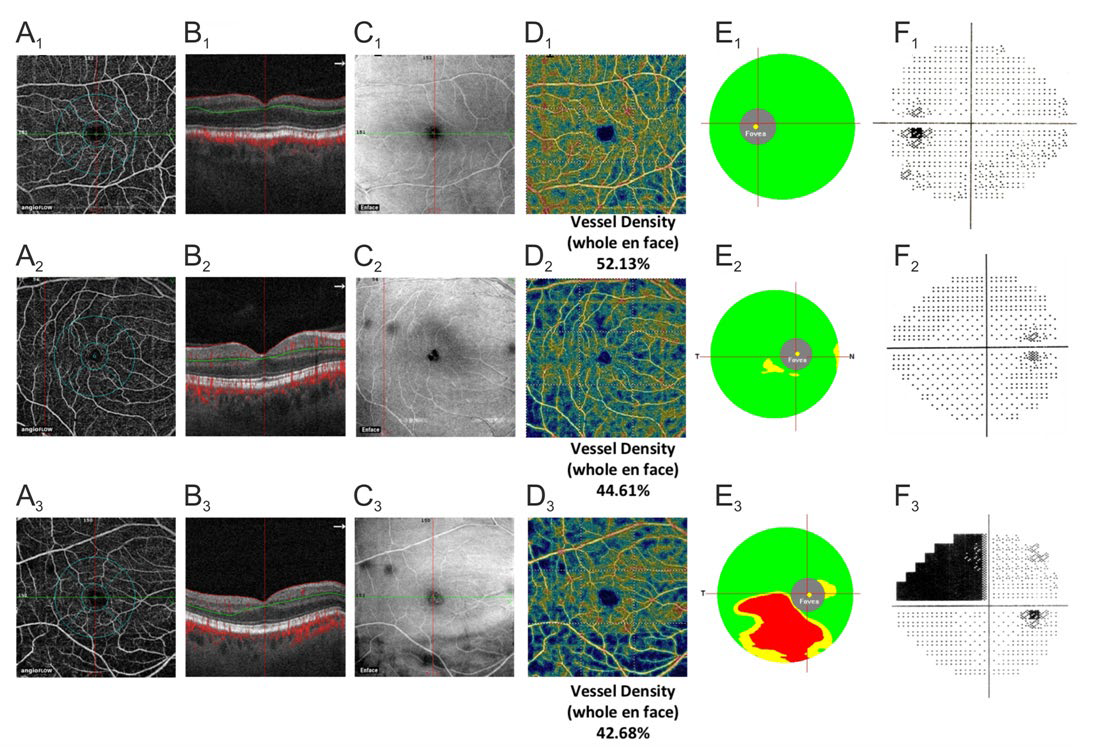
Our results showed that the parameters of vessel density were significantly reduced in glaucoma not only in the superficial plexus supplying the GCC layer (Figure 3) but also in the deep vascular plexus as compared with healthy individuals of a similar age. Our previous studies demonstrated a reduction in the foveal choroidal thickness in glaucoma; this was indirectly indicative of the perfusion worsening in the macula.26 However, OCT-A provided detailed information on blood supply to the inner layers of the retina in the macula and its outer layers due to the method’s ability to perform a segmental evaluation of the blood flow. It can be assumed that trophic deterioration in these layers explains the involvement of the macula in the pathological process at the very beginning of the disease.
Figure 3: Clinical examples of the normal eye (A1 -F1 ), early glaucoma (A2 -F2 ), and advanced glaucoma (A3 -F3 ). А1 -А3 : density map (AFD) of the microvasculature in the superficial plexus of the macula (3 μm below ILM to 15 μm below IPL). B1 -B3 : corresponding B-scans. C1 -C3 : corresponding En Face OCT images. D1 -D3 : color maps of the macular superficial plexus density. E1 -E3 : GCC color maps. F1 -F3 : SAP data.
The most valuable criteria for the diagnosis of glaucoma have been searched forover the years. The importance of a combination of the structural and functional changes in the early diagnosis and monitoring of glaucoma has been repeatedly emphasized in the literature.29-32
For the same purpose we performed a comparative analysis of the structural and circulatory parameters in our recent studies and revealed a high diagnostic value of the retrobulbar blood flow parameters in the early diagnosis of glaucoma.33 In the present study, along with the analyzed parameters, we for the first time studied the parameters of the ONH microcirculation, peripapillary retina and macula obtained by OCT-A. The OCT-A method is based on measuring the degree of the amplitude decorrelation (difference) at a certain point of the optical B-scan when obtaining multiple consecutive B-scans (splitspectrum amplitude-decorrelation angiography-SSADA). OCTA is aimed at the selection of blood vessels from the surrounding tissue through the entire scanning depth without any contrast agents.34
The retina has three levels of blood supply (plexuses): radial peripapillary capillary plexus, superficial and deep plexuses.35 All three of these vascular plexuses provide blood supply to the inner half of the retina, while the outer half of the retina receives blood supply from choriocapillaries. The main role in the supply to the RNFL is played by capillaries of the radial superficial peripapillary plexus, and to the retinal ganglion cellsby blood vessels of the superficial plexus. By means of OCT-A, Savastano et al24 described localization of the superficial plexus at the GCC level and deep plexus in the outer plexiform layer.In the present study, we applied OCT-A to study the hemoperfusion of all the three plexuses in glaucoma.
In the literature, data on the use of OCT-A in glaucoma are scarce and limited to the results of the ONH and peripapillary retina study.19-25 For example, Jia et al19 studied the percentage area occupied by vessels (vessel density) in the optic disc and revealed that preperimetric glaucoma (PPG) patients had significant reductions of ONH perfusion compared to normal: the vessel density was reduced by 34% in the PPG group (p<0.05) with the repeatability 6.2%. The authors concluded
that OCT angiography could detect the abnormalities of ONH perfusion and reveal the ONH blood flow mechanism related to glaucoma. Liu et al20 also revealed a significant decrease in the peripapillary vessel density in patients with glaucoma as compared with healthy subjects of similar age. In the authors’ opinion, this parameter was of high diagnostic value for early detection of glaucoma. The possible role of OCT-A in glaucoma monitoring was demonstrated in the recent studies by Wang et al21,22 and Lévêque et al.23 The authors found a significant decrease in the ONH vessel density in advanced glaucoma patients as compared with healthy subjects, as well as its correlation with MD, RNFL, and GCC thickness, but only in POAG and not in the normal controls. According to Lévêque et al,23 the temporal sector of ONH is a critical study region for monitoring progression of glaucoma patients. The authors concluded that reductions in ONH blood flow detectable by OCT angiography might precede detectable visual field damage, hence, the vessel density of ONH had the power to differentiate normal eyes from eyes with POAG. It is important to note that in the mentioned studies glaucoma subjects had not stopped taking hypotensive eye drops before the examination although it is known that they may influence on ocular blood flow.
The present study demonstrates that the OCT-A has a diagnostic value in determination of the macular vascular density for the early glaucoma detection. This parameter exceeds the diagnostic value of peripapillary vessel density and RNFL thickness in the logistic model (Table 3). On the other hand, the vessel density in the peripapillary inferior temporal region had the highest diagnostic value for differentiation between the early and advanced stages of glaucoma (Table 4). One could speculate that the reduction of vascular density in the inner macula may precede the loss of ganglion cells and their axons. Moreover, it can be an example of the inter individual variation of vascularity that has been described by Hayreh S.36 During his research in 100 human specimens, he did not find two identical patterns even in two eyes of the same person. Blood supply to the macula is derived from the choroid, which capillary network takes its origin from the PCA. It is evident that it is only the PCA circulation in the ONH that is relevant to the various ischemic disorders of the ONH and may be of high relevance in glaucoma. When the tissue is supplied by two or more end-arteries, the border between the distribution areas of any two end-arteries is called a “watershed zone”. The significance of the watershed zones is that in the event of a fall in the perfusion pressure in the vascular bed of one or more of the end-arteries, the watershed zone, being an area of comparatively poor vascularity, is the most vulnerable to ischemia. Fluorescein fundus angiographic studies performed by Hayreh S. both in healthy and glaucoma patients have clearly shown that the PCAs and their subdivisions were end-arteries, right down to the choroidal arterioles. Thus, there are watershed zones between the distributions of the various PCAs. Hayreh S37emphasized that location of the watershed zone in relation to the ONH was the key to any discussion of ischemic disorders of the ONH. There is marked inter individual variation in the number and pattern of supply by the PCAs-the main source of blood supply to the ONH. Therefore, the pattern of distribution by the PCAs in the choroid and ONH is extremely variable.38
In this regard, OCT-A might become an important method for the individual evaluation of the capillary density in retinal tissue. According to the results of our study, the investigation of the vessel density in the superficial and deep vascular plexuses of the macular area might be of high priority for the glaucoma diagnosis and monitoring. The obtained highly significant correlation of the macular vascularity with the GCC structural characteristics (Table 5) agrees with the established fact: GLV has been as well recognized as one of the important diagnostic parameters in differentiating early glaucoma from the normal controls.39
Several limitations must to be considered when discussing the results of the present study. The first limitation is a relatively low number of patients. We used a non-parametric Wilcoxon-Mann-Whitney test to discover the difference between the groups because some variables have skewed distributions. Therefore, our results need to be confirmed in larger patient populations.
The limitations of the OCT angiography also should be considered when interpreting the results. They are: the influence of motion artifacts, shadowing effects, the difficulties of the localization of changes and the quantification of blood flow. The wavelength dependence is still present in OCT angiography. Besides OCT angiography cannot distinguish between perfusion reduction caused by tissue loss (a result of glaucoma) and ischemia (a cause of glaucoma). However, the OCT structural images can measure tissue loss. Thus, structural imagery and perfusion measurements could provide complementary information for both clinical assessment and pathophysiological investigation.
Careful attention should be paid to the interpretation of the CDI data as the subjective aspects of the CDI measurements have been pointed out in literature.40Harris et al41 initially found that reproducibility was good in the CRA and OA, but had a higher variability in short PCA; the reproducibility of the CDI parameters in VV was not evaluated. Generally, data obtained in CRV is considered to be less reproducible. While CDI is highly examiner-dependent, the examiner was not blinded to the patients/subjects in present study. The fact that the examiner was not masked to the diagnosis is the limitation of the present study.
The next limitation is the IOP data. After drug washout period, IOP was significantly higher in glaucomatous eyes compared to normal controls, as demonstrated in the Table 1. This could affect the ocular blood flow parameters. However, we have not revealed any correlation between IOP and the parameters of microcirculation measured by OCT-A or CDI in glaucoma and the normal subjects.
CONCLUSIONS
The present study revealed the significance of OCT-A for the early diagnosis of glaucoma and the priority of the investigation of the macular microcirculation and its thickness in the inferior sector. These results allow understanding the cause of the early involvement of the macular inner layers in the pathological process in glaucoma.
ACKNOWLEDGMENT
The author thanks Dr. Ekaterina Maslova and Dr. Anna Trubilina for their generous and valuable assistance in examining of the patients and collecting scientific data.


