Radiology

Open journal

ISSN 2473-0947

Recent Developments in Diffusion Tensor Imaging of Brain

Mansi Bharat Parekh, Abhijit Achyut Gurjarpadhye, Martin A.C. Manoukian, Arita Dubnika, Jayakumar Rajadas and Mohammed Inayathullah*

Mohammed Inayathullah, PhD

Radiology-Molecular Imaging Program at Standford (MIPS), Biomaterials and Advanced Drug Delivery (BioADD) Laboratory, Cardiovascular Pharmacology, Cardiovascular Institute, Stanford University School of Medicine, 1050 Arastradero Road, Building A, Room A163, Palo Alto, California, 94304, USA; Tel. 650-724-7710; Fax: 650-721-4651; E-mail: inayath@stanford.edu

INTRODUCTION

Diffusion Weighted Imaging (DWI) is a powerful Magnetic Resonance Imaging (MRI) technique from a clinical standpoint, as the inherent rate of diffusion within various regions of the body can be measured. Stejskal and Tanner1 first described the technique to measure water diffusion with Nuclear Magnetic Resonance (NMR) in 1965. Water molecules in the body encounter physical boundaries that impede their random displacement, i.e. molecules can hit a barrier and bounce back within the given diffusion time of the experiment. Thus, the resultant signal may be higher than if the sample were under the same conditions but without barriers resulting in lower rates of diffusion than actuality.

DWI provides a powerful diagnostic tool as different diseases and disease states result in differential imbalances in local water content and diffusivity rates. Diffusion in the central nervous system may not be isotropic i.e. diffusion is not the same in all directions. Diffusion in white matter tracts is preferential in the direction of the fibers and very small perpendicular to the fiber. Thus white matter bundles within the brain exhibit high degrees of anisotropy within a given voxel. Signal intensity, in diffusion-weighted images of white matter, changes depending on the direction of the applied diffusion gradient, due to the preferential direction of diffusion within the fibers, thus offering a means of determining fiber orientation. Multiple DWI images acquired by applying differential pulses in different diffusion-sensitizing gradient directions can be fit to an apparent diffusion tensor model (Diffusion Tensor Imaging, (DTI)) which allows for the quantification of Mean Diffusivity (MD) and the anisotropy of water diffusion (Fractional Anisotropy, (FA)). For a rank-2 tensor fit, the diffusion tensor corresponds to a 3×3 square matrix in which the diagonal elements represent eigenvalues (λ1, λ2, and λ3) corresponding to effective diffusion along the x, y and z axes,2 while the off-diagonal elements represent correlations of the diffusivity between the three orthogonal axes. Each eigenvalue has an associated eigenvector, which defines the orientation of effective diffusion.

EQ-1-ROJ-1-101

For regions with isotropic diffusion such as voxels with freely diffusing Cerebro-Spinal Fluid (CSF), the three eigenvalues have similar values. For regions with high anisotropy, such as white matter voxels, the eigenvalue in one direction is much greater than the magnitude in the other two directions (Figure 1). As diffusivity is higher along the length of the white matter, the primary eigenvector is representative of the average orientation of fibers within the voxel. In fact, this sensitivity, providing diffusion summary measures and tissue fiber orientation, has made DTI widely used as a clinical tool, especially in conditions where abnormalities in WM are expected and in healthy conditions.3,4


Figure 1: Diffusion Tensor Imaging. λ1, λ2 and λ3 are the Principle Eigenvalues from the 3×3 matrix.

Diffusion Tensor Imaging

Due to the tortuosity of various cell bodies and the extracellular matrix in grey matter regions, the values
of λ1, λ2 and λ3 are similar thus resulting in low FA values (A and C, top right inset). Due to the parallel arrangement of axons
in white matter bundles, the value of λ1is usually much higher than λ2 or λ3, thus leading to higher FA values (B and C, top left inset).


APPLICATIONS OF DTI OF BRAIN

Applications for Understanding Normal Neuronal Connectivity

Development of innovative and non-invasive methods for mapping brain connectivity at cellular and systems scale allow the acquisition of comprehensive whole-brain data sets from individual human subjects and their comparison with individual data on brain dynamics, cognition, behavior, and genetics. Information on the structural connectivity of human brain – human connectome, is fundamental for the formulation of mechanistic models of the network processes underlying human brain function.5 DTI can provide insight into plastic/reactive changes in the microstructure and connectivity of white matter. In the human brain axons connect about 100 billion neurons and carry signals to, from, and within the brain and are the key factors that are studied on brain network connectivity.6 The rate at which water molecules diffuse in the brain along a particular direction (the apparent diffusion co-efficient) can be measured in vivo by applying a diffusion sensitizing gradient in the direction of interest.7

By applying an orientation density function-based tractography method Hagmann et al measured the neuroconnectivity strength based on the number of fiber between any two brain regions.8 Gong et al utilized diffusion tensor imaging deterministic tractography to construct the popularity-based anatomical network capturing the underlying connectivity pattern of human cerebral cortex in 80 young adults, comprising a streamline-like tractography method and statistics-based nonparametric sign test.9 Bonilha et al have also shown that connectome mapping using DTI is reproducible (Figure 2).10 In these studies network modeling was carried out considering that the brain network is a binary network ignoring the connectivity strength information among different brain regions.8,9 To find the most probable trajectory between any two nodes Iturria-Medina et al used an iterative algorithm and applied anatomical connection probabilities to measure the connectivity strength between 90 cortical and subcortical brain gray matter areas.11 Li et al extend the algorithm and model of the connectivity between different anatomical regions by performing tensor-based fast marching method, using the whole tensor field rather than just the principal directions.6 But the newest connectome studies implement Brain X3 a virtual reality simulation cum data mining platform that is used to visualize, analyze and extract neuroscience data.12 


Figure 2: This figure demonstrates each connectome link represented by a line corresponding to the center of
mass of the bundle of fibers associated with that link (estimated from deterministic tractography using DTI).


This figure demonstrates each connectome link represented by a line corresponding to the center of mass of the bundle of fibers associated with that link


Each link is color-coded based on its reproducibility per tractography approach and scanner usage. The color bars indicate the link-wise Intraclass Correlation Co-efficient showing that connectome mapping is largely reproducible using DTI. Reprinted from Bonilha et al.10


 Neuro-Degenerative and Neurological Disorders 

Alzheimer’s disease (AD): AD is the most common type of neurodegenerative dementia in aging population.13 Early diagnosis is important for identifying candidate patients for the emerging therapies.14 AD is characterized by loss of neurons, presence of senile plaques and neurofibrillary tangles that are found in the some neuroanatomical structures in the early course of the disease.15 Anatomical MRI is used as a structural neuroimaging method for most of the AD studies and clinical trials; however DTI is a sensitive method to study microscopic White Matter (WM) changes that are not detectable with conventional MRI. DTI has been used for detecting regional WM alterations in AD followed by Gray Matter (GM) in the disease progression, which indicates that the cortical abnormalities are greater in posterior regions relative to anterior regions at the early stages of AD.16,17 Several researchers have studied the loss of WM integrity in early AD18,19,20 and in early Familial-AD (FAD).21 Regional DTI has been shown to distinguish AD, Mild Cognitive Impairment (MCI) and normal aging20,22,23,24,25 (Figure 3). DTI is being viewed as a crucial tool for AD diagnosis in recent years and has the potential to be used as a biomarker through analysis of various diffusion tensor metrics.26,27 


Figure 3: Tractography demonstrations of ROI from fMRI data for (A), short-range fiber tracts, and for (B),
long-range fiber tracts.(C), The MD, FA of short-range fiber tracts, long-range fiber tracts in three groups.


Tractography demonstrations of ROI from fMRI data

Both MD and FA are useful in identifying differences between AD patients and normal (young and old). Reprinted from Gao et al.25


Epilepsy: Spontaneous seizures that result in epilepsy may arise from synchronous firing of neurons from one region or a network of regions from various parts of the brain, which may be difficult to clinically isolate the seizure focus using traditional clinical modalities. DTI has proven fruitful in accomplishing this. Measurements in cerebral structural abnormalities and epilepsies, using DTI have shown significant changes in the mean rate of diffusion and the anisotropy of water motion.28,29,30,31,32 The MD and FA which are invariant to image orientation were used to quantify aspects of water diffusion observed in cerebral tissue. These measures provide results similar to “stains” used in histological studies,33,34 but allow them to be measured in intact tissue. Studies performed on experimentally induced SE showed reductions in ADC values in limbic as well as extra-limbic structures.35,36,37 This decrease in ADC has been attributed to cytotoxic edema as excessive excitation leads to massive influx of sodium, chloride and calcium ions into the cells, leading to a net flow of water from the extra- to intracellular compartments, leading to an overall reduction in ADC.38 Similar reductions in ADC, on the side of seizure focus deduced using Electro-encephalogram (EEG), have been observed in patients after prolonged seizures.39 In focal epileptic regions, the mean rate of diffusion often increases and the anisotropy consistently decreases, reflecting neuronal loss, gliosis and structural disorganization.

A chronic elevation of diffusion rate is observed in Temporal Lobe Epilepsy (TLE) patients with hippocampal sclerosis, which has been attributed to neuronal necrosis, gliosis, and expanded extracellular space.40 Using DTI, increased diffusion rate and a decreased diffusion anisotropy in the epileptic focus, compared to the contralateral region, was observed by Assaf et al41 in patients with TLE. Similar studies using DTI have reported a reduction in diffusion anisotropy in the ipsilateral parahippocampal gyrus and fornix,32,42 and also in extra-temporal white matter,42 such as the internal capsule,43 the external capsule,44 the genu43 and the splenium44 of the corpus callosum (Figure 4). The reduction in diffusion anisotropy has been suggested to result from a loss of ordered structure, myelin degradation and lowered cell density.32,43,45 Fiber tract maps generated from DTI measurements have also shown a reduction in tract volume of the fornix both pre46 and post47 resective surgery of the epileptogenic focus, as well as an increase in diffusion rate and a decrease in diffusion anisotropy in patients with unilateral TLE. Due to the ability of DTI to identify the epileptogenic focus, it has been utilized in surgical planning for the removal of the focus.48,49 


Figure 4: FA and volume alterations of the hippocampus and thalamus in patients with unilateral TLEhs relative to controls.


FA and volume alterations of the hippocampus and thalamus in patients with unilateral TLEhs relative to controls


The top row indicates mean (with 95% CI) FA (left) and volume (right) of the left and right hippocampus across controls (C), patients with left TLEhs (L) and patients with right TLEhs (R). The bottom row is the same for the thalamus. Structures are colour-coded: light blue for FA, yellow for hippocampal volume (as per standard Free Surfercolour classification) and dark green for thalamic volume (as per standard Free Surfercolour classification). FA values are the mean for each (corrected). ** = significant at p<0.01 (corrected). *** = significant at p>0.001 (corrected). Reprinted from Keller et al.42


Multiple sclerosis (MS): MS is one of the most common neurodegenerative inflammatory diseases of the central nervous system, characterized by demyelination and axonal loss. The disease manifests through symptoms such as overall physical disability, imbalance of gait, sensory disturbance and cognitive dysfunction, the factor causing this disease are unknown.50,51 MRI imaging plays an important role in early diagnosis of MS and in monitoring treatment efficacy; however, the technique shows low pathological specificity and low sensitivity to diffuse damage in Normal-Appearing White Matter (NAWM) and Normal-Appearing Gray Matter (NAGM).52 In the recent years, DTI has proven to be an effective tool for detecting demyelination and tissue damage quantitatively.53 Most commonly used DTI metrics, MD and FA measure overall water motion without any directionality, and the prevalence of diffusivity along one direction, respectively.54 However, interpretation of these metrics for diagnosing specific pathologies in patients with MS is very complex. Several studies have been conducted to identify and establish correlation between pathophysiological conditions of specific anatomy and abnormalities in the MD and FA values.55,56 Overall, the FA value, as it indicates the anisotropy of water diffusion along a specific direction, could serve as a reliable marker for estimating presence of plaques, lesions or overall microstructural changes in with the NAWM.57 Additionally, Commowick et al suggested that instead of only replying on these scalar metrics such as MD and FA, demonstrated a framework that utilizes the whole diffusion tensor information to also in detect pathologies in the regions around existing legions, which allows an early detection of an extension of MS.58

Traumatic brain injury (TBI): Another important neurological disorder, TBI, affects 1.7 million people in the United States annually59 and the clinical symptoms from TBI range from mild cognitive impairment to severe disability and neuroimaging plays a critical role in determining the course of therapy. Depending on the severity of the TBI, conventional MRI may or may not show abnormalities. In order to better diagnose cases of mild TBI (mTBI) (e.g. concussions), advanced neuroimaging techniques are being sought out. DTI is a potentially powerful research tool for investigating white matter pathology across a broad spectrum including mTBI. Various ROI-based studies have shown that DTI is sensitive in detecting group differences when comparing mTBI patients with healthy controls and suggest that DTI is sensitive to white matter changes60,61,62,63,64 (Figure 5). Certain studies, such as by Miles et al have assessed the predictive value of DTI in determining cognitive function months after mTBI.65 The observations from these various studies suggest that DTI is sensitive to white matter pathology following TBI, but all studies revealed substantial inter-individual differences in white matter integrity even among healthy controls.61 These findings suggest that the specificity of such DTI abnormalities to mTBI is limited and illustrate well the problem of applying this technique to the examination of individual subjects and using DTI for any predictive value for future neurocognitive and neuropsychological changes.


Figure 5: Fractional anisotropy (FA) and mean diffusivity (MD) in mild traumatic brain injury.


Fractional anisotropy (FA) and mean diffusivity (MD) in mild traumatic brain injury


FA values are lower (red; P<0.08 – TFCE corrected) in mild traumatic brain injured patients compared to healthy
control subjects and MD values are higher MD (blue; P<0.07- TFCE corrected). Reprinted from Metting et al.64


Stroke: DTI can be used to evaluate damage in patients who have suffered an ischemic stroke due to the effects that the stroke has on the movement of fluids within the brain. DTI measurements have shown that FA within the white matter of the brain is significantly lower on the side of the brain that suffers an infraction when compared to the side of the brain that has not.66,67 Thus, by looking at a complete map of FA within the brain of a patient that is suspected of having suffered a stroke, a physician is able to tell whether or not the stroke occurred, and if so, would be able to localize its point of action. It is important to note that DTI can detect the occurrence of a stroke much quicker after its occurrence than can conventional MRI imaging. Alterations in the diffusion characteristics resulting from an ischemic event can be detected within hours of the event’s occurrence using DTI, whereas it could take days for the same stroke to be detectable by conventional MRI,68 This makes DTI an indispensable tool in the diagnosis of ischemic strokes, as a quicker diagnosis can lead to a quicker physician response time, which has tremendous impacts on long term patient outcomes.

In addition to identifying the area of the brain impacted by an ischemic stroke, DTI can also be used to identify areas of the brain and spinal tract distal to the location of the stroke that are also affected. The break-down of myelin sheaths and disintegration of axonal microfilaments of neurons downstream of the site of the stroke, also known as Wallerian degeneration, can be detected due to its negative anisotropic effects. Though capable of detection rapidly via DTI, Wallerian degeneration is difficult to identify with conventional MR imaging techniques for many weeks after the occurrence of the stroke.69,70 It is therefore advisable that physicians thoroughly examine stroke patients using DTI techniques to find areas that are affected by Wallerian degeneration, thereby increasing the chances of discovery, treatment, and that the patient has an improved recovery process. 

Edema 

Cytotoxic edema: Cytotoxic edema results from a decrease in the function of the Adenosine tri-phosphate (ATP)-dependent sodium/potassium pumps (Na+/K+ ATPases) located on the surface of cells within the brain. This decrease in Na+/K+ ATPase activity is caused by oxygen deprivation that prevents oxidative phosphorylation from occurring, and thereby inhibiting ATP production. Hypoxemia can be caused by such events as a stroke, hemorrhage, or embolism. Although the mitochondria of the brain have mechanisms in place to cope with hypoxemia, such as pathways that include hypoxia-inducible factor 1 and succinate dehydrogenase, these mechanisms can only do so much before ATP levels drop to pathological levels.71 Once ATP levels fall, the Na+/K+ ATPases lose the capacity to translocate sodium out of the cell, leading to the buildup of intracellular sodium levels. This sodium buildup causes the creation of an osmotic gradient that promotes the diffusion of water into the cell, leading to a rapid and intense increase in intracellular volume. Cytotoxic edema has been shown to affect both the white and the grey matter of the brain, causing generalized swelling and widespread damage.72 The accumulation of water molecules within the intracellular spaces severely impedes their ability to flow freely. Though water molecules can diffuse through the plasma membranes of the cells, doing so greatly slows their velocity, leading to a net decrease in diffusivity within the area of the brain affected by the cytotoxic edema. When imaged with different modalities, cytotoxic edema presents as a decrease in attenuation via Computed Tomography (CT) scan, hyperintensity via MRI, and a decreased diffusivity by DTI. Though the readings from CT and MR imaging are found in all cases of edema, it is only DTI which is able to differentiate between subtypes of edema, and assist with the definite diagnosis of cytotoxic edema. Using this phenomenon DTI detection of cytotoxic edema can be used as an early warning for acute stroke, acute diffuse axonal injury, and acute contusion.73,74 

Vasogenic edema: Vasogenic edema results from a breakdown of the blood brain barrier that can be caused by local factors such as neoplasm or traumatic brain injury, or from chronic damage caused by lead encephalopathy or malignant hypertension.73 Thus, vasogenic edema is an extracellular accumulation of fluid, as opposed to the intracellular accumulation seen in cytotoxic edema. Vasogenic edema presentation mimics cytotoxic edema when using CT and MRI imaging, in that both present with decreased attenuation via CT and hyperintensity via MRI. However, when using DTI, vasogenic edema presents with an increased diffusivity, as opposed to the decreased diffusivity shown by cytotoxic edema.73,75 This is because the water molecules within the extracellular space can move more freely than the water molecules that are confined within the intracellular space by plasma membranes. Thus, it is important to note that DTI is able to differentiate cytotoxic edema from vasogenic edema, whereas CT and conventional MRI cannot.

It is important that the physician is able to differentiate whether the patient is suffering from cytotoxic edema, vasogenic edema, or a combination of the two76 (Figure 6) so that the correct intervention can be applied as necessary. However, it is often the case that cytotoxic and vasogenic edema occur in parallel.77 For example, following an ischemic attack, cytotoxic edema occurs immediately due to local hypoxmia and a slow-down of the Na+/K+ ATPase pumps. Following the initial intracellular fluid accumulation, blood brain barrier breakdown occurs, leading to concurrent vasogenic edema.78 Though cytotoxic edema does not currently have a widely accepted therapy, vasogenic edema is generally treated with corticosteroids, particularly when associated with neoplasms, and to a lesser extent when associated with abscesses. In cases where it is not responsive to corticosteroids, vasogenic edema can also be treated with osmotherapy.72


Figure 6: Connectivity of Default-Mode Network Is Associated with Cerebral Edema in Hepatic Encephalopathy.


Connectivity of Default-Mode Network Is Associated with Cerebral Edema in Hepatic Encephalopathy


Differences of default model network between health subjects and liver cirrhosis and their corresponding MD and FA values. There were three biggest cluster areas in the PCC functional connectivity map, including the left precuneus, right ACC and left middle frontal cortex (MFC). MANCOVA revealed significant fc-CC [F = 4.415, p = 0.000] and MD [F = 3.944, p = 0.000] differences among the four groups, but not in FA [F = 0.859, p = 0.063]. Reprinted from Lin et al.76


LIMITATIONS OF DTI 

Despite a plethora of studies having employed DTI to study normal and abnormal brain integrity, the acquisition and approaches of DTI analyses have been quite variable. Though the connectome project is making great strides in the right direction, no common frame of reference for the comparison of findings between studies. For example, some studies use ADC as a measure of white matter integrity while others use FA. Additionally others use radial diffusivity and axial integrity to help determine the contribution of various types of pathologies. While some studies use ROI-based analyses to test specific anatomic hypotheses, some studies employ hypothesis-free analyses of the whole brain and apply one of the several methods of correction for multiple unplanned comparisons to identify significant findings. One of the main technical issues is the lack of a large normative database. Normative databases are needed to interpret individual (i.e. single subject or single patient) FA, ADC, or other values for clinical purposes. In the absence of normative databases of these sorts, each institution at which DTI is performed is left to develop and employ their own normative data when attempting to interpret group or single-subject DTI data. The size and normality of subjects included in these databases is highly variable between institutions, rendering the interpretation of any individual DTI result as normal or abnormal based on comparison to local normative data preliminary at best.

The DTI literature available is affected by the heterogeneity of injury captured under the various disorders; heterogeneity in the time after injury at which persons have been studied with DTI; and the lack of a standard, accepted method for acquiring, analyzing, and interpreting DTI data. In light of these limitations, there is need to create a large normative database for DTI to be utilized at its potential.

CONCLUSIONS AND FUTURE POTENTIALS

DTI, as we discussed in this review has proved to be an important tool for diagnosing various pathologies of the brain. In addition to brain imaging, DTI is being actively developed for diagnosis of spinal cord pathologies,79,80,81 and optics nerve damage.82,83 Additionally, while DTI in infants and toddlers is challenging, the technique shows great potential for understanding and mapping brain development. Technological improvements in MR imaging could soon allow researchers to gather artifact-free data more reliably, which could significantly aid in understanding brain development in infants and toddlers. Biomarkers could be created for prediction and early detection of neurodegenerative disorders, which will allow researchers to develop better therapeutic approaches and surgeons to design better treatment strategies. While it may seem too ambitious, set of normal FA and MD values could be derived by conducting DTI of larger population – in a similar way that “normal” blood pressure values of 120/80 mm Hg were determined. We acknowledge, however that such task also requires standardization of imaging, post-processing and data analysis procedures as these factor may affect the quantification of DTI parameters. In summary, DTI modality shows an enormous potential to be a versatile tool for biomedical research and clinical applications. 

CONFLICTS OF INTEREST

The authors declare that they have no conflicts of interest. 

ACKNOWLEDGEMENTS

Dr. Michael Zeineh of the Stanford Department of Radiology provided Figure 1. The project described was supported by the National Center for Research Resources and the National Center for Advocacy Translational Sciences, National Institutes of Health, through UL1 TR000093 (formerly UL1 RR025744) and SPARK, Spectrum – the Stanford Center for Clinical and Translational Research and Education; the Stanford NIH/NCCR Clinical Translational Science Award grant number TL1 RR025742, and author AD was supported by the Baltic-American Freedom Foundation.

1. Stejskal EO, Tanner JE. Spin diffusion measurements: spin echoes in the presence of a time-dependent field gradient. Journal of Chemical Physics. 1965; 42(1): 288-292. doi: 10.1063/1.1695690

2. Basser PJ, Mattiello J, Lebihan D. MR diffusion tensor spectroscopy and imaging. Biophys J. 1994; 66(1): 259-267. doi: 10.1016/S0006-3495(94)80775-1

3. Thomason ME, Thompson PM. Diffusion imaging, white matter, and psychopathology. Annu Rev Clin Psychol. 2011; 7: 63-85. doi: 10.1146/annurev-clinpsy-032210-104507

4. Mori S, Zhang J. Principles of diffusion tensor imaging and its applications to basic neuroscience research. Neuron. 2006; 51(5): 527-539. doi: 10.1016/j.neuron.2006.08.012

5. Sporns O. The human connectome: a complex network. Ann N Y Acad Sci. 2011; 1224: 109-125. doi: 10.1111/j.1749-6632.2010.05888.x

6. Li H, Xue Z, Cui K, Wong ST. Diffusion tensor-based fast marching for modeling human brain connectivity network. Comput Med Imaging Graph. 2011; 35(3): 167-178. doi: 10.1016/j.compmedimag.2010.07.008

7. Steel RM, Bastin ME, Mcconnell S, et al. Diffusion tensor imaging (DTI) and proton magnetic resonance spectroscopy (1H MRS) in schizophrenic subjects and normal controls. Psychiatry Res. 2001; 106(3): 161-170. doi: 10.1016/j.compmedimag.2010.07.008

8. Hagmann P, Kurant M, Gigandet X, et al. Mapping human whole-brain structural networks with diffusion MRI. PLoS One. 2007; 2(7): e597. doi: 10.1371/journal.pone.0000597

9. Gong GL, He Y, Concha L, et al. Mapping anatomical connectivity patterns of human cerebral cortex using in vivo diffusion tensor imaging tractography. Cerebral Cortex. 2009; 19(3): 524-536. doi: 10.1093/cercor/bhn102

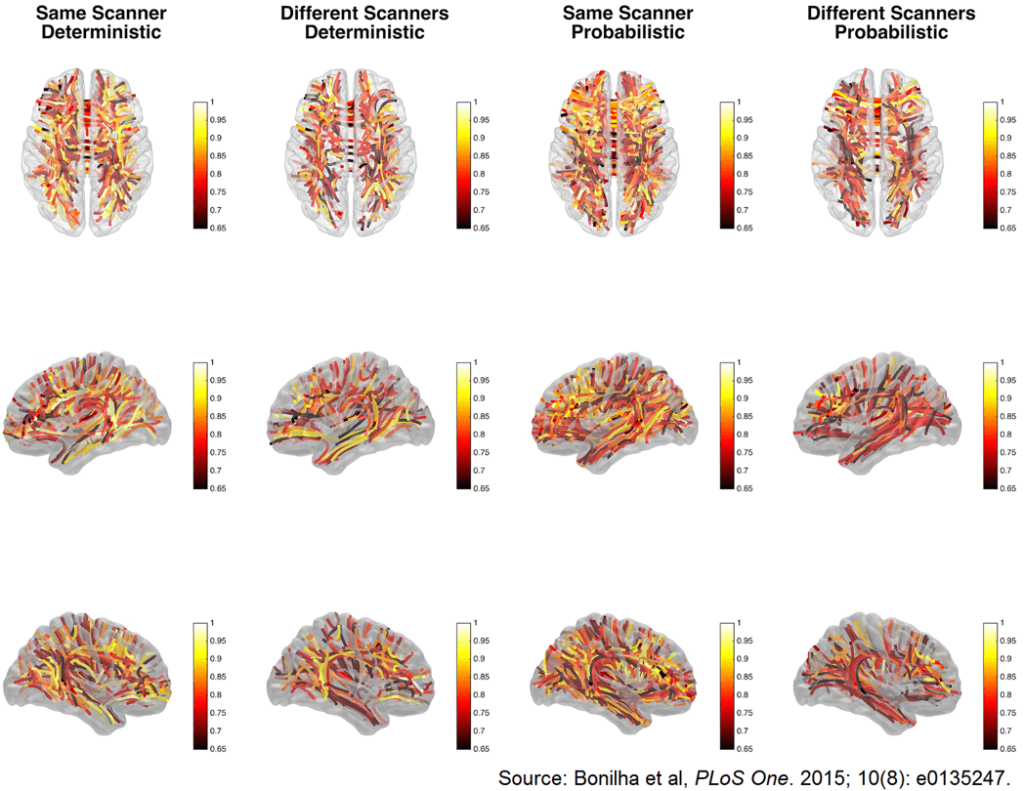
10. Bonilha L, Gleichgerrcht E, Fridriksson J, et al. Reproducibility of the structural brain connectome derived from diffusion tensor imaging. PLoS One. 2015; 10(8): e0135247. doi: 10.1371/journal.pone.0135247

11. Iturria-Medina Y, Sotero RC, Canales-Rodriguez EJ, Aleman-Gomez Y, Melie-Garcia L. Studying the human brain anatomical network via diffusion-weighted MRI and Graph Theory. Neuroimage. 2008; 40(3): 1064-1076. doi: 10.1016/j.neuroimage.2007.10.060

12. Arsiwalla XD, Dalmazzo D, Zucca R, et al. Connectomics to semantomics: addressing the brain’s big data challenge. Inns Conference on Big Data 2015 Program. 2015; 53: 48-55. doi: 10.1016/j.procs.2015.07.278

13. Holtzman DM, Morris JC, Goate AM. Alzheimer’s disease: the challenge of the second century. Sci Transl Med. 2011; 3(77): 77sr71. doi: 10.1126/scitranslmed.3002369

14. Dubois B, Feldman HH, Jacova C, et al. Research criteria for the diagnosis of Alzheimer’s disease: revising the NINCDS-ADRDA criteria. Lancet Neurol. 2007; 6(8): 734-746. doi: 10.1016/S1474-4422(07)70178-3

15. Goedert M, Spillantini MG. A century of Alzheimer’s disease. Science. 2006; 314(5800): 777-781. doi: 10.1126/science.1132814

16. Arnold SE, Hyman BT, Flory J, Damasio AR, Van Hoesen GW. The topographical and neuroanatomical distribution of neurofibrillary tangles and neuritic plaques in the cerebral cortex of patients with Alzheimer’s disease. Cerebral Cortex. 1991; 1(1): 103-116. doi: 10.1093/cercor/1.1.103

17. Braak H, Braak E. Staging of Alzheimer’s disease-related neurofibrillary changes. Neurobiol Aging. 1995; 16(3): 271-278; discussion 278-284. doi: 10.1016/0197-4580(95)00021-6

18. Rose SE, Chen F, Chalk JB, et al. Loss of connectivity in Alzheimer’s disease: an evaluation of white matter tract integrity with colour coded MR diffusion tensor imaging. J Neurol Neurosurg Psychiatry. 2000; 69(4): 528-530. doi: 10.1136/jnnp.69.4.528

19. Medina DA, Gaviria M. Diffusion tensor imaging investigations in Alzheimer’s disease: the resurgence of white matter compromise in the cortical dysfunction of the aging brain. Neuropsychiatr Dis Treat. 2008; 4(4): 737-742. doi: 10.2147/NDT.S3381

20. Fu JL, Liu Y, Li YM, Chang C, Li WB. Use of diffusion tensor imaging for evaluating changes in the microstructural integrity of white matter over 3 years in patients with amnesic-type mild cognitive impairment converting to Alzheimer’s disease. J Neuroimaging. 2014; 24(4): 343-348. doi: 10.1111/jon.12061

21. Ringman JM, O’neill J, Geschwind D, et al. Diffusion tensor imaging in preclinical and presymptomatic carriers of familial Alzheimer’s disease mutations. Brain. 2007; 130(Pt 7): 1767-1776. doi: 10.1093/brain/awm102

22. Nir TM, Jahanshad N, Villalon-Reina JE, et al. Effectiveness of regional DTI measures in distinguishing Alzheimer’s disease, MCI, and normal aging. Neuroimage Clin. 2013; 3: 180-195. doi: 10.1016/j.nicl.2013.07.006

23. Stebbins GT, Murphy CM. Diffusion tensor imaging in Alzheimer’s disease and mild cognitive impairment. Behav Neurol. 2009; 21(1): 39-49. doi: 10.3233/BEN-2009-0234

24. Chua TC, Wen W, Slavin MJ, Sachdev PS. Diffusion tensor imaging in mild cognitive impairment and Alzheimer’s disease: a review. Curr Opin Neurol. 2008; 21(1): 83-92. doi: 10.1097/WCO.0b013e3282f4594b

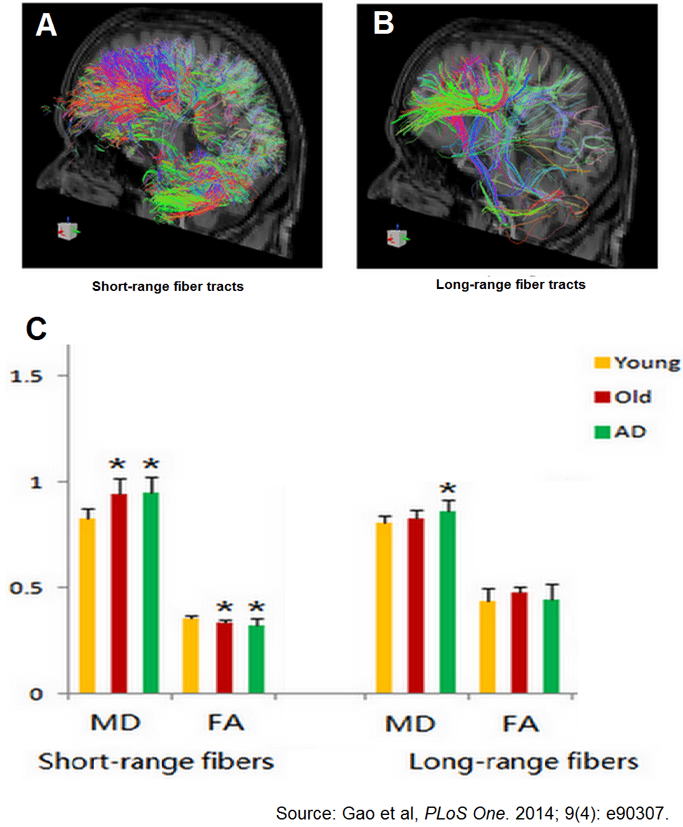
25. Gao J, Cheung RT, Chan YS, et al. The relevance of short-range fibers to cognitive efficiency and brain activation in aging and dementia. PLoS One. 2014; 9(4): e90307. doi: 10.1371/journal.pone.0090307

26. Acosta-Cabronero J, Alley S, Williams GB, Pengas G, Nestor PJ. Diffusion tensor metrics as biomarkers in Alzheimer’s disease. PLoS One. 2012; 7(11): e49072. doi: 10.1371/journal.pone.0049072

27. Clerx L, Visser PJ, Verhey F, Aalten P. New MRI markers for Alzheimer’s disease: a meta-analysis of diffusion tensor imaging and a comparison with medial temporal lobe measurements. J Alzheimers Dis. 2012; 29(2): 405-429. doi: 10.3233/JAD-2011-110797

28. Wieshmann UC, Clark CA, Symms MR, et al. Reduced anisotropy of water diffusion in structural cerebral abnormalities demonstrated with diffusion tensor imaging. Magn Reson Imaging. 1999; 17(9): 1269-1274. doi: 10.1016/S0730-725X(99)00082-X

29. Eriksson SH, Stepney A, Symms MR, et al. Ultra-fast low-angle rapid acquisition and relaxation enhancement (UFLARE) in patients with epilepsy. Neuroradiology. 2001; 43(12): 1040-1045. doi: 10.1007/s002340100647

30. Rugg-Gunn FJ, Eriksson SH, Symms MR, Barker GJ, Duncan JS. Diffusion tensor imaging of cryptogenic and acquired partial epilepsies. Brain. 2001; 124(Pt 3): 627-636. doi: 10.1093/brain/124.3.627

31. Briellmann RS, Mitchell LA, Waites AB, et al. Correlation between language organization and diffusion tensor abnormalities in refractory partial epilepsy. Epilepsia. 2003; 44(12): 1541-1545. doi: 10.1111/j.0013-9580.2003.19403.x

32. Focke NK, Yogarajah M, Bonelli SB, et al. Voxel-based diffusion tensor imaging in patients with mesial temporal lobe epilepsy and hippocampal sclerosis. Neuroimage. 2008; 40(2): 728-737. doi: 10.1016/j.neuroimage.2007.12.031

33. Basser PJ. Inferring microstructural features and the physiological state of tissues from diffusion-weighted images. NMR in Biomedicine. 1995; 8(7-8): 333-344. doi: 10.1002/nbm.1940080707

34. Basser PJ. New histological and physiological stains derived from diffusion-tensor MR images. Ann N Y Acad Sci. 1997; 820: 123-138. doi: 10.1111/j.1749-6632.1997.tb46192.x

35. Zhong J, Petroff OA, Prichard JW, Gore JC. Changes in water diffusion and relaxation properties of rat cerebrum during status epilepticus. Magn Reson Med. 1993; 30(2): 241-246. doi: 10.1002/mrm.1910300214

36. Nakasu Y, Nakasu S, Kizuki H, et al. Changes in water diffusion of rat limbic system during status epilepticus elicited by kainate. Psychiatry Clin Neurosci. 1995; 49(3): S228-S230. doi: 10.1111/j.1440-1819.1995.tb02184.x

37. Parekh MB, Carney PR, Sepulveda H, et al. Early MR diffusion and relaxation changes in the parahippocampal gyrus precede the onset of spontaneous seizures in an animal model of chronic limbic epilepsy. Exp Neurol. 2010; 224(1): 258-270. doi: 10.1016/j.expneurol.2010.03.031

38. Moseley ME, Wendland MF, Kucharczyk J. Magnetic resonance imaging of diffusion and perfusion. Top Magn Reson Imaging. 1991; 3(3): 50-67.

39. Parmar H, Lim SH, Tan NC, Lim CC. Acute symptomatic seizures and hippocampus damage: DWI and MRS findings. Neurology. 2006; 66(11): 1732-1735. doi: 10.1212/01.wnl.0000218207.18707.f4

40. Hugg JW, Butterworth EJ, Kuzniecky RI. Diffusion mapping applied to mesial temporal lobe epilepsy: preliminary observations. Neurology. 1999; 53(1): 173-176. doi: 10.​1212/​WNL.​53.​1.​173

41. Assaf BA, Mohamed FB, Abou-Khaled KJ, et al. Diffusion tensor imaging of the hippocampal formation in temporal lobe epilepsy. AJNR Am J Neuroradiol. 2003; 24(9): 1857-1862.

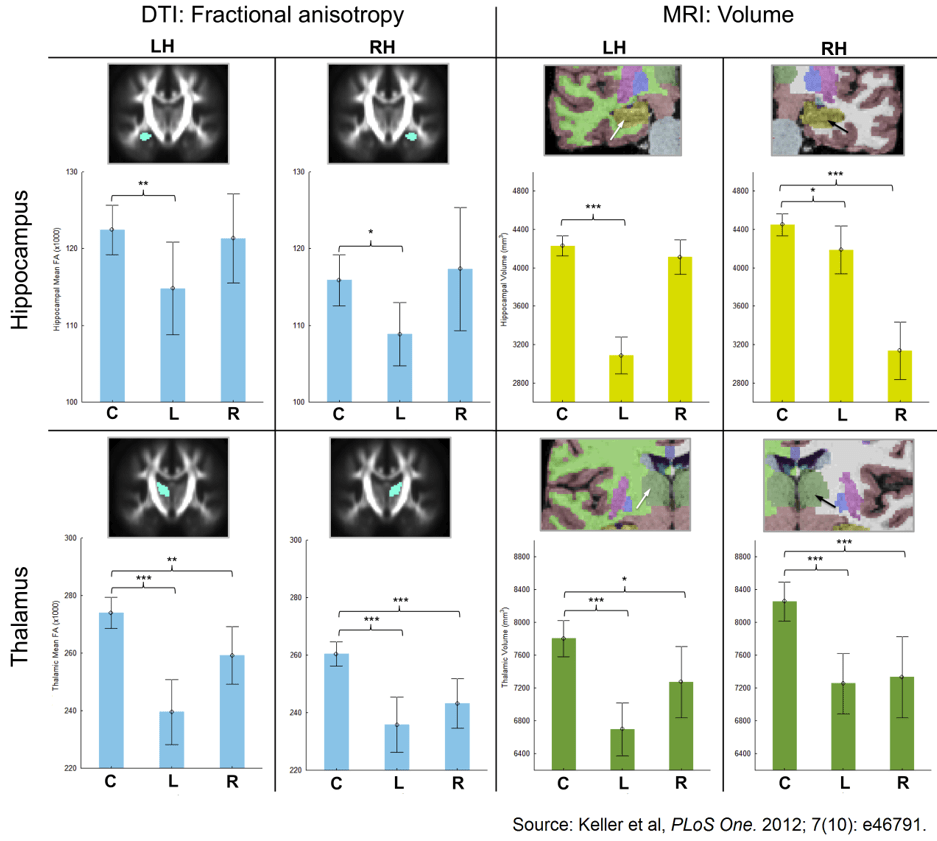
42. Keller SS, Schoene-Bake JC, Gerdes JS, Weber B, Deppe M. Concomitant fractional anisotropy and volumetric abnormalities in temporal lobe epilepsy: cross-sectional evidence for progressive neurologic injury. PLoS One. 2012; 7(10): e46791. doi: 10.1371/journal.pone.0046791

43. Gross DW, Concha L, Beaulieu C. Extratemporal white matter abnormalities in mesial temporal lobe epilepsy demonstrated with diffusion tensor imaging. Epilepsia. 2006; 47(8): 1360-1363. doi: 10.1111/j.1528-1167.2006.00603.x

44. Arfanakis K, Hermann BP, Rogers BP, et al. Diffusion tensor MRI in temporal lobe epilepsy. Magn Reson Imaging. 2002; 20(7): 511-519. doi: 10.1016/S0730-725X(02)00509-X

45. Kim S, Pickup S, Hsu O, Poptani H. Diffusion tensor MRI in rat models of invasive and well-demarcated brain tumors. NMR Biomed. 2008; 21(3): 208-216. doi: 10.1002/nbm.1183

46. Concha L, Beaulieu C, Gross DW. Bilateral limbic diffusion abnormalities in unilateral temporal lobe epilepsy. Ann Neurol. 2005; 57(2): 188-196. doi: 10.1002/ana.20334

47. Concha L, Beaulieu C, Wheatley BM, Gross DW. Bilateral white matter diffusion changes persist after epilepsy surgery. Epilepsia. 2007; 48(5): 931-940. doi: 10.1111/j.1528-1167.2007.01006

48. Richardson MP. Epilepsy and surgical mapping. Br Med Bull. 2003; 65: 179-192. doi: 10.1093/bmb/65.1.179

49. Zhang J, Liu W, Chen H, et al. Multimodal neuroimaging in presurgical evaluation of drug-resistant epilepsy. Neuroimage Clin. 2014; 4: 35-44. doi: 10.1016/j.nicl.2013.10.017

50. Bhatia R, Bali P, Chaudhari RM. Epidemiology and genetic aspects of multiple sclerosis in India. Ann Indian Acad Neurol. 2015; 18(Suppl 1): S6-S10. doi: 10.4103/0972-2327.164814

51. Shah P. Symptomatic management in multiple sclerosis. Ann Indian Acad Neurol. 2015; 18(Suppl 1): S35-S42. doi: 10.4103/0972-2327.164827

52. Meng X, Wang Q, Hou J, et al. Diffusion tensor imaging of normal-appearing white matter in unilateral cerebral arterial occlusive disease. J Magn Reson Imaging. 2013; 38(3): 650-654. doi: 10.1002/jmri.24004

53. Miller TR, Mohan S, Choudhri AF, Gandhi D, Jindal G. Advances in multiple sclerosis and its variants: conventional and newer imaging techniques. Radiol Clin North Am. 2014; 52(2): 321-336. doi: 10.1016/j.rcl.2013.11.011

54. Pierpaoli C, Jezzard P, Basser PJ, Barnett A, Di Chiro G. Diffusion tensor MR imaging of the human brain. Radiology. 1996; 201(3): 637-648. doi: 10.1148/radiology.201.3.8939209

55. Liu Y, Duan Y, He Y, et al. Whole brain white matter changes revealed by multiple diffusion metrics in multiple sclerosis: a TBSS study. Eur J Radiol. 2012; 81(10): 2826-2832. doi: 10.1016/j.ejrad.2011.11.022

56. Calabrese M, Rinaldi F, Seppi D, et al. Cortical diffusion-tensor imaging abnormalities in multiple sclerosis: a 3-year longitudinal study. Radiology. 2011; 261(3): 891-898. doi: 10.1148/radiol.11110195

57. Banaszek A, Bladowska J, Pokryszko-Dragan A, Podemski R, Sasiadek MJ. Evaluation of the degradation of the selected projectile, commissural and association white matter tracts within normal appearing white matter in patients with multiple sclerosis using diffusion tensor mr imaging-a preliminary study. Pol J Radiol. 2015; 80: 457-463. doi: 10.12659/PJR.894661

58. Commowick O, Fillard P, Clatz O, Warfield SK. Detection of DTI white matter abnormalities in multiple sclerosis patients. Med Image Comput Comput Assist Interv. 2008; 11(Pt 1): 975-982. doi: 10.1007/978-3-540-85988-8_116

59. Faul M, Xu L, Wald MM, Coronado VG. Traumatic brain injury in the United States: emergency department visits, hospitalizations, and deaths 2002-2006, Centers for Disease Control and Prevention, National Center for Injury Prevention and Control: Atlanta (GA), 2010.

60. Inglese M, Makani S, Johnson G, et al. Diffuse axonal injury in mild traumatic brain injury: a diffusion tensor imaging study. J Neurosurg. 2005; 103(2): 298-303. Available at: http://thejns.org/doi/abs/10.3171/jns.2005.103.2.0298?url_ver=Z39.88-2003&rfr_id=ori%3Arid%3Acrossref.org&rfr_dat=cr_pub%3Dpubmed&

61. Kraus MF, Susmaras T, Caughlin BP, et al. White matter integrity and cognition in chronic traumatic brain injury: a diffusion tensor imaging study. Brain. 2007; 130(Pt 10): 2508-2519. doi: 10.1093/brain/awm216

62. Geary EK, Kraus MF, Pliskin NH, Little DM. Verbal learning differences in chronic mild traumatic brain injury. J Int Neuropsychol Soc. 2010; 16(3): 506-516. doi: 10.1017/S135561771000010X

63. Rutgers DR, Fillard P, Paradot G, et al. Diffusion tensor imaging characteristics of the corpus callosum in mild, moderate, and severe traumatic brain injury. AJNR Am J Neuroradiol. 2008; 29(9): 1730-1735. doi: 10.3174/ajnr.A1213

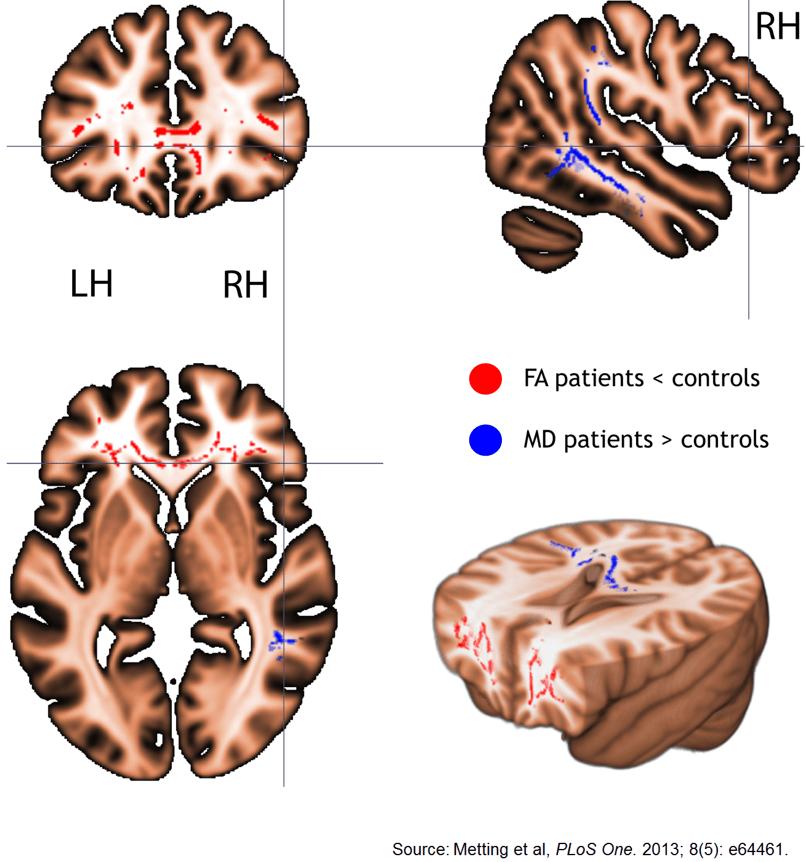
64. Metting Z, Cerliani L, Rodiger LA, Van Der Naalt J. Pathophysiological concepts in mild traumatic brain injury: diffusion tensor imaging related to acute perfusion CT imaging. PLoS One. 2013; 8(5): e64461. doi: 10.1371/journal.pone.0064461

65. Miles L, Grossman RI, Johnson G, et al. Short-term DTI predictors of cognitive dysfunction in mild traumatic brain injury. Brain Inj. 2008; 22(2): 115-122. doi: 10.1080/02699050801888816

66. Chen Z, Ni P, Zhang J, et al. Evaluating ischemic stroke with diffusion tensor imaging. Neurol Res. 2008; 30(7): 720-726. doi: 10.1179/174313208X297968

67. Mukherjee P. Diffusion tensor imaging and fiber tractography in acute stroke. Neuroimaging Clin N Am. 2005; 15(3): 655-665, xii. doi: 10.1016/j.nic.2005.08.010

68. Neil JJ. Diffusion imaging concepts for clinicians. J Magn Reson Imaging. 2008; 27(1): 1-7. doi: 10.1002/jmri.21087

69. Werring DJ, Toosy AT, Clark CA, et al. Diffusion tensor imaging can detect and quantify corticospinal tract degeneration after stroke. J Neurol Neurosurg Psychiatry. 2000; 69(2): 269-272. doi: 10.1136/jnnp.69.2.269

70. Ni J, Li ML, Yao M, Cui LY. Early corticospinal tract Wallerian degeneration on diffusion-weighted MR imaging after adult stroke: three cases report. Clin Neurol Neurosurg. 2013; 115(7): 1164-1166. doi: 10.1016/j.clineuro.2012.09.027

71. Lukyanova LD, Kirova YI. Mitochondria-controlled signaling mechanisms of brain protection in hypoxia. Front Neurosci. 2015; 9: 320. doi: 10.3389/fnins.2015.00320

72. Mariano G, Fink M, Hoffman C, Rosengart A. Intracranial pressure: monitoring and management in principles of critical care, McGraw-Hill Education LLC,: New York, NY, 2015: 1 online resource.

73. Ropper AH, Samuels MA, Klein J. Intracranial neoplasms and paraneoplastic disorders. In: Ropper AH, Samuels MA, Klein J, eds. Adams and Victor’s principles of neurology. McGraw Hill Medical,: New York, NY, 2014: 2v (xliii, 3,610, 158) .

74. Kubal WS. Updated imaging of traumatic brain injury. Radiol Clin North Am. 2012; 50(1): 15-41. doi: 10.1016/j.rcl.2011.08.010

75. Huisman TA. Diffusion-weighted and diffusion tensor imaging of the brain, made easy. Cancer Imaging. 2010; 10(1A): S163-S171. doi: 10.1102/1470-7330.2010.9023

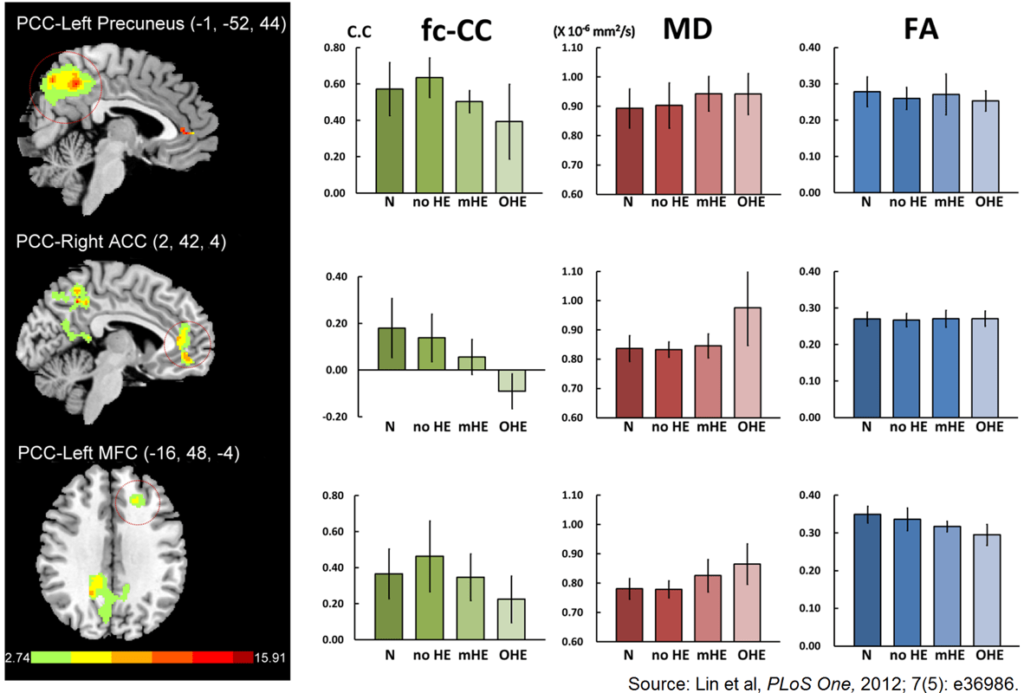
76. Lin WC, Hsu TW, Chen CL, et al. Connectivity of default-mode network is associated with cerebral edema in hepatic encephalopathy. PLoS One. 2012; 7(5): e36986. doi: 10.1371/journal.pone.0036986

77. Koch S, Rabinstein A, Falcone S, Forteza A. Diffusion-weighted imaging shows cytotoxic and vasogenic edema in eclampsia. AJNR Am J Neuroradiol. 2001; 22(6): 1068-1070. doi: 10.1161/01.STR.28.5.1082

78. Maegele M, Stuermer EK, Hoeffgen A, et al. Multimodal MR imaging of acute and subacute experimental traumatic brain injury: time course and correlation with cerebral energy metabolites. Acta Radiol Short Rep. 2015; 4(1): 2047981614555142. doi: 10.1177/2047981614555142

79. Suetomi Y, Kanchiku T, Nishijima S, et al. Application of diffusion tensor imaging for the diagnosis of segmental level of dysfunction in cervical spondylotic myelopathy. Spinal Cord. 2015. doi: 10.1038/sc.2015.192

80. Barakat N, Gorman MP, Benson L, Becerra L, Borsook D. Pain and spinal cord imaging measures in children with demyelinating disease. Neuroimage Clin. 2015; 9: 338-347. doi: 10.1016/j.nicl.2015.08.019

81. Lindberg PG, Sanchez K, Ozcan F, et al. Correlation of force control with regional spinal DTI in patients with cervical spondylosis without signs of spinal cord injury on conventional MRI. Eur Radiol. 2015. doi: 10.1007/s00330-015-3876-z

82. Chang ST, Xu J, Trinkaus K, et al. Optic nerve diffusion tensor imaging parameters and their correlation with optic disc topography and disease severity in adult glaucoma patients and controls. J Glaucoma. 2014; 23(8): 513-520. doi: 10.1097/IJG.0b013e318294861d

83. Smith SA, Williams ZR, Ratchford JN, et al. Diffusion tensor imaging of the optic nerve in multiple sclerosis: association with retinal damage and visual disability. AJNR Am J Neuroradiol. 2011; 32(9): 1662-1668. doi: 10.3174/ajnr.A2574

LATEST ARTICLES

Unraveling the Mysteries of Type-A Aortic Dissection Using POCUS/Echocardiography

Syeda Rukh*, Sathyanarayana Machani and Milind Awale

doi.

Blood Sample from the Patient

Hypertriglyceridemia-Induced Pancreatitis: A Case Report and Literature Review

Maarten Bulterys, Melvin Willems* and Agnes Meersman

doi.

From Neck Pain to a Life-Threatening Condition: A Case Report

Floris Vandewoude* and Sören Verstraete

doi.

LATEST ARTICLES