INTRODUCTION
Vitamin D deficiency is highly prevalent in the pediatric population.1 Evidence suggests that obese children are more prone to vitamin D deficiency than non-obese children,2 with the degree of deficiency directly related to the degree of adiposity. To our knowledge, however, there are no recent data available on the predictors of low 25(OH)D levels among multiethnic obese children. In adults, adiposity has long been known to be inversely related to circulating 25(OH)D,2,3 so it is not surprising that this association is being recognized in obese children, with studies showing that as many as 75% of obese children are vitamin D deficient.1
Vitamin D deficiency is defined by the Institute of Medicine (IOM) as a serum 25-hydroxy vitamin D <20 ng/mL (<50 nmol/L).4 The etiology of vitamin D deficiency is multifactorial.5 Proposed risk factors include race/ethnicity,6 lack of sufficient sunlight exposure,7 insufficient activity,8 decreased consumption of vitamin D-containing foods such as fish and fortified dairy products,9 malabsorptive states,10 increased vitamin D degradation and increased body weight.6 Other predictors of low vitamin D status in healthy children include age,11 gender11 and socio-economic status.1
In children, vitamin D is essential for skeletal health.12 Deficiency in children has also been linked to increased risk of allergies and asthma,13 and cardiovascular risk markers.14 In obese children, low levels of vitamin D may play a role in the pathophysiology of impaired glucose tolerance.15 It is therefore essential to know what factors predict vitamin D deficiency in children.
The objective of the study is to examine the association between vitamin D deficiency and BMI z-score (BMIZ) in obese children. We hypothesize that predictors of deficient serum 25(OH)D in obese children will be low dairy intake, ethnicity, season and higher BMIZ.
MATERIALS AND METHODS
Participants
Children aged 5-14 years with a BMIZ≥95% for age and gender followed at a pediatric weight management clinic were enrolled in the study from March 2011 to July 2012. Exclusion criteria were: use of vitamin D supplementation; history of hyperparathyroidism, rickets, type 1 or type 2 diabetes (T2D), renal failure, nephrolithiasis or new-on set hypothyroidism; and, use of prednisone, phenytoin, thiazides, statins or orlistat. Informed consent and/or assent were obtained for all participants and their caregivers prior to participation and study protocols were an Institutional Review Board (IRB) approved.
Data Collection
Fasting blood was drawn for serum 25(OH)D, parathyroid hormone (PTH), calcium, insulin, glucose, HbA1c, high sensitivity C-reactive protein (hs-CRP), lipids, aspartate aminotransferase (AST) and alanine aminotransferase (ALT). Anthropometric data were collected: height to the nearest 0.1 cm on a standard wall stadiometer, weight to the nearest 0.1 kg on an electronic scale (Scale-tronic model 6002; Wheaton, IL, USA) with children in light clothing, waist circumference (WC) measured at the level of the iliac crest, and blood pressure. BMIZ was calculated as weight in kg divided by the square of the height in meters. BMIZ percentiles were determined by using age- and gender-specific Centers for Disease Control and Prevention (CDC) growth charts.16 Child age, gender, ethnicity, past medical history and family history of vitamin D deficiency, T2D and early chemical vapor deposition (CVD) were reported by parents. Season of serum collection was recorded as summer, fall, winter and spring.
Biomarker Assays
Serum 25(OH)D concentrations were determined after extraction with acetonitrile, using a standard radioimmunoassay (RIA) developed by DiaSorin, Inc. (Stillwater, MN, USA). Serum 25(OH)D was assayed using an equilibrium RIA with 125I. Lower limit of detection was 1.5 ng/mL (DiaSorin, Inc.). Serum lipids and blood glucose were measured by enzymatic methods with Cobas 8000 (Roche Diagnostics, Basel, Switzerland). hsCRP was measured with a particle enhanced immunoturbidimetric method (Roche Diagnostics, Basel, Switzerland). PTH and fasting insulin were measured using Electro chemiluminescence immunoassay (Roche Diagnostics, Basel, Switzerland). Calcium levels were measured using Cobas method according to Schwarzenbach17 Roche Diagnostics is a diagnostic division of Hoffmann-La Roche which manufactures equipment and reagents for research and medical diagnostic (Roche Diagnostics, Basel, Switzerland).17 Hemoglobin A1c Test Normal and high chart and ranges (HbA1C) was measured using Cobas Turbimetric (Roche Diagnostics, Basel, Switzerland). AST and ALT were measured using NADH oxidation (Roche Diagnostics, Basel, Switzerland).
Dietary Assessment
Dietary intakes were assessed using the 8-page Block Kids 2004 FFQ (Nutrition Quest, Berkeley, CA, USA), incorporating approximately seventy food and beverage items. The Food Frequency Questionnaire (FFQ) has been validated for multiethnic school-age children9 residing in the same geographic region as the current study. It has also been specifically validated for estimating beverage, Ca and vitamin D intakes in children when compared with 3-day food diaries.18 Portion size pictures were used to increase the accuracy of their estimates.
The FFQs were administered by trained staff. Proxy respondents reported for 5-year-old children and proxy-assisted interviews were conducted with children 6-14 years of age. FFQs were reviewed for completion and processed through the Block Dietary Data Systems (Berkeley, CA, USA),19 and quantified by Nutrition Quest. Nutrient values were calculated for each item and further summarized into daily intakes of energy and nutrients using an algorithm from Nutrition Quest. Additional vitamin D contribution from foods and beverages was requested separately from Nutrition Quest. Nutrient values were determined based on updated values for fortified foods from the USDA 1998 nutrient database20 and adjusted for bioavailability through nutrient-equivalent estimates when relevant.21
Statistical Analysis
All analysis were conducted using Stata (version 14.0, StataCorp, College Station, TX, USA). Descriptive statistics, univariate analysis, and Fisher’s exact test were employed. If continuous variables were not normally distributed, the Wilcoxon rank-sum test was employed.
Serum 25(OH)D levels were dichotomized into <20 ng/ mL (deficient) or ≥20 ng/mL (sufficient). BMIZwas dichotomized into ≥2.5 (high) vs. <2.5 (low). Nutrient intakes were energy-adjusted using the residual method.22 Daily milk intake was determined with “number of milk-cup equivalents” (servings), and dairy, using “daily servings of milk, yogurt and cheese” and total dairy intake was assessed as total dairy intake in milk equivalent servings. The dietary variables were correlated with
the cardiovascular markers and waist circumference and then compared by BMIZz category, using t-tests and rank-sum tests.
The month of enrollment was used as a coarse indicator of average sun exposure. Months were combined into seasons for analysis: winter (December, January, February), spring (March, April, May), summer (June, July, August), and fall (September, October, November).
We computed an age- and gender- standardized WC score based on Sabo, 2012.23 For purposes of analysis, we categorized the sample into two groups above and below the median for the sample. So, the sample was split at the sample median standardized WC values, which were 3.4.
A base regression model evaluated BMIZ, adjusting for age, gender, ethnicity and season. Significance testing of their overall contribution to the model was assessed using a likelihood ratio test. Significance testing relative to the reference group, as for all other variables in the model, was conducted using a standard Wald test. In light of the restricted sample size, to account for nutritional factors, energy-adjusted nutrient variables were added singly to the base regression model. Similarly, cardiovascular disease (CVD) risk markers were evaluated as confounders by introducing each marker individually into the base model. Adjusted risk estimates are reported as odds ratios with 95% confidence intervals (CI). Significance testing was conducted at a critical level of 5%.
RESULTS AND DISCUSSION
Demographics
Of 115 children enrolled, 24 were excluded for incomplete dietary data, implausible energy intake <500 or >5000 kcal/d,24 or for missing serum markers. Ninety-one children [mean age 10.9±2.6 (SD) years] had complete dietary data. The majority were female (52.7%). Of the total, 26.4% were Caucasian, 51.7% were Hispanic, and 22% were African American. The majority of participants were enrolled in the spring or summer (71.5%) (Table 1). Clinical characteristics are shown in Table 2. The mean BMIZ was 31.6±6.5 kg/m2 , BMIZ was 2.40±0.37. The mean standardized waist circumference was 3.7±1.5 (n=90). For subsequent analysis, BMIZ was dichotomized at 2.5 (about the 99.5%): 37.4% (n=34)≥2.5, and 62.6% (n=57)<2.5.
Table 1: Characteristics of study sample (n=91), overall and by vitamin D Level.
| Sample Characteristic |
Overall (n=91) |
VDL≥20 (n=48) |
VDL<20
(n=43) |
p |
|
mean (SD) |
mean (SD) |
mean (SD) |
|
| Age |
10.9 (2.6) |
10.1 (2.5) |
11.8 (2.5) |
<0.001 |
|
n (%) |
n (%) |
n (%) |
|
| Male |
47.3 (43) |
54.2 (26) |
39.5 (17) |
0.21 |
| Ethnicity |
|
|
|
0.12 |
| Caucasian |
26.4 (24) |
33.3 (16) |
18.6 (8) |
|
| African-American |
22.0 (20) |
14.6 (7) |
30.2 (13) |
|
| Hispanic |
51.7 (47) |
52.1 (25) |
51.2 (22) |
|
| Season |
|
|
|
0.009 |
| Winter |
15.4 (14) |
4.2 (2) |
27.9 (12) |
|
| Spring |
44.0 (40) |
45.8 (22) |
41.9 (18) |
|
| Summer |
27.5 (25) |
31.3(15) |
23.3 (10) |
|
| Fall |
13.2 (12) |
18.8 (9) |
7.0 (3) |
|
*among children with total calories ≥500
Table 2: Clinical Characteristics of study sample (n=91), overall and by vitamin D level.
|
Sample Characteristic
|
Overall (n=91) |
25(OH)D≥20
(n=48) |
25(OHD<20
(n=43) |
P
|
|
mean (SD)
|
mean (SD) |
mean (SD)
|
|
| SBP |
114.8 (10.1)
|
111.9 (8.8) |
118.1 (10.5)
|
|
| DBP |
66.2 (7.0)
|
64.7 (6.2) |
67.9 (7.5) |
0.03
|
|
n (%)
|
n (%) |
n (%)
|
|
| BMIZ≥2.5 |
37.4 (34)
|
31.3 (15) |
44.2 (19) |
0.28
|
| WC≥3.4a |
51.1 (46)
|
47.9 (23) |
54.8 (23) |
0.53
|
a90 children total SBP=Systolic Blood Pressure; DBP=Diastolic blood pressure
*Among children with total calories≥500; BMIZ=Body mass index by age percentile z-score; WC=waist circumference
25(OH)D and PTH Levels
The mean 25(OH)D was 21.2±7.6 ng/mL, with 47.3% (n=43) having levels <20 ng/mL. Significant associations with 25(OH) D levels were seen with age, season and ethnicity (p<0.01) (Table 2). The prevalence of vitamin D deficiency was higher among ethnic minority and older children.
Vitamin D levels were lower in the winter season of serum collection and in children with higher BMIZ. The effect of BMIZ on serum 25(OH)D may be explained by the fact that persons with high BMIZ may have excess body fat, potentially resulting in increased sequestration of vitamin D and low bioavailability and thus, low serum 25(OH)D levels.3 Other evidence suggests that excess body fat may disrupt hormonal pathways important for skeletal health. For example, leptin that binds to osteoblasts appears to activate a pathway that inhibits renal synthesis of the active form of vitamin D.25 Leptin levels are markedly elevated in obese individuals thereby decreasing 25(OH) D levels. vitamin D deficiency is associated with insulin resistance,26 which, in turn, is inversely correlated with vitamin D binding protein (VDBP).26 Protein bound vitamin D is inactive, whereas non-protein bound vitamin D is the active form. We speculate that the total 25(OH)D we observed may have been counter balanced by a parallel insulin resistance-driven reduction of VDBP.
This is corroborated by potentially higher HOMA values in children with 25(OH)D <20 ng/mL vs. those with nondeficient levels.
There were no significant differences in parathyroid hormone (PTH) levels between those with 25(OH)D<20 ng/mL vs. those ≥20 ng/mL (Table 3). Our sub-analysis of the relationship between serum 25(OH)D and PTH revealed no association. Maximal suppression of serum parathyroid hormone: PTH in adults has been reported over a wide range of serum 25(OH) D from 20-110 nmol/L.26 Giudice27 found comparable levels of PTH despite different levels of total 25(OH)D in obese and nonobese children. In a recent study, however, Amini28 showed that the level of serum 25(OH)D below which PTH began to rise was lower in overweight/obese compared to normal weight children (12.4 vs. 17.0 ng/mL). This might be a consequence of similar ionized calcium levels despite lower 25(OH)D.29 We speculate that the PTH is responding to total body 25(OH)D, not just circulating serum levels. Other factors that can influence PTH include the assay utilized, diurnal variation, age, and dietary intake of calcium and phosphorus.30 Our study participants were all adolescents and children, and normal ranges for PTH are not dissimilar in these age groups. Our assay was specific enough to consider only intact PTH molecules minimizing falsely elevated levels. We factored in dietary intake of calcium in our analysis.
Dietary Intakes
Children in the vitamin D deficient group had lower mean daily intakes of vitamin D, calcium, n-3 fatty acids (134.8 vs.173.8 IU/d, p<0.03; 657.9 vs. 763.8 mg/d, p<0.005; 0.8 vs. 1.0 mg/d, p<0.05), and total sugars (80.5+/-36.4 g/d vs. 110.0+/-58.7 g/d, p<0.005, Table 3). The median number of servings from the meat group was lower in children with 25(OH)D<20 ng/mL compared to those with 25(OH)D≥20 ng/mL (median 1.1 vs. 1.4 servings; inter quartile range 1.0-1.7, p<0.05).
Other Clinical Measures
As shown in Table 1, children with low 25(OH)D had higher fasting insulin (13.1 vs. 19.1 IU/ml, p<0.01), systolic (111.9 vs. 118.1 mmHg, p<0.04) and diastolic blood pressure (64.7 vs. 67.9 mmHg, p<0.03) and lower serum calcium (9.8 vs. 10.0 mg/dL, p<0.005). AST was higher in those with 25(OH)D≥20 ng/mL when compared to those with <20 ng/mL (24.6+/- 5.0 vs. 21.1+/-5.1 U/L; p<0.002).
Multiple factors impacting risk for vitamin d deficiency
The base logistic regression model examining vitamin D deficiency included BMIZ (<2.5 vs. ≥2.5), gender, ethnicity, age, and season is shown in Table 4. Odds of vitamin D deficiency were more than three times higher in children with BMIZ≥2.5 compared to those <2.5 when adjusting for the other covariates (OR: 3.35, 95% CI: 1.07-10.43; p= 0.04). The odds of Vitamin D deficiency increased by 47% for each year of age (OR: 1.47, 95% CI: 1.17-1.83; p=0.001); African-American children were more than six times as likely as Caucasian children to have low 25(OH)D (OR: 6.68, 95% CI: 1.31-36.13; p= 0.02); and, relative to winter, children entering the study during the other seasons were less likely to have lower 25(OH)D levels. Although males were less likely to have low 25(OH)D than females, this difference did not reach statistical significance (or: 0.44, 95% CI: 0.15-1.26; p=0.13). When the base model was further adjusted for nutrient residuals, risk of Vitamin D Deficiency for those with a BMIZ≥2.5 is unchanged and remained stable regardless of the nutrient added to the base model (Figure 1). The adjusted odds ratios for BMIZ ranged from 2.96 when adjusting for whole grains to 3.71 when adjusting for n-3 FAs. As shown in Figure 2, most cardiovascular risk markers did not confound the adjusted odds ratio for BMIZ in the base model. Adjustment for hs-CRP increased the estimated odds ratio for BMIZ (OR=5.52; 95% CI: 1.51- 20.17; p=0.01).
Figure 1: Logistic regression analysis of association between Vitamin D and BMI z-score category, controlling for children’s Intakes of nutrients and food groups (n=91).
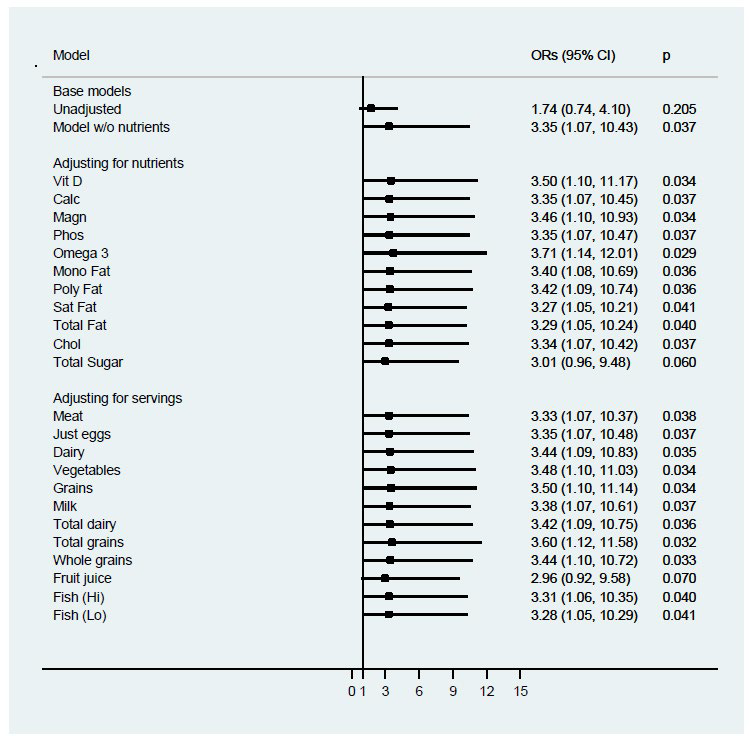
Figure 2: Logistic regression analysis of association between vitamin D and BMI z-score category, controlling for cardiovascular risk factors in children (n=91).
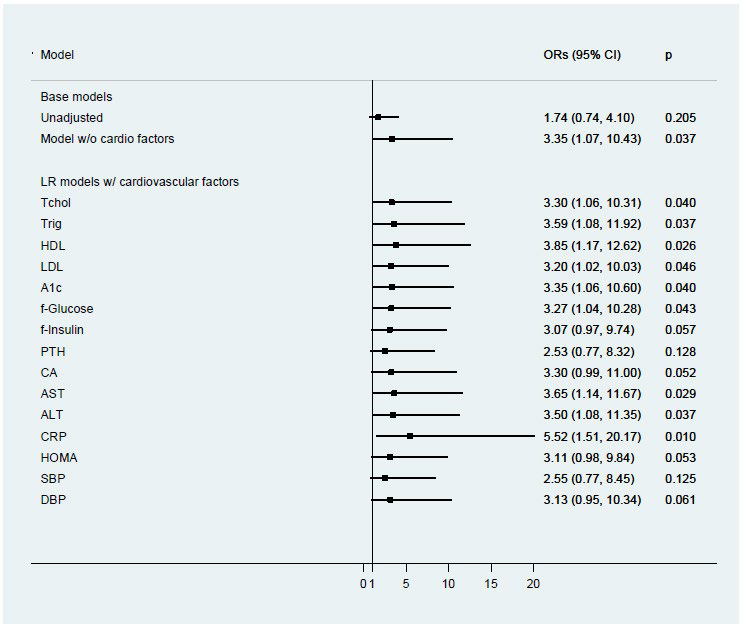
Table 4: Logistic regression model of adjusted risk of low vitamin D level (<20ug/mL) (n=91).
|
Characteristic
|
Odds Ratio |
95% CI |
p-value
|
| BMI z-score |
|
|
|
|
< 2.5 (ref)
|
1.0
|
|
|
|
≥2.5
|
3.35
|
(1.07-10.43) |
0.04
|
| Gender |
|
|
|
| Female (ref) |
1.0
|
|
|
|
Male
|
0.44
|
(0.15-1.26) |
0.13
|
|
Ethnicity
|
|
|
|
| Caucasian (ref) |
1.0
|
|
|
| African-American |
6.68
|
(1.31-36.13) |
0.02
|
| Hispanic |
2.91
|
(0.77-10.96) |
0.11
|
| Age (years) |
1.47
|
(1.17-1.83) |
0.001
|
| Season |
|
|
0.02a
|
|
Winter (ref)
|
1.0
|
|
|
|
Spring
|
0.12 |
(0.02-0.75) |
0.02
|
|
Summer
|
0.08 |
(0.01-0.55) |
0.01
|
|
Fall
|
0.07 |
(0.01-0.57) |
0.01
|
Note: alikelihood ratio test of variable’s overall significance in model
CONCLUSION
Our data suggests that those children with high BMIZ≥2.5 had lower serum 25(OH)D levels as compared to those with low BMIZ<2.5. This study documented 47.3% of children studied having 25(OH)D levels <20 ng/mL. Significant associations with 25(OH)D levels were seen with older age, winter season and African American ethnicity and with higher BMIZ.
Furthermore, we found that the risk for vitamin D deficiency increases in children with severe obesity (BMIZ ≥2.5 SD) and is not significantly altered by ethnicity, nutrient intake or season. Such results have not been found in other studies assessing factors affecting vitamin D status in obese children. Factors associated with a higher prevalence of Vitamin D Deficiency include poverty, winter/spring season of serum collection, lack of vitamin D supplement use, low milk intake, greater TV/computer use, and low physical activity.1 Our study suggests that although these factors are important, they do not necessarily influence the change in risk for vitamin D deficiency in this sample of severely obese children. Sample size might be one of the reasons for these differences. Our study included 91 children whereas the National Health and Nutrition Examination Survey (NHANES) study had 12,292 children in the sample. Another difference is the geographic location, as our population was mostly from Western Massachusetts.
Our study has several limitations. First, these results arise from a cross-sectional study design. As such, the associations should be interpreted as co-relational. It would be premature to assume based on these results that reducing BMIZ would necessarily increase 25(OH)D. Such evidence would need to be derived from prospective studies of change in BMIZ. Second, the limited sample size led to rather imprecise estimates, particularly for the multivariate analyses. Small sample sizes can exaggerate estimates of the odds ratios derived from logistic regression, regardless of adjustment.31 We used only a crude measure of sun exposure as a covariate in our multivariable models. Although limited, the use of season was significant in our base model and the odds ratios associated with each season appeared reasonable.
The study’s design was strengthened by the use of a validated FFQ23,24 for estimating vitamin D intake in this highrisk pediatric population and was pilot-tested in the clinical community of interest. The inclusion of a comprehensive list of multiple risk factors, as well as the use of a study population comprised of a racially and ethnically diverse sample of children from an urban location geographically at high risk for limited sunlight exposure, were other strengths of our study.
Given the numerous behavioral and environmental factors that influence sun exposure and its effect on 25(OH)D level, it is not clear that a self-reported survey would contribute more meaningfully to the model than the adjustment for season. This relationship needs further study, particularly in children. The question also arises as to whether better markers of 25(OH) D levels exist for obese children and adults, and this should be investigated in future research. Recently, Power,32 investigating both African American and White Americans, suggested that measurement of the bioavailable, 25(OH)D may provide a better marker of sufficiency compared with total 25(OH)D. It has also been proposed that serum free 25(OH)D may better reflect the vitamin D action than total 25(OH)D, for which an Enzymelinked immunosorbent assay (ELISA) for serum free 25(OH)D has recently become available.33 Given the normal PTH levels in the setting of low 25(OH)D levels, and the observed increase in 25(OH)D following weight loss in many studies, it appears the treatment of low 25(OH)D levels in these adolescents and children could be weight reduction, and not supplementation. Future randomized controlled trials (RCTs) addressing this research question should be conducted. Our findings for the inverse association between BMIZ classification and vitamin D deficiency warrant more research to further elucidate the specific mechanisms by which severe obesity, and potential change in obesity status may influence serum 25(OH)D levels.
ACKNOWLEDGEMENTS
SK and CW conceived the study, received grant support, and conducted/supervised the study. PV conducted the primary analysis of the data, and facilitated data modeling and interpretations. HG managed the literature review with updated references, and incorporated revisions of the paper for critical comments from coauthors. RC contributed critical edits, with updated references from the scientific literature. MG provided scientific reference updates. All authors contributed to the review and interpretation of data, and in the editing and approval of the final paper. SK and CW had primary responsibility for the final content presented. All authors critically revised the paper for intellectual content and read and approved the final draft.
This work was funded by UMass-Baystate Medical Center Collaborative Biomedical Research (CBR) Grant. (Co-PIs: Srimathi Kannan, PhD and Chrystal Wittcopp, MD) We would like to thank our participants for their support and commitment to this study.
CONFLICT OF INTEREST
The authors declare that they have no conflicts of interest.


