The Matsuda composite index of insulin sensitivity (MISI) has been widely used as a measure of whole body insulin sensitivity in clinical and epidemiological research. Recently, reduced sampling schedules for calculation of the MISI from an Oral Glucose Tolerance Test (OGTT) have been shown to produce values that correlate well with insulin sensitivity measured by the euglycemic clamp method.1 However, a mixed meal represents a more physiologic stimulus than an oral glucose load. Because insulin resistant states are associated not only with disturbances in carbohydrate metabolism, but also with disturbances in postprandial lipid and hormonal responses, a mixed meal stimulus allows assessment of additional variables of potential interest such as postprandial triglyceride, incretin and appetite regulation hormone responses. These variables change minimally in response to a glucose-only stimulus. Additionally, a liquid meal allows for simpler standardization across research sites, particularly research sites in different countries, where it may be difficult to obtain standard products for a solid meal test.2,3 Therefore, the objective of this study was to evaluate the performance of the MISI derived from Liquid Meal Tolerance Test (LMTT) data, calculated using reduced sampling schedules, compared with the insulin sensitivity index (SI) derived from minimal model analysis of data from an insulin-modified Intravenous glucose tolerance test (IVGTT) in overweight and obese subjects.
SUBJECTS AND METHODS
These data were collected as part of a previously published validation study in overweight and obese men and women without diabetes, the details of which have been described previously.4 Briefly, subjects included men and women with waist circumference ≥102 cm and ≥89 cm, respectively, and a body mass index <35.0 kg/m2. Exclusion criteria included body mass index ≥35.0 kg/m2; abnormal laboratory values of clinical importance, history of clinically important endocrine, cardiovascular, renal, pulmonary, hepatic, biliary, or gastrointestinal disease; recent history of cancer, major trauma or surgery, or a current infection. Subjects with habits that might confound the results (e.g., alcohol or substance abuse, extreme dietary or exercise habits) or using systemic medications known to influence carbohydrate metabolism were also excluded.
For the insulin-modified IVGTT, 300 mg/kg body weight intravenous glucose (50% dextrose solution) was administered over approximately 1.5 min at t=0 min. At t=20 min, intravenous regular human insulin (0.03 U/kg, diluted to 10 mL with normal saline) was administered over approximately 1 min. Blood samples were collected at the following pre- and postglucose infusion time points: t=-10, -5, 3, 5, 7, 10, 12, 14, 16, 19, 22, 25, 30, 40, 50, 60, 75, 90, 120, 150, and 180 min. Plasma glucose and insulin values were entered into the Minmod Millennium program (Version 6.02; RN Bergman, USC, Los Angeles, CA, USA) for determination of SI.5
For the LMTT, subjects consumed within 10 minutes, two 8 oz servings of a liquid meal (Ensure®, Abbott Nutrition, Columbus, OH, USA) providing a total of 500 kcal, 84 g carbohydrate, 12 g fat and 18 g protein. Blood samples were obtained from an indwelling intravenous catheter for analysis of plasma glucose and insulin concentrations at t=-1, 30, 60, 90, and 120 min, where t=0 min was the start of the LMTT. The MISI was calculated as 10,000/(G0×I0×Gm×Im)0.5 where G0 and I0 were pre-meal values for Glucose (G) and Insulin (I) and Gm and Im were mean post-meal values using all sample time-points as well as subsets of the available samples.6 The strengths of the relationships between MISI values from the LMTT and SI from the IVGTT were assessed using linear regression analysis and Pearson correlation coefficients.
RESULTS
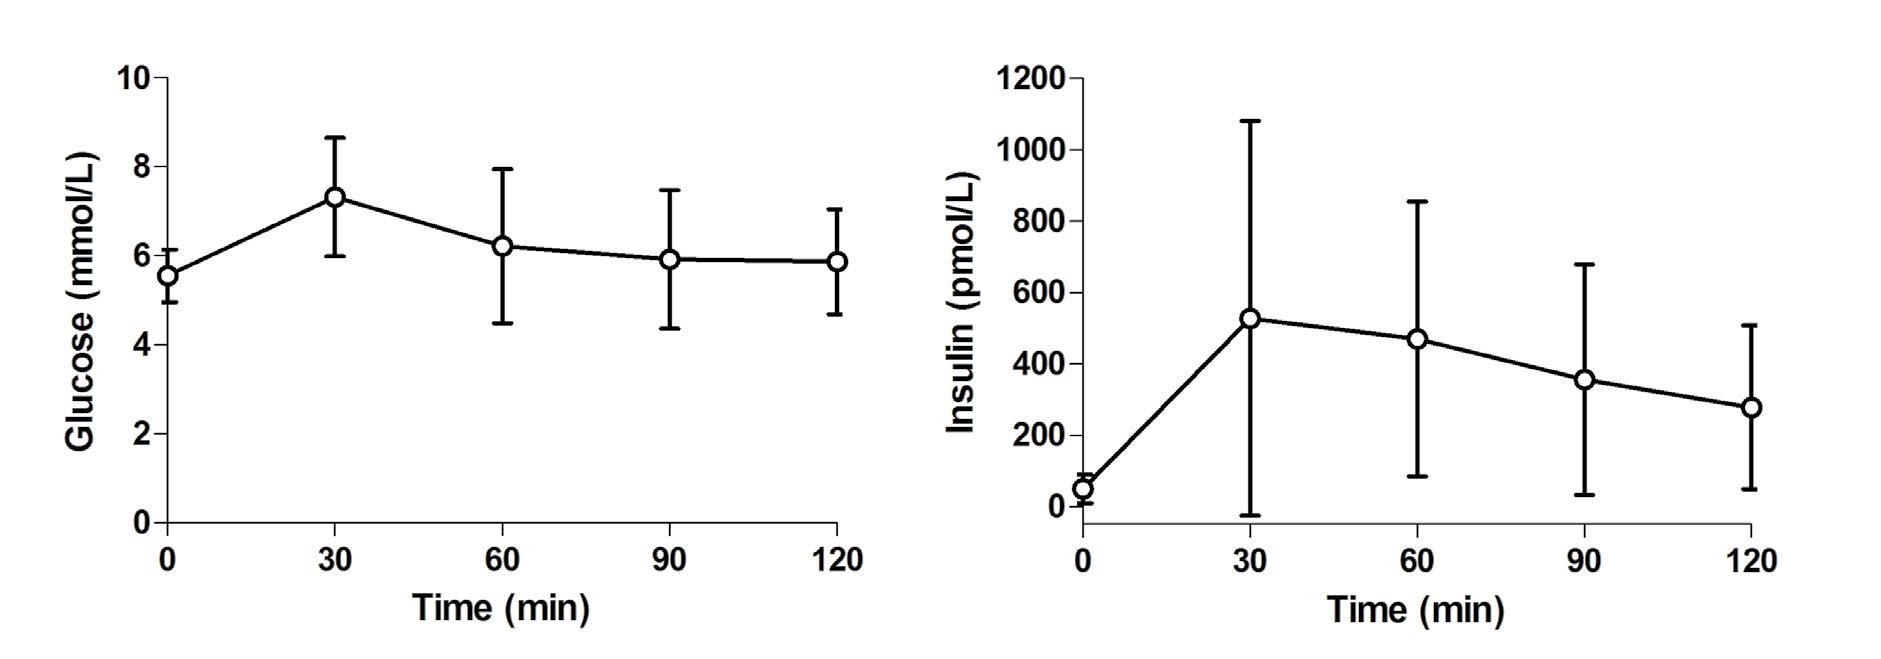
Participants included primarily non-Hispanic white (83%) generally healthy men (n=8) and women (n=16) with a mean (±SEM) age 48.9±2.0 years, BMI 30.8±0.6 kg/m2 and waist circumference 104.3±1.6 cm. On the day of the IVGTT, fasting glucose was 5.5±0.1 mmol/L, insulin was 57.0±7.8 pmol/L, and SI was 6.57±1.15 (10-5 × pmol / L-1 × min-1). MISI from an LMTT on a separate day was 19.1±2.4 (pmol/L-1 × mmol / L-1). Glucose and insulin responses to the LMTT are presented in Figure 1. All possible combinations of pre-LMTT (t=0 min) and postLMTT sampling time points were assessed. Pearson correlation coefficients between SI and MISI were as follows: 0, 30, 60, 90, and 120 min (full schedule), r=0.776 (p<0.0001), MISI=8.3+2.7 (SI); 0, 60, and 120 min, r=0.815 (p<0.0001), MISI=7.7+3.3 (SI); and 0 and 120 min, r=0.848 (p<0.0001), MISI=10.6+3.2 (SI).
Figure 1: Glucose and insulin responses to a liquid meal tolerance test (LMTT). Data Presented as mean±standard deviation.
CONCLUSIONS
Because impaired insulin sensitivity has a central role in the pathogenesis of type 2 diabetes mellitus and metabolic disturbances that increase risk for atherosclerotic disease, simple and cost-effective techniques for assessing insulin sensitivity are of value for use in clinical and population studies. Results from previous studies indicate that the MISI calculated from OGTT, LMTT, or mixed solid meal tolerance tests correlate well with measures of insulin sensitivity derived from IVGTT minimal model and euglycemic clamp data.1,4,7,8,9,10
The present results are in agreement with those from DeFronzo and Matsuda,1 who reported that calculation of the MISI from an OGTT using reduced sampling schedules produced values that correlated well with insulin sensitivity measured by the euglycemic clamp method. It should be noted that results calculated using different sampling schedules are not numerically interchangeable.1 In their study and in the present investigation, the relationship was strengthened somewhat by exclusion of the 30 min value, and the strongest association was present when only the pre-load and 120 min values were used. The standard deviation of the 30 min insulin concentration was more than two-fold higher than that for the 120 min value (Figure 1). Even after excluding one very insulin resistant subject, the standard deviation of the 30 min insulin concentration remained approximately one-third higher than the 120 min value. Thus, exclusion of the 30 min value may reduce variability, enhancing the precision of the point estimate for the MISI. In addition, differences in the relative contributions of hepatic and peripheral insulin sensitivities might have an impact on the strength of the relationship between MISI and other measures of insulin sensitivity. Abdul-Ghani et al.11 found that glucose values during the first 30 min of an OGTT were closely related to hepatic insulin sensitivity, whereas values later in the test correlated more strongly with skeletal muscle insulin sensitivity.
Because this was a sub-study4 to a clinical trial12 that specifically selected overweight and obese subjects with increased waist circumference, generalization of these results may be limited. Replication of these results in a wider range of subjects, including those with normal glucose tolerance and various manifestations of pre-diabetes is needed. It would also be of interest in future research to compare the performance of the MISI calculated from the OGTT and LMTT to directly evaluate the influence of the type of carbohydrate load employed on the performance of the MISI.
In summary, the primary findings from this analysis suggest MISI values obtained from reduced sampling schedules (0, 60, 120 min and 0, 120 min) may be useful for application in population studies and large clinical trials.
ACKNOWLEDGMENTS
KCM was responsible for the study concept and design and reviewed and edited the manuscript; CMC prepared the manuscript; KK and AL were study physicians who collected data and were involved in the design of the trial and interpretation of results; ALS performed all statistical analyses; MRD and TMR wrote the manuscript for the original validation study and reviewed and edited the present manuscript.
AUTHOR DISCLOSURE STATEMENT
Biofortis Clinical Research, Addison, IL received partial grant support for this study from Ingredion, Inc., Bridgewater, NJ (formerly National Starch, LLC). Biofortis Clinical Research, of which all the authors were employees at the time of data collection, has also received research funding from and/or provided consulting to Abbott Nutrition, Columbus, OH, the manufacturer of the liquid meal test product used. The funding agency was not involved in the writing of the manuscript.
CONFLICTS OF INTEREST
None


