INTRODUCTION
Cyclocross is a subdiscipline of cycling that can be described as a blend of mountain biking and road racing. The sport was introduced in Europe in the 1900s and the first Cyclocross World Championship was held in 1950. Since then, cyclocross has evolved into a popular sport in many European countries, including Belgium, France, and the Netherlands. According to the Union Cycliste Internationale (UCI), the discipline has increased in popularity in recent years, particularly in the United States, Asia, and in women’s participation overall.1 Such recent and relatively high participant growth in cyclocross justifies a better understanding of how the sport’s unique physiological demands affect athletes.
Cyclocross races are held on mostly off-road courses 2.5 to 3 km long for 40 to 60 min, depending on racing category. The courses can include a mix of pavement, gravel, grass, and sand and typically include hills, flat sections, and off-camber portions. Courses also include barriers or other obstacles which require riders to dismount and carry their bikes for stretches of the race.2 The sport is characterized by rapid changes in intensity ranging from highly explosive movements as riders accelerate out of turns to slower sections where riders navigate through more technical elements of the course. According to the UCI, the course terrain and obstacle placements must be arranged in a manner that creates a varied race pace, which allows riders to recover from difficult sections.2 In addition to exceptional bike handling skills, success in the sport seems to rely on an enhanced ability to utilize the anaerobic energy systems for short accelerations of power as well as a strong aerobic system to facilitate recovery between those high intensity bouts. Currently, however, there is little scholarly research to substantiate that claim.
Previous research has described the physiological profile of other cycling subdisciplines such as road racing3,4,5 and mountain biking.6,7,8 Fernandez-Garcia at al3 used heart rate (HR) to describe the intensity of the Tour de France and Vuelta a Espana. Similarly, Lim et al4 used HR and power data to identify time spent above or below lactate threshold during road racing. HR, power, and blood lactate [La-] have also been used to describe the exercise intensity of mountain biking,7,8 time trialing,9 stage racing,10 and downhill mountain biking.11 To our knowledge, no studies have described the sport of cyclocross specifically.
Measuring the physiological changes that occur during cyclocross will help to identify the energy systems that predominate during the activity. Determining the exercise intensity of the sport will help to improve training programs designed for cyclocross success, which could have implications for both performance as well as sport participation. The purpose of the current study was to describe the exercise intensity of a field based cyclocross race using HR and [La-] data.
METHODS
The study was designed to describe the exercise intensity profile of cyclocross racing. Each subject completed a laboratory and a field testing session. During the laboratory testing session, peak oxygen consumption (V̇ O2peak) was determined and HR and [La-] were measured during a graded cycling exercise test (GXT). Heart rate and [La-] values from the laboratory test were then used to identify HR at the following exercise intensities: LOW (HR below 2 mmol.L-1), MODERATE (MOD, HR between 2 and 4 mmol.L-1), and HIGH (HR above 4 mmol.L-1) as described previously.11 During field testing, subjects participated in an actual cyclocross race. Heart rate was monitored throughout the race and time in LOW, MOD, and HIGH was determined during the race based on laboratory data.
Subjects
Five male and three female subjects completed both the laboratory and field testing. The subjects were experienced, but nonelite cyclocross racers classified as category 2 or 3 according to USA Cycling.12 All subjects were volunteers and completed informed consent and medical history forms prior to participation. Subjects were excluded if they reported a current injury or a past or present illness on the medical history form. The methods and procedures were approved by the lead author’s Institutional Review Board.
Procedures
Laboratory tests: Approximately, 30 days prior to field testing, subjects underwent preliminary screening to determine anthropometric measurements and body composition. Body composition was estimated via the skinfold technique.13 Subjects then performed a maximal GXT on a cycle ergometer (Monark 894 Ea, Vansbro, Sweden). Personal clip-in cycling pedals were affixed to the ergometer. Resistance began at 60 W and increased by 35 W every three minutes until exhaustion. Subjects were instructed to maintain their cadence at 90 RPM. Metabolic variables were analyzed using a calibrated Parvo Medics metabolic cart (True One 2400, Sandy, UT). Capillary blood was taken from the fingertip at the end of each stage to determine [La-] (Lactate Plus, Nova Biomedical, Waltham, MA, USA). Heart rate was continuously assessed using a Polar RCX 3 HR monitor (Polar Electro Oy, Kempele, Finland). Rate of perceived exertion (RPE) was also assessed each incremental stage using the modified Borg 1-10 scale.14 The highest consecutive maximal oxygen consumption (V̇ O2) values in 1 min were averaged to determine V̇ O2peak.
Following the GXT testing, [La-]-heart rate curves were determined and linear interpolation was used to identify the HR and [La-] at various intensities.10,11 The following exercise intensity zones were established: LOW (HR below 2 mmol.L-1), MOD (HR between 2 and 4 mmol.L-1), and HIGH (HR above 4 mmol.L-1).11 Linear interpolation was also used to determine the percentage of V̇ O2 at a [La- ] of 4 mmol.L-1 (%V̇ O2OBLA).
Field test: Field testing consisted of participation in a cyclocross race. The race took place on a 2.7 km lapped course on varied terrain including grass, pavement, and barriers. The course was dry and environmental temperature was 3 °C at the start of each race. After pre-race [La-] was assessed, athletes were allowed to complete a self-directed warm-up. During the race, HR was recorded every 5 s using a coded Polar RCX3 HR monitor (Polar Electro Oy, Kempele, Finland). Blood lactate concentration was measured directly after completion of the race. Heart rate data was transferred to the manufacture’s software (Polar Personal Trainer) using a wireless transmitter (Polar DataLink, Polar Electro Oy, Kempele, Finland). Total race time, individual lap time, mean heart rate (HRmean), and maximum heart rate (HRmax) were recorded. Time in each exercise zone (LOW, MOD, HIGH) was then calculated using data from the laboratory baseline testing.
Statistical Analyses
Given the exploratory purpose of this study, descriptive statistics were calculated for laboratory and field test variables. Oneway repeated measures Analysis of Variance (ANOVAs) were conducted to analyze mean differences in HR and time per lap for each of the 6 laps. An a priori alpha level of 0.05 was set. Data analysis was conducted using SPSS version 21 (IBM, New York, NY, USA).
RESULTS
The mean V̇ O2peak for the subjects during laboratory testing was 60.16±9.98 mL.kg-1.min-1 and the mean %V̇ O2OBLA was 74.38±9.23%. Descriptive statistics for age, height, weight, body fat, V̇ O2peak, and %V̇ O2OBLA are presented in Table 1. During the course of the race, on average subjects spent 00:08.8±00:10.3 (mm:ss) in LOW, equivalent to 0.4±0.4% of the race. Subjects spent an average time of 02:27±02:37 3 (mm:ss) in MOD, and an average time of 38:09±03:47 3 (mm:ss) in HIGH, which equates to 6.1±6.7% and 93.6±6.7% of the race, respectively. Heart rate increased immediately at the start of the race and remained elevated for the duration of the effort (Figure 1). Subjects had an average HR of 170.8±10.1 beats per minute (bpm) and a HRmax of 182.0±8.4 bpm while participating in the race. In comparison, while participating in the laboratory V̇ O2peak test, subjects recorded a HRmax of 178.6±7.8 bpm. Subjects had an average [La- ] of 12.0±1.8 mmol/L-1 following the maximum graded exercise test in the laboratory. Post-race blood lactate was 8.3±1.1 mmol/L-1. A full summary of the descriptive statistics for physiological variables measured in the laboratory and during the cyclocross race are available in Table 2.
| Table 1. Descriptive Statistics for Subject Demographics (N=8). |
|
Variable
|
Mean |
SD
|
|
V̇ Age (yr)
|
36.00 |
4.82 |
| Height (cm) |
171.50 |
9.08
|
|
Weight (kg)
|
68.33 |
9.20 |
| Body Fat (%) |
14.71 |
2.68
|
|
V̇ O2peak (L/min) a
|
4.15 |
0.80 |
| V̇ O2peak (mL.kg-1.min-1) b |
60.16 |
9.98
|
|
V̇ O2OBLA (mL.kg-1.min-1) c
|
44.56 |
8.86 |
| V̇ O2OBLA (%) d |
74.38 |
9.23
|
| aabsolute peak oxygen consumption, brelative peak oxygen consumption, coxygen consumption at a [La-] of 4 mmol. L-1 (onset of blood lactate accumulation), dpercentage of V̇ O2 at a [La-] of 4 mmol. L-1. |
| Table 2. Descriptive Statistics for Physiological Markers for Laboratory Tests and Race Characteristics. |
|
Variable
|
Mean |
SD
|
| Laboratory Tests |
|
[La-]max (mmol. L-1) a
|
12.0 |
1.8 |
| HRmax (bpm)b |
178.6 |
7.8
|
|
HR2 (bpm)c
|
115.3 |
20.1 |
| HROBLA (bpm)d |
155.6 |
13.6
|
| Race Characteristics |
|
HRmax (bpm)b
|
182.0 |
8.4 |
| HRmean (bpm)e |
170.8 |
10.1
|
|
% HRmax f
|
94.0 |
2.4 |
| Finish Time (mm:ss) |
40:30 |
2.19
|
|
Pre [La-] (mmol.L-1)
|
1.9 |
0.7 |
| End [La-] (mmol.L-1) |
8.3 |
1.1
|
|
Time in LOW (mm:ss)
|
00:08.8 |
00:10.3 |
| Time in MOD (mm:ss) |
02:27 |
02:37
|
|
Time in HIGH (mm:ss)
|
38:09 |
03:47 |
| % Time in LOW |
0.4 |
0.4
|
|
% Time in MOD
|
6.1 |
6.7 |
| % Time in HIGH |
93.6 |
6.7
|
| amaximum blood lactate, bmaximum heart rate, cheart rate at 2 mmol.L-1, dheart rate at 4 mmol.L-1, emean heart rate, f percentage of maximum heart rate. |
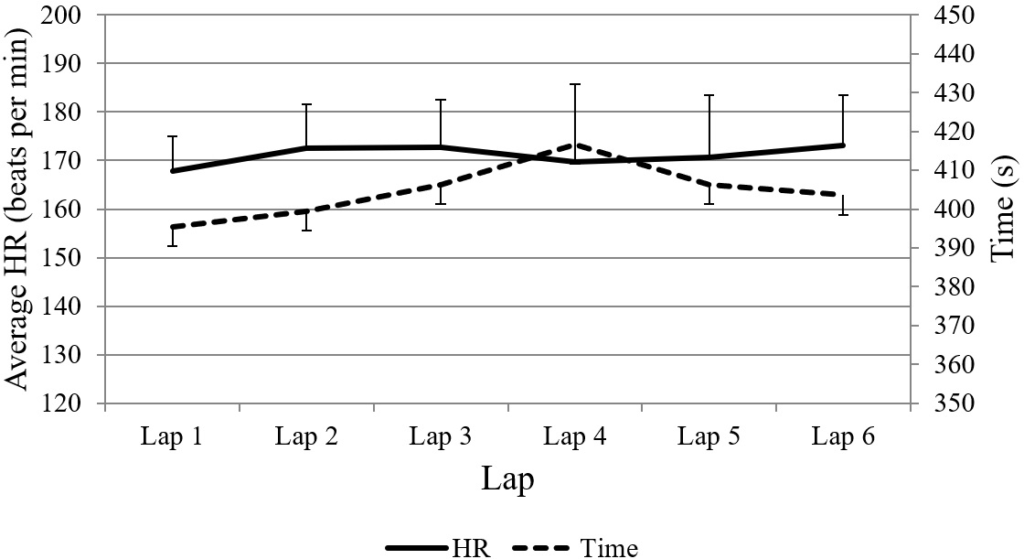
Two one-way repeated measured ANOVAs were conducted to examine whether a significant mean increase in time or HR was found per lap over the six laps of the cyclocross race. In the examination of both lap time and HR, the assumption of sphericity was violated (both ps<0.001), therefore the Greenhouse-Geisser epsilon adjustment was applied.15 No significant mean difference was found in time per lap over the six laps, F(1, 10)=2.16, p=0.17, ηp 2 =0.21. No significant mean difference was found in HR per lap, F(1, 8)=1.29, p=0.29, ηp 2 =0.16 (Figure 2).
DISCUSSION
Although, much research has been devoted to describing the exercise intensities of various cycling disciplines, to our knowledge this is the first study to examine the physiological demand of cyclocross racing specifically. The subjects in this study were experienced category 2 or 3 cyclocross racers. The V̇ O2peak of the male subjects (63.4±10.8 mL.kg-1.min-1) indicated a high level of fitness, but was lower than values reported for elite male road cyclists and mountain bikers. In their review, Lucia et al5 reported values between 70 and 80 mL.kg-1.min-1 for professional road cyclists and Impellizzeri and Marcora6 reported values between 66.5 and 78 mL.kg-1.min-1 for elite mountain bikers. The values of the males in the current study were similar to those of elite downhill mountain bike racers and were higher than values reported from trained (11±5 h/wk) recreational cyclists.11,16 The %V̇ O2OBLA (71.8±9.7%) also indicated a high-level of fitness, but was lower than anaerobic threshold values reported in elite cyclists.5,6 The V̇ O2peak values for the females (54.8±4.8 mL.kg-1.min-1) were lower than values reported by Abbiss et al17 for elite road cyclists, but similar to those reported by Lim et al.4
The % in females in the current study (78.7±6.5%) indicated a high-level of fitness and was similar to or higher than anaerobic threshold values found in female cyclists.4,18 These maximal and submaximal fitness variables reflect an enhanced aerobic capacity and are consistent with a group of highly trained, yet non-elite cyclists. Race performance was completed on a 2.7 km lapped course which included elements such as barriers, run-ups, and varied terrain as required by the UCI.2 Average lap time was 405.67±67 s which corresponded to a speed of 23.9 kph. The purpose of the study was to describe the exercise intensity of cyclocross using heart rate and blood lactate data.
While cycling in general is considered aerobic exercise, the physiological demands of racing various cycling subdisciplines like road, mountain, and cyclocross require a significant contribution from the anaerobic energy pathways as well. Lim et al4 examined the exercise intensity profile of road cycling by comparing male and female physiological responses to a road race over the same course and distance. In the road race, both the male and female competitors spent a portion of the race below, at, or above lactate threshold (males: 57%, 10%, and 33%; females: 62%, 10%, and 28%). In the current study, the percentage of time spent in LOW, MOD, and HIGH zones was quite different (0.4%, 6.1%, and 93.6%, respectively) indicating that cyclocross racing is performed at far greater intensities than road racing. The high intensity effort of cyclocross racing was also confirmed by high blood lactate levels following the race (8.3±1.1 mmol.L-1). Road races are of a longer duration than cyclocross races leading to a greater reliance on the aerobic energy system. Lim et al4 reported a mean time of 03:24:41±00:50:04 for the women’s race and 02:39:59±00:46:02 for the men’s race. In contrast, the mean finish time for the cyclocross race in the current study was much shorter (00:40:30±00:02:19). The shorter duration of cyclocross racing compared to road cycling events allows for a much higher exercise intensity level that would not be possible to maintain over a longer duration of time. In the same study, Lim et al4 evaluated the exercise intensity of a criterium race performed over a shorter duration which provides a better comparison to the sport of cyclocross. The mean finish time for the men was 01:02:20 and 01:09:34 for the women. Not surprisingly, the exercise intensity of the shorter criterium race was higher than the road race (males: 63% above LT, females: 71% above LT), but the effort was still far lower than what we saw during cyclocross racing (Time in HIGH=93.6%).
One of the reasons the disciplines vary greatly in exercise intensity is because there is less opportunity to lower intensity by decreasing air resistance (or drafting) in cyclocross than in road and criterium racing. Road and criterium racers can spend much of a race in a sheltered position which can lower energy use by 40% and will lower submaximal, heart rate, and lactate values.19,20 Drafting is not as common in cyclocross because the technique is not as beneficial at lower speeds and because it is difficult to perform on varied terrain.21 The relative speed in cyclocross is lower than speeds found on the road due to the increased rolling resistance of the terrain and the need to navigate through obstacles and/or turns in the course. Because of the difference in drafting, cyclocross is a related but different sport than road or criterium racing, defined much less by teamwork and therefore effort sharing. Without the benefit of drafting, exercise intensity remains high in cyclocross throughout the race.
Based on the results of the current study, it seems that the exercise intensity profile of cyclocross is also higher than that of mountain biking. Impellizzeri et al7 analyzed the effort of mountain bike racers during four cross country races. Heart rate data was used to identify the percentage of time each rider spent in the “easy” (HR below lactate threshold), “moderate” (HR between lactate threshold and OBLA), or “hard” (HR above OBLA) zones during the race. The athletes spent 18±10% in the “easy” zone, 51±9% in the “moderate” zone, and 31±16% in the “hard” zone. Although, the exercise intensity profile of mountain biking is higher than that of road racing, it is still much lower than what we found for cyclocross. According to the UCI, cross country mountain biking races typically range from 90 to 105 min, making them a longer duration than a typical cyclocross race (40-60 min).22 Similar to road racing, the longer duration event will result in lower intensities and a higher contribution of the aerobic energy system.
The start of a cross country mountain bike race is similar to the start of a cyclocross race in that it is characterized by a supramaximal effort. Athletes typically sprint to get first position before the field encounters either a narrowing of the trail, a significant turn, or an obstacle. If the athlete gets the first position, he or she can then navigate through the varied terrain unimpeded by slower or less technically advanced riders.6 The explosive nature of the start corresponds with near maximal heart rate values seen almost immediately.7,8 In our study, we also saw abrupt increases in heart rate within seconds of the start (Figure 1). But while the explosive starts are similar, cross country mountain biking includes significant amounts of descending and thus opportunity for recovery leading to more time in lower intensity zones versus cyclocross. In addition, while peak heart rates are seen in the first lap of a mountain bike race because of the intensity of the start, heart rate and lap times tend to decrease as the race continues.7 This differs markedly from what we found in cyclocross racing where heart rate values peaked immediately and remained high throughout each lap. HRmax during the race was higher than HRmax recorded during the laboratory testing (182.0±8.4 bpm versus 178.6±7.8 bpm). The higher HRmax recorded during the race provides some evidence that subjects only achieved V̇ O2peak values during laboratory testing. We observed no differences in heart rate or time between laps throughout the race indicating a consistent and high effort for the entire duration (Figure 2).
Figure 1. Individual Heart Rate Data During Cyclocross Race. For Clarity Purposes, Data from Only Five Participants is Displayed.
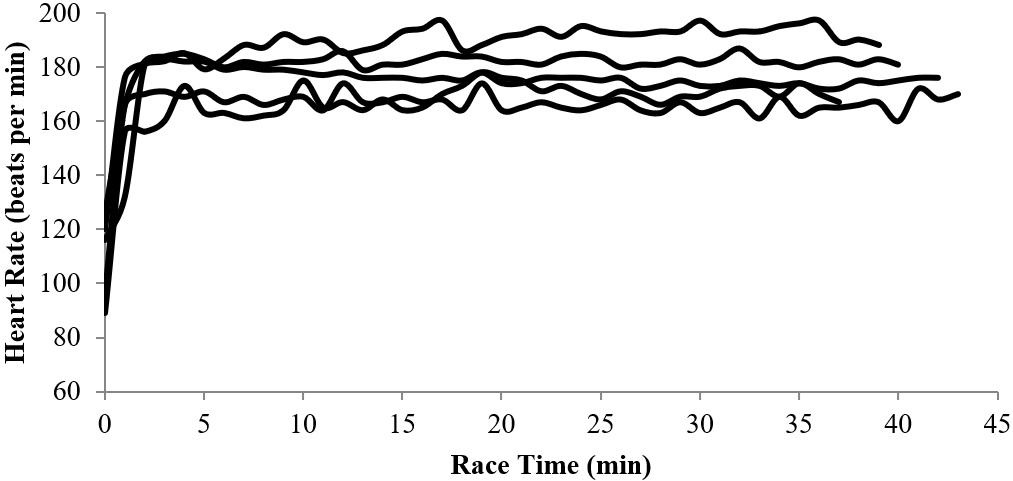
Figure 2. Average Heart Rate (Beats per Min) and Lap Times (s)±SD for Cyclocross Racers Across Six Laps. Note. Average HR (-SD), Time (+SD), N=8.
The combination of the intense start and the stochastic nature of cyclocross could be the reason why heart rate values remained high throughout the race. There are elements of the competition; however, that are less intense. For example, riders must slow to corner around obstacles or to navigate their way through technical elements of the course. The time it takes to move through these sections is short though and frequently followed by maximal sprints leading to large power oscillations during the race. Despite the likely power differences, %HRmax during the race remained high and time in LOW and MOD was minimal. There are a variety of possible mechanisms that may explain the heart rate response to high intensity intermittent exercise. Heart rate increases or decreases due to neural and hormonal input and while changes occur quickly, there is a delay in the response of the cardiovascular system during interval exercise.23,24,25,26 Heart rate recovery takes longer following intense (80% V̇ O2 reserve) versus moderate exercise (50% V̇ O2 reserve).27 Parasympathetic reactivation has also been found to take significantly longer following exercise using the anaerobic energy pathways.28 The results of the current study imply that cyclocross requires a large contribution from the anaerobic energy systems. It is likely though that the sport is characterized by abrupt fluctuations in effort such that power values vary widely, but heart rate remains elevated due to the limited recovery time during repeated high intensity bouts. In addition, heart rate is affected by race anxiety or excitement which could cause disproportionally high heart rates not related to workload.29,30 While heart rate may be an indicator of whole body effort, it may not fully describe exercise intensity. Future research should examine heart rate-power curves during cyclocross racing so that the intensity of the sport can be more completely described.
CONCLUSION
Cyclocross racing is performed at a higher intensity than road, criterium, or mountain bike racing. The time spent in the HIGH zone in the current study (93.6%) suggests that the sport requires a significant contribution from the anaerobic energy systems. Coaches who design training programs for these athletes should consider this exercise intensity profile in their prescriptions.
ACKNOWLEDGEMENTS
The authors would like to thank the subjects who gave their time and effort to participate in this study. This research was supported by a faculty research grant from the lead author’s institution.
CONFLICTS OF INTEREST
The authors declare that they have no conflicts of interest.
PARTICIPANTS’ CONSENT
All subjects were volunteers and completed informed consent and medical history forms prior to participation. The methods and procedures were approved by the lead author’s Institutional Review Board.