INTRODUCTION
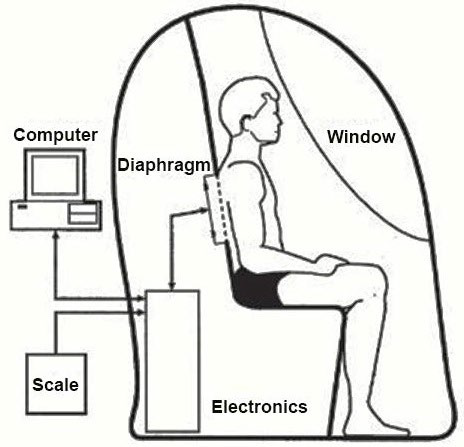
The air displacement plethysmograph or its trade name BOD POD® (BOD POD) which is more familiarly known uses the inverse relationship between pressure (P) and volume (V) to derive body volume of a participant from a 750 L fibreglass shell that comprises of two chambers.1 Firstly, the test chamber that accommodates the participant during testing and secondly, the reference chamber that contains instrumentation for measuring changes in pressure between the two chambers.2,3,4 The moulded front seat forms a common wall separating the test and reference chambers, each with an approximate volume of ≈450 and 300 L respectively connecting the two chambers5 as shown in Figure 1. The volume of a participant body is measured indirectly through the application of relevant physical laws (Boyle’s Law) by subtracting the volume of air it displaces inside an enclosed chamber when the participant is inside, from the volume of air in the chamber when it is empty.4,6,-8
Figure 1. General Arrangement of Chambers, Participants and Diaphragm. (Life Measurement Inc.,)9
With the procedural difficulties associated with hydrostatic weighing, the introduction of air displacement plethysmography in 1995 gained popularity among body composition researchers.3,8,10 This is mainly attributable to the BOD POD offering several viable operating alternatives to hydrostatic weighing.11,12 For instance, by replacing the intimidating inconvenience of water immersion (~30 minutes) with the comfort of air (~5 minutes), can place fewer demands on the participant.3,5,14 As a result, there is potentially a wider clinical application including athletes, children, obese, older adults and people with disabilities.8,14,15 However, since its development, researchers have reported varying degrees of reliability and validity issues.16 For instance, Collins et al17 reported reliability values of 0.994 and a technical error of measurement of 0.448% and discovered
that BOD POD whole body density measurements (1.064±0.002g.ml-1) were significantly greater (p<0.05) than hydrostatic weighing whole body density (1.060±0.002 g.ml-1), concluding that that the BOD POD was over predicting whole body density. 17 Interestingly, Lockner et al18 found there was a significant difference between average BOD POD whole body density (1.0466±0.0187 g.ml-1) and average hydrostatic weighing whole body density (1.0403±0.0187 g.ml-1) (p<0.0005). From a practical point of view, there have been even been reports that obese participants and large athletes on occasion have struggled to sit inside and close the BOD POD.
As part of the quality assurance process, the BOD POD was rigorously tested by the manufacturers, Life Measurement Inc. (LMI), Concord, CA, USA, to establish accuracy, reliability and linearity for both volume and mass measurements.2,9 These quality assurance processes are undertaken by the manufacturer before to distribution and installation of the BOD POD, where multiple tests of 20 kg, 40 kg, 60 kg and 80 kg masses and 30L, 50L and 90L volumes are conducted.9 However, in order to maintain the accuracy of the BOD POD on a day-to-day basis, further quality control procedures are required in situ.9 These quality control procedures consist of a mass and volume calibration which are conducted before every testing bout and are
designed to check the linearity and reliability of the BOD POD system.9 These calibration techniques were executed following the manufacturer’s automated process by inputting measured values via the user interface. The procedure required the primary investigator to perform sequential steps without interruptions with equipment provided by LMI, Concord, CA, USA.18
METHODS
Calibration measurement protocols for both mass and volume were rigorously followed in accordance with the step by step instructions given on the BOD POD (BOD POD model 2000A, LMI, Concord, CA, USA) system computer. This procedure required the researcher to perform five sequential calibration attempts without interruptions for both mass and volume.
Measurement Procedure for Mass
The routine mass calibration procedure was followed and the researcher was able to sequentially add known (actual) calibration masses ranging between 10 kg to 30 kg. Although not ideal, given the likely range of measurements in practice, the relationship between actual and predicted mass could be plotted (0-30 kg) and extrapolated linearly to likely measurement values within a realistic range.
Measurement Procedure for Volume
Following the routine volume calibration procedure where calibration is repeated if two of the five mean volume measures are not between 49.900 L and 50.100 L.9 The researcher was able to sequentially add up to ten known (actual) volumes corresponding to 118.40 L (i.e., 11.84 L, 23.68L, 35.52L, 47.36L, 59.20L, 71.04L, 82.88L, 94.72L, 106.56 L and 118.40 L). The known volumes were established using balloons that were each inflated with 12 L of air using a Morgan Medical 3L calibration syringe (Ferrari’s Cardio Respiratory Ref 0413, Morgan Medical Ltd., Rainham, Kent, England) (i.e., 4×3 L=12L volume of air into each balloon). Un-fortunately due to the practicalities of the inflation procedures, releasing of the syringe and tying of each balloon resulted in χ 0.16 L of air being lost. Each balloon was verified as having a known volume of 11.84 l through the normal BOD POD calibration process of 5 volume measurements in succession.
Data analysis included a scatter plot of actual (known) against predicted (measured) mass values was produced to illustrate the agreement between the predicted mass and actual mass measures and extrapolated between 40 to 120 kg (Figure 2).
Figure 2. Actual (known) versus Predicted (measured) Mass and Extrapolation for the Bod Pod through the Likely Measurement Range. Note: Extrapolated from 40.00-120.00 kg
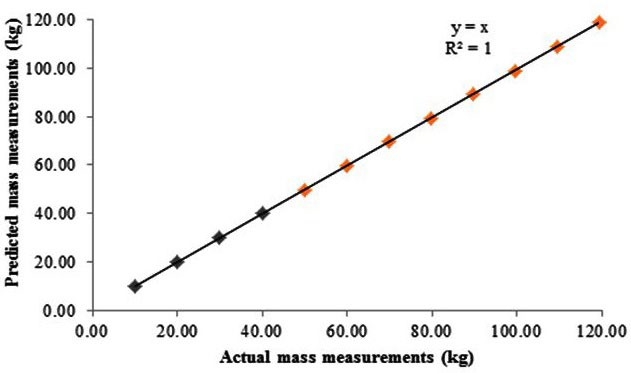
Figure 3 illustrates the agreement between the actual (known) against predicted (Manufacturer’s calibration equipment included two 10 kg calibration National Institute of Standards and Technology (NIST), Gaithersburg, MD, USA weights that are used on the digital weighing scale to calibrate mass and a 50.110L calibration cylinder that is used within the BOD POD chamber to calibrate volume). Given the central importance of accurate estimation of body mass and body volume in determining body composition, the aim of this methodological investigation it is crucial to independently review both the linearity and reliability of mass and volume measurements for the BOD POD and to further examine the calibration approaches throughout the potential measurement range (measured) volume values and the linearity through the likely (practical) measurement range. The bias and 95% limits of agreement between the actual (known) against the predicted (measured) volumes are illustrated in Figure 4. Paired t-tests were undertaken to determine whether significant differences were present between the known and measured volumes.
RESULTS
Results revealed that for all mass measurements between 10-30 kg the known mass and measured mass were in agreement (Figure 2). Furthermore, measures of mass between 40-120 kg extrapolated (Figure 3) to estimate the value of masses outside the range tested.
Figure 3. Actual (known) and Predicted (Measured) Volumes from the BodPod through the Likely Measurement Range.
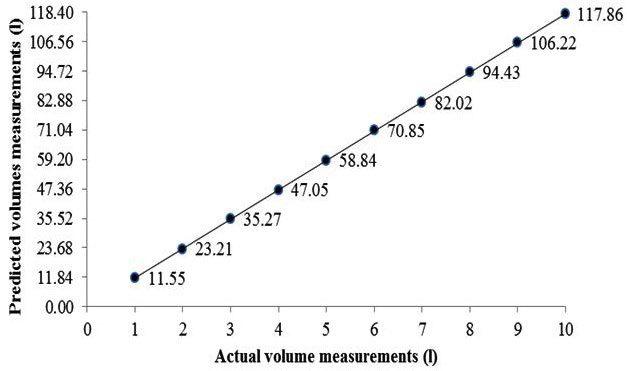
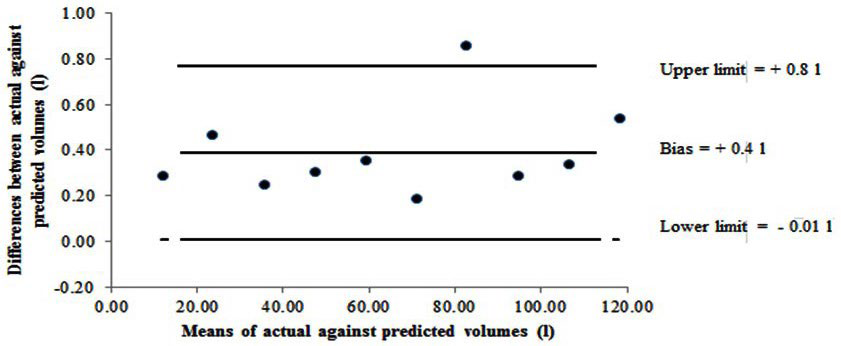
Results revealed that for all volume measurements, the predicted (measured) volume differed from the actual (known) volume by as little as 0.2 L and as much as 0.9 L (Figure 3). When comparing the agreement between the actual (known) volumes against the predicted (measured) volumes, results indicated systematic bias whereby the predicted (measured) volumes were underreported compared with the actual (known) volumes (Figure 4). There was a difference between actual (known) (mean±SD=65.1±35.9 L) and predicted (measured) (64.7±35.8L), t9=6.35 p<0.01.
Figure 4. Bland and Altman Plot Showing Bias and 95% Limits of Agreement between the Actual (known) Against the Predicted (Measured) Volume for Bod Pod. Note: A positive bias indicates higher actual (known) values in relation to the predicted (measured) values.
CONCLUSION
With regards to mass, the calibration masses from 10-30 kg were in agreement and in line with the BOD POD system quality control process when checking mass linearity and reliability.9 However, one might question the relevance of only being able to calibrate a measurement tool to a maximum of 30 kg, especially when the body mass of participant’s are certainly in excess of 30 kg. As LMI, Concord, CA, USA, calibration equipment consists of two 10 kg calibration NIST weights for the calibration process on the digital weighing scale, this does pose the question whether the BOD POD system is designed to provide operator ease when lifting relatively light weights repeatedly or whether it checks the linearity across the mass scale. Similarly the reliability and linearity of the volume scale was measured within the BOD POD system at 30 L, 50 L and 90 L. Results from the adapted volume calibration trial using balloons revealed underreporting of predicted (measured) volumes by 0.4 L, which slightly exceeds the LMI, Concord, CA, USA, recommended calibration range between 0.01-0.21 L.9 Given the importance of accurate estimation of body volume in determining body
composition, it is questionable why LMI, Concord, CA, USA only provide a 50.110 L calibration cylinder and again poses the question of operator ease versus linearity. It is unfortunate that there is no facility to independently test the BOD POD for the linearity of the mass and volume scale, therefore conducting quality control procedures throughout the potential measurement range (in relation to the population sample) is something that should be taken into account in future research. On the basis of this methodological investigation however, it is possible to be broadly confident with the linearity and reliability of mass and volume measurement outcomes throughout the measurement range from the BOD POD involving a reasonable level of rigour.
CONFLICTS OF INTEREST
The authors declare that they have no conflicts of interest.